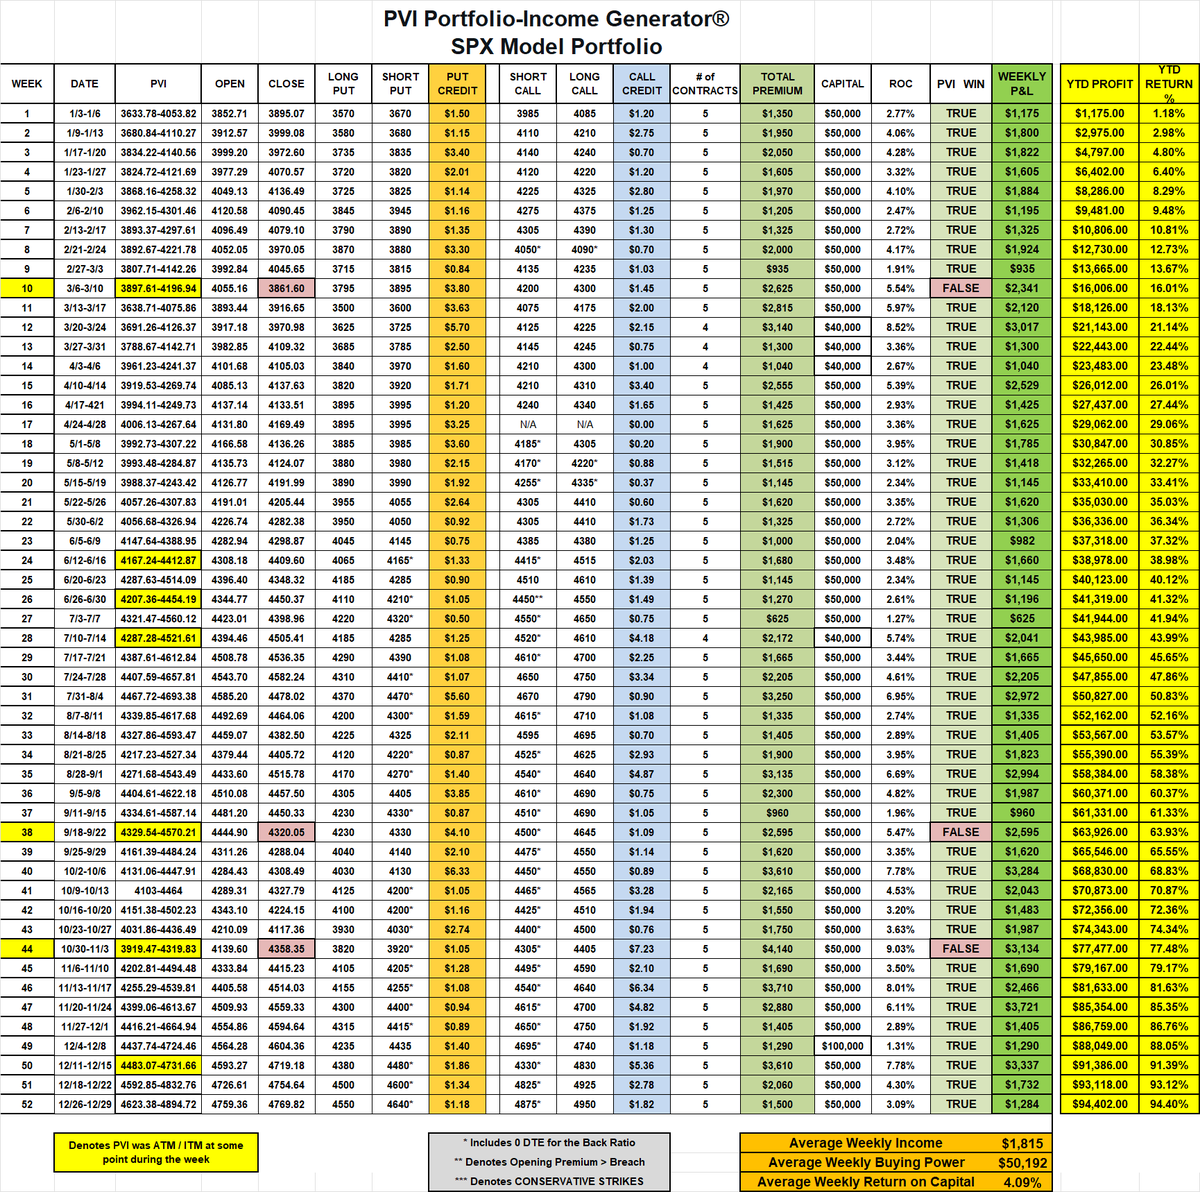
2023 PVI Portfolio-Income Generator® $SPX Model Portfolio finished up $94,402 (94.40%) in 2023‼️ 💥💰💥
▪️ Over $100,042 in premium received (on just $50k Buying Power)
▪️ Averaged $1815 in INCOME per week
▪️ 4.09% Weekly Return on Capital
▪️ 3 closing breaches 49/52 (94.23% Success Rate)
▪️ The no hedging system resulted in a NET GAIN of $58,032‼️
▪️ The Model Portfolio was again perfect for 2023...52 Straight weeks of PROFITS for the year
WE TRAIN⚔️
WE TEACH✍️
WE COACH🔥
WE LEAD BY EXAMPLE🎯
Proprietary trading algos, Institutional Levels, & trading systems for all asset classes- our community is worth far more than a monthly fee!
#IncomeGenerator #TradersHelpingTraders #TeamITG #SPX #SPY #ES #QQQ #IWM #DIA #TLT #VIX #VX #DXY #BTC #Trading #Stocks #Options #Futures #Investing #SP500 #Money #Millionaire #Profits #Winning #SellingOptions #Theta #WeeklyPremium #IronCondors #Strangles #Straddles
The Red State Brain Drain Isn’t Coming. It’s Happening Right Now. https://t.co/5Scluxugg3 Follow @newrepublic Timothy Noah writes one of the best articles I've read in a long time.
You’ve heard of girl math, but what about Republican math?
This week, Republicans tried to blame older Americans for our growing national debt—but in 2017, they passed tax cuts for the wealthy that added $1.8 TRILLION to the debt.
Republican math doesn't add up.
JUST IN: Jonathan Lewis, a teenage boy who was beaten up by 15 students at a high school in Las Vegas, Nevada had died.
Throw them all in prison for life.
According to the boy's father, the brutal beating happened after 17 year old Jonathan Lewis stood up for one of his "smaller friends."
"A couple (of kids) attacked him, and they weren’t able to hurt him enough, and they all attacked him at once," the father, Jonathan Lewis said.
In an emotional interview with a local news station, Lewis' father remembered his son, saying he was a quiet kid and they had plans to move to Austin, Texas together.
"I just love my children with all my heart, and it’s just unimaginable that we could ever come to this point," Lewis, said.
"I think there’s just a failure of all of humanity to recognize that we need to be teaching our youth how to coexist."
Lewis had kept his son on life support hoping for a miracle.
Lewis was an artist and was considering joining the United States Navy like his grandfather.
Devastating.
What an EOW move on SPX! We held the 4355 level today (after closing below yesterday) and rocketed into a trend day and closed at the 4415 target (and the .618 from the July Highs).
Yesterday's sell off was started with the awful 30 YR bond auction and continued into the close. Today we saw a bounce back from that selling, with very little selling after the EU close.
Now that we have filled the 4400 gap and have broken above the 100D SMA, I would be hesitant to continue with the trend. Do you want to be early? HELL NO. But volume has been slowing into the EOW and we are hitting major HTF resistance. It'll be interesting to see where the GLOBEX session opens, but be wearing of longing into Monday as we hit this upside levels.
I am away on Vacation next week, so I won't be putting out much trading related content until I'm back.
Hopefully everyone has a wonderful weekend - get some rest and be prepared for next week. I'm personally excited to be away from the screen to get a much needed mental and physical reset.
#ES_F #SPX #TechnicalAnalysis #Stocks #Investing #FED #Bullish #Bearish #DXY #VIX #TradersHelpingTraders #DD #WeeklyReview
@IndieTraders@VeteranWallSt
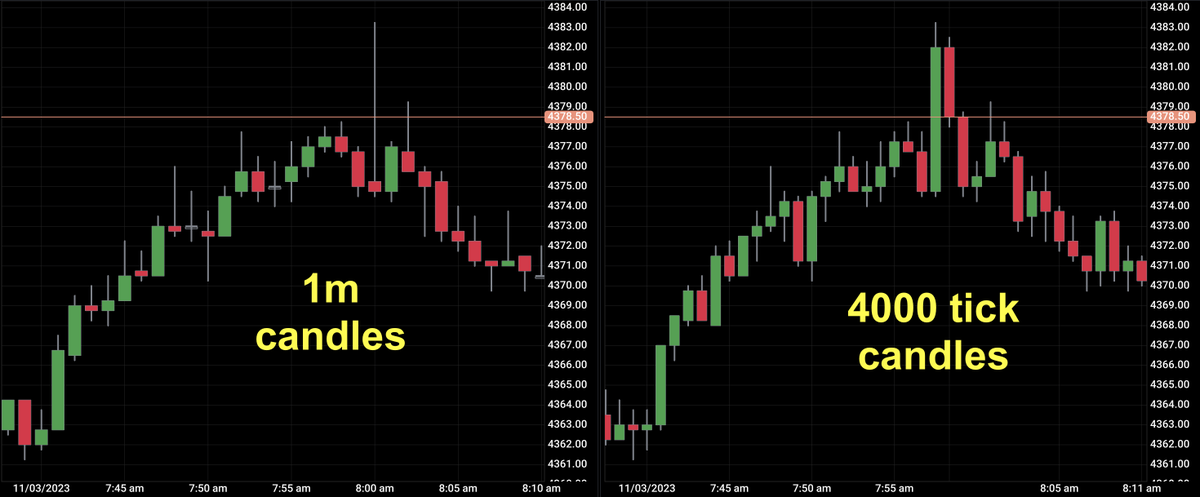
🤔 Ever wonder the difference between
Tick charts and Candlestick charts in futures trading?
Here's the quick rundown:
Candlestick Charts plot price movement over a fixed time interval. They're about consistency and pattern over time.
Tick Charts move with market transactions. They're about market activity and momentum in the now.
🔍 Let's break it down:
Candlestick Charts:
- Time-based (1m, 5m, 1h, etc.)
- Ideal for spotting patterns & trends
- Provide a historical view of price action
- Good for strategic, longer-term analysis
Tick Charts:
- Transaction-based (500, 1000 ticks, etc.)
- Highlight real-time trading activity
- Offer clarity in fast-moving markets
- Great for tactical, precision trading
Pros of Tick Charts:
- Visualize market momentum instantly
- Identify volume spikes and breakouts
- Reduce noise in low-activity periods
Pros of Candlesticks:
- Universal use across markets
- Easy to read and understand
- Strong for historical analysis
Combining the two:
Candlesticks give you the market's rhythm, while
Tick charts let you feel its pulse.
You can use both to get two different perspectives on the market...
Happy Trading!
#FuturesTrading #MarketAnalysis #Trading #TradersHelpingTraders #ES #NQ #MES #MNQ $ES_F $NQ_F #Options #DayTrading #SPX #SPY #VIX #BTC