Swing trader · MBA Finance, NMIMS · 6 yrs in markets
Charts, setups, breadth, psychology & lessons from the greats
Journal, not advice · Not SEBI-registered
I've been in Indian markets since 2020.
For years I traded like most people: tips, hope, no plan.
This year I stopped and built a process.
Here's exactly how I swing trade now, and what you'll find on this account 🧵
Retail investors call it "long-term buy and hold," but the peak-to-trough data tells a different story:• 2023–24 Market Darlings vs Reality: RVNL (-68%), Jupiter Wagons (-69%), IRFC (-65%), Titagarh Rail (-56%), and IRCTC (-59%) are all down heavily from their all-time highs.• The 10-Year Survival Rate: Out of 42 BSE PSU Index stocks with a 10-year trading history, only 6 outperformed the benchmark index over that full decade.• Volatility Trap: The Smallcap index has seen 11 separate corrections exceeding 15% over a 6-year period. "Buy and forget" works for index funds — doing it with individual stocks without quarterly fundamental reviews is just wealth destruction in slow motion.
Yes, the classic "Large caps are safe, buy & hold never fails" playbook. Tell that to the folks who "bought and forgot" YES Bank, RCom, Unitech, or Suzlon when they were proud Nifty 50 darlings.
"Buy and hold" without reviewing business fundamentals isn't investing — it's just long-term bagholding with a PAN card.
If prioritizing capital protection with steady compound returns, CP Plus (Aditya Infotech) is the safer bet due to market dominance in security.
But if aiming for maximum 2-year alpha and comfortable with volatility, Kanohar Electricals offers higher upside linked to power capex expansion.
Most traders decide position size by feel.
I use one formula:
Position size = Risk ÷ Stop distance
At 0.5% risk on ₹10 lakh, every stop-out costs exactly ₹5,000, whether the stop is 3% away or 10%.
Bookmark this table. Use it before every trade.
@stockifiabhijit And a ship survives a breach because of its bulkheads. One flooded compartment doesn't sink the vessel.
Position sizing is a bulkhead. Let one trade fill with water, never the whole hull.
@nakulvibhor Agree. And depth shows up in one place: knowing when your indicator stops working.
Anyone can read a moving average. Very few know which market regime makes it lie.
Since 2008, Nifty fell 10%+ at some point in 14 of 18 years.
11 of those 14 years still ended positive.
The drawdown is the normal part. Panic is optional.
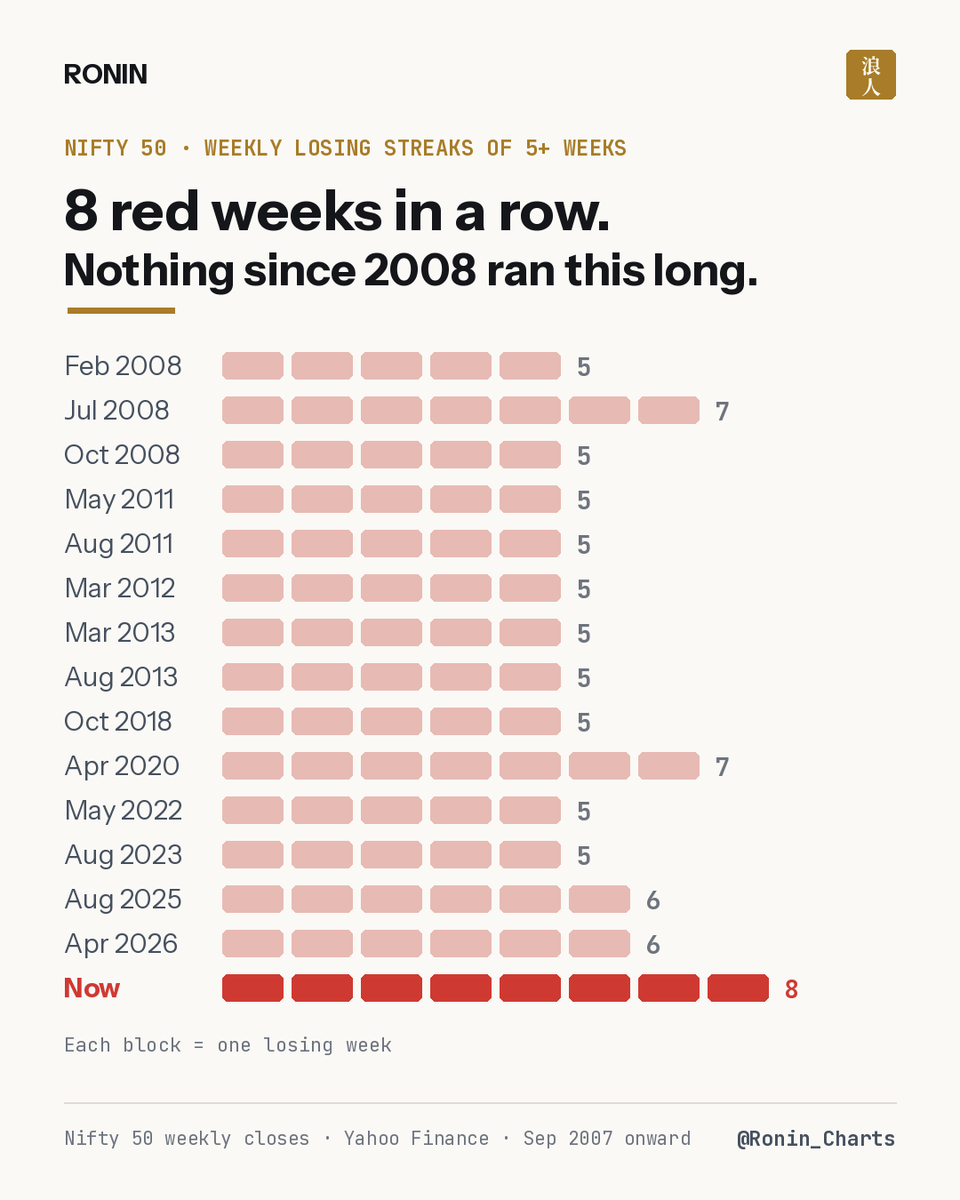
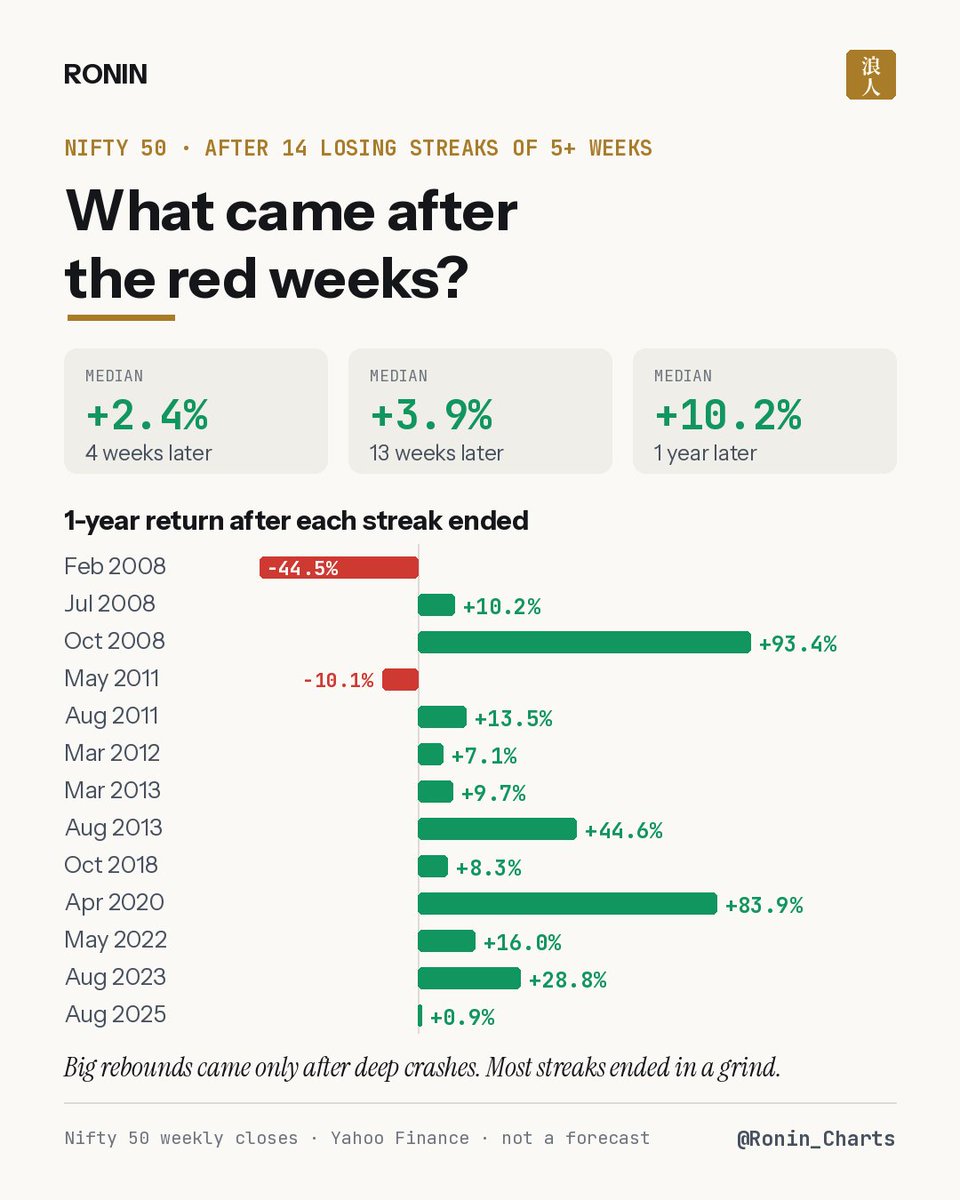
@kirubaakaran Checked every Nifty losing streak of 5+ weeks since 2008. There were 14 before this one. The longest were 7 weeks, in July 2008 and April 2020. This is the first 8. What came next (median): +3.9% after 13 weeks, +10.2% after a year. Mostly a grind, not a rocket.
What happened after those 14 losing streaks? (median)
→ 4 weeks later: +2.4%
→ 13 weeks later: +3.9%
→ 12 months later: +10.2%
The big rebounds (+93%, +84% in a year) came only after deep crashes: Oct 2008 and Apr 2020.
Twice it kept falling: Feb 2008 and May 2011.
Streaks end with grinding more often than with rockets.
8 red weeks in a row for Nifty.
I checked every losing streak of 5+ weeks since 2008. There were 14 before this one.
The longest: 7 weeks, in July 2008 and April 2020.
This is the longest since at least 2008.
What happened after those 14:
→ 13 weeks later: higher 9 of 14
→ 52 weeks later: higher 11 of 13
History isn't a forecast. But long streaks have usually ended in frustration, not collapse.
Good baseline, but index drawdowns are non-linear at the stock level. Historically, a 10% index 'correction' translates to a 25–35% median drawdown in high-beta momentum stocks. Tracking market breadth (% of stocks above 50/200 DMA) gives a far cleaner picture of underlying market health than index-level arbitrary cut-offs.
@ChartMantra_@markminervini Absolutely. Minervini’s real edge isn't just the technical setups; it’s the relentless discipline to do the boring, routine work every single day. Committing to a single proven strategy for a decade is the ultimate filter for long-term survival.
@finallynitin Exactly. Relative strength is the ultimate truth-teller during a pullback. The real test for those Category 1 and 2 names is maintaining their tightness without getting dragged down if the broader market actually prints that next lower low
@stocksbyrishabh Same pattern shows up with scary red months.
Every 5%+ monthly fall in Nifty since 2008: 12 months later, Nifty was higher 16 of 21 times.
Headlines move faster than earnings.
@StocksBuy7 Respect for posting the red. Asli trader yahi hai.
My biggest loss wasn't one bad trade. It was averaging down into one. The chart was fine. My ego wasn't.
@traderayushi 21,000 → 12,000 is a 43% fall in about five weeks.
For scale: Covid took 69 days to cut Nifty 38%. 2008 took 293 days to cut it 60%.
Bookmarking. Mostly to see if Diwali sets a new world record.
@EquityInsightss Speedy recovery, Tejas. Your Nifty 500 "how deep is the correction" iceberg is one of the best breadth visuals on Indian X. Looking forward to the next one.
@dhawal20jain Checked what followed every 5%+ monthly fall in Nifty since 2008 (21 instances, to 2025):
Next 3 months: up only 11 of 21 times
Next 12 months: up 16 of 21
2008 alone had six such months. A big red month has never been a bottom signal on its own.