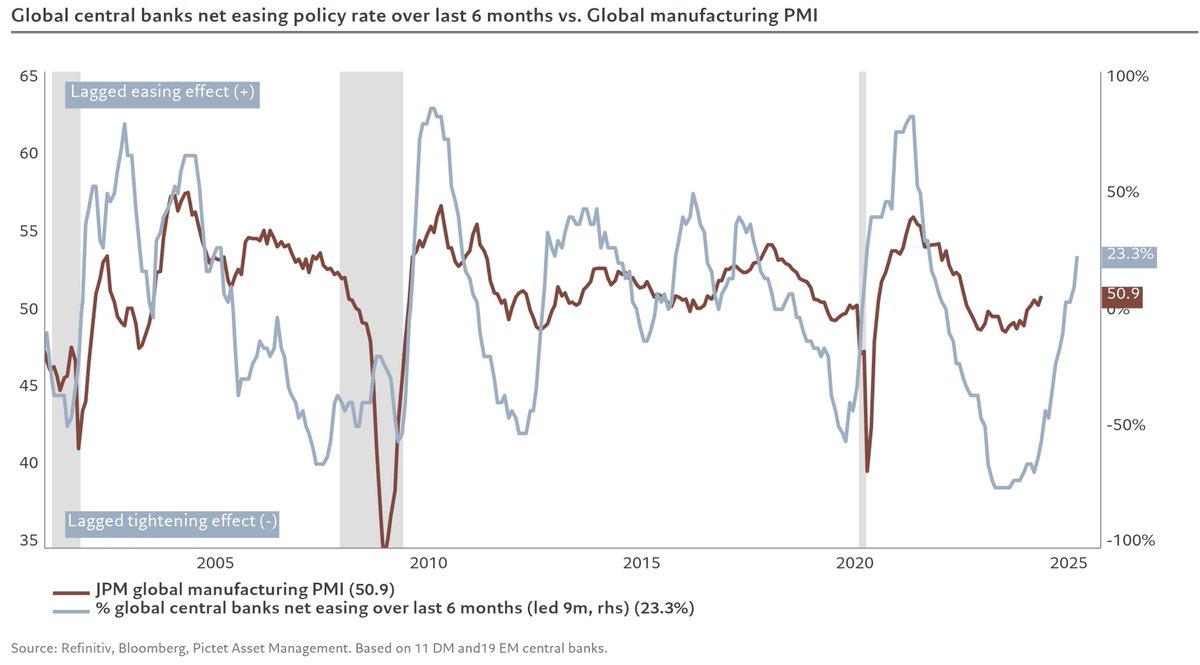
peak bull estimated H2 2025. Two sources not talked about on X.
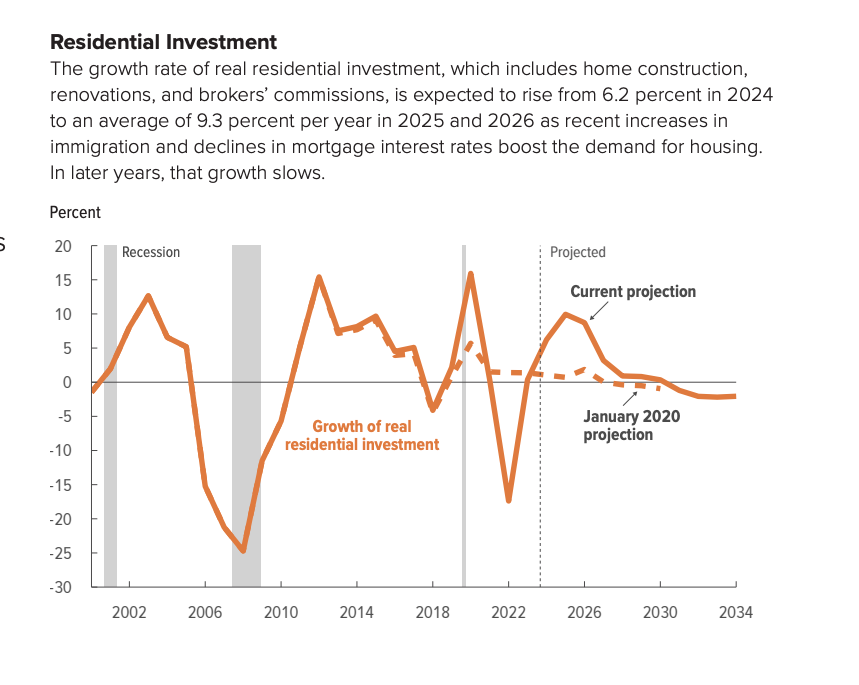
this chart reflects what's in the mind of policy makers and where liquidity is headed. Latest report.
yes I know this is a real estate chart but it's the biggest asset class and money flows like water
source: latest policy report from CBO
https://t.co/DbR90bp3Ua
This chart reflects the rate cutting cycle. I believe with debt projections from policy makers, this is the path that will follow. PMI to peak out H2 2025. We are going into the final part of this bull run.
Have a good weekend. This is not a nuke. It's a pussy ass dip taking out high leverage. #btc#eth
Zoom out. It's up on every time frame except the 5 min chart.
If this was the real nuke, price action will not look like that. 2nd half of year is bullish.
my friends, especially those in alt coins. I know it kinda sucks seeing memes outperform FA based coins.
I assure you, it's not gonna last. It's still PvP. Look at it this way, we've still made money in the worst market condition. Look at eth/btc ratio.
It's all gonna change in the coming months. We moon. Simple. Remember, markets are designed for max pain.
Note: My public portfolio, tho it's up only 300%. It's super frustrating for me. I'm so limited to what I can do. I won't dump on you, I won't buy low mcap, I won't sell those I've talk about until there is deep liquidity, no leverage, no seed, no sponsor blah blah blah... basically zero advantage. Basically designed to be followed easily. That's the best I can do for you guys.