CVDD (Coin Value Days Destroyed) has been tracking the lows for over a decade. It's sitting at $49K currently but might drop lower by the time the bear is done.
Would be wild if this bottom played out exactly like the 2022 bottom. I was against it a first, but seems like things can potentially be lining up nicely.
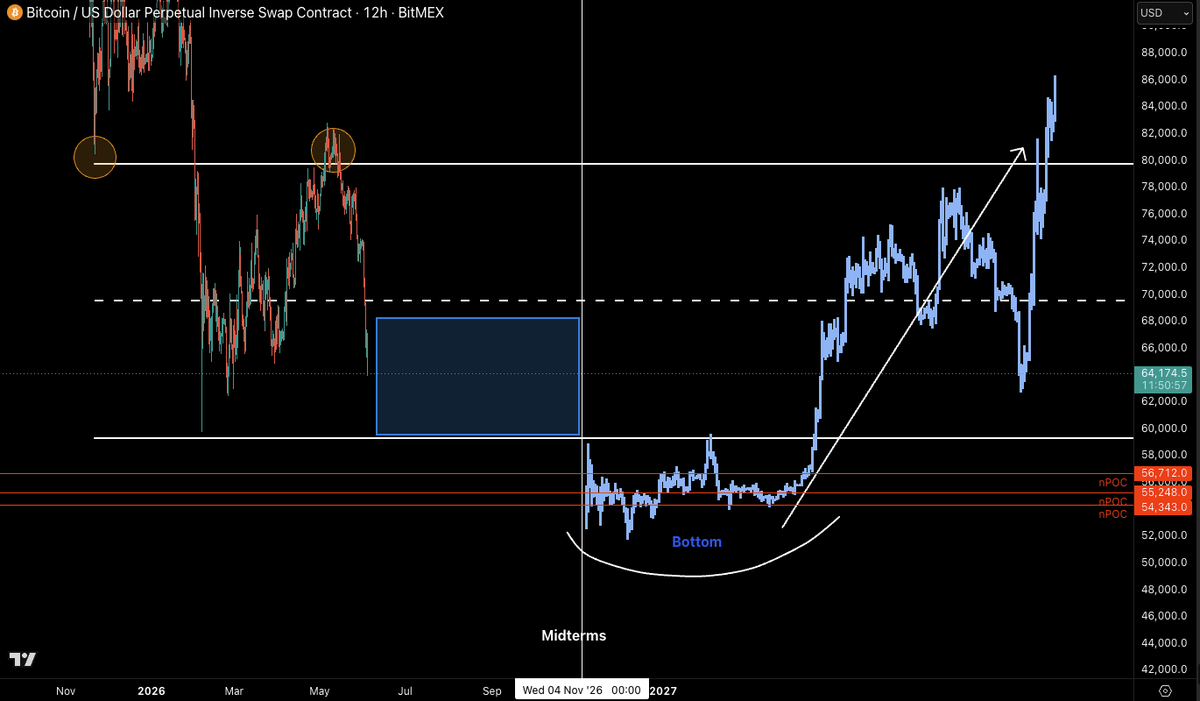
-Chop until Midterms (November 5th)
-Drop down close $56,712 $55,248 and $54,343 nPOC prints
-Bottom and run to ATHs
$BTC
Major update regarding bitcoin:native
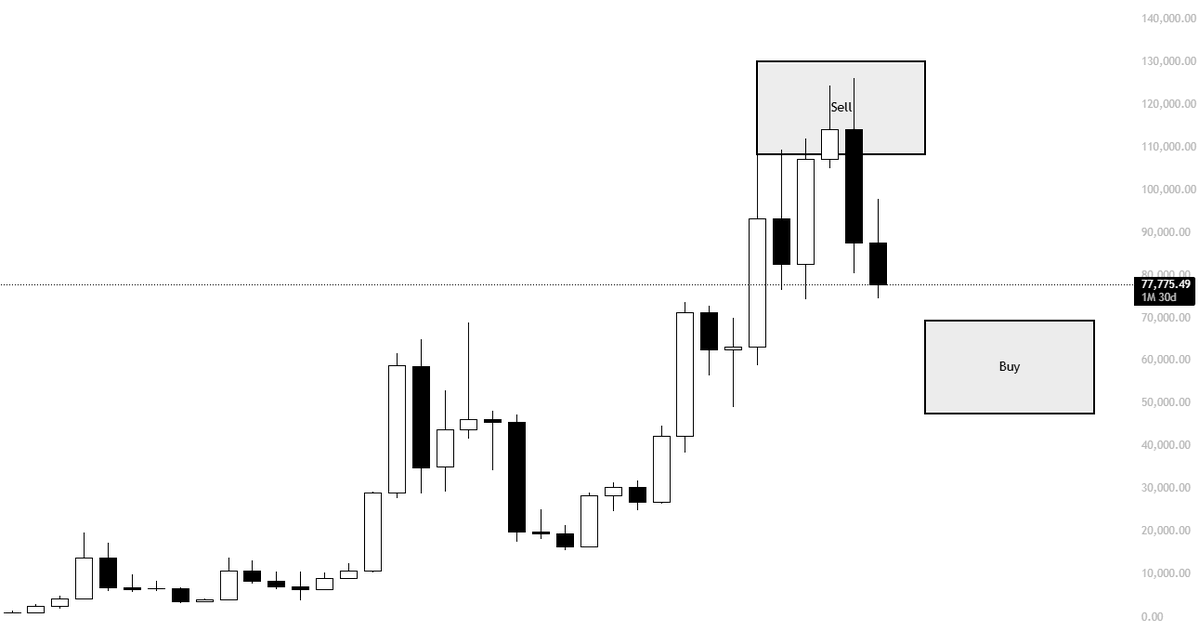
So, you've probably noticed that I've started gradually adding more BTC spot around 74K. Since people on this app often like to twist narratives, take things out of context, and muddle the message, I think it's important to clearly explain my current stance. That's exactly what I'll do in this post.
First and foremost, I have been bearish for 8 months straight. Through my thesis, analysis, and TA, I was able to avoid the price action where most people get rekt, which is bear market price action. In doing so, I avoided a 50% drop whilst capitalizing on my public swing shorts.
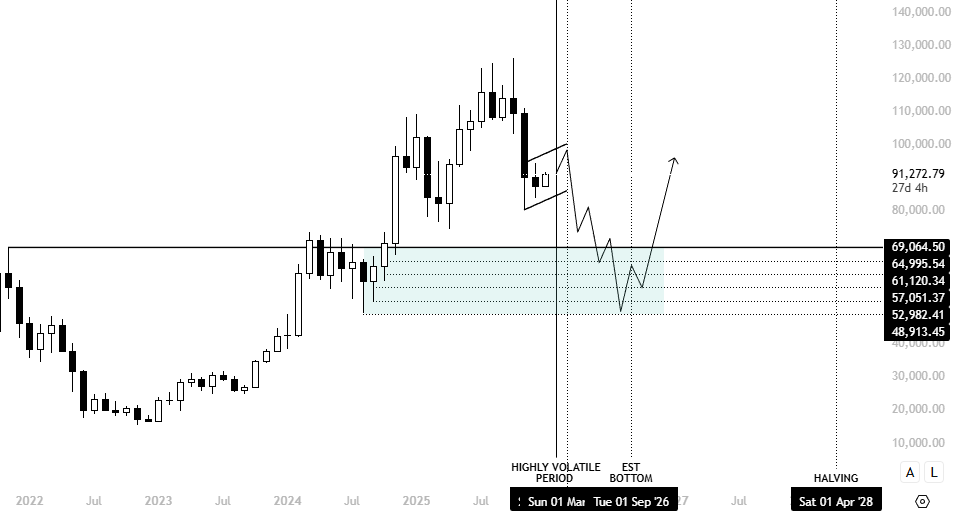
A typical bear market lasts around 300 to 350 days. BTC is currently on day 237. I have stated multiple times that I expect BTC to push lower into the August period. I have also stated that my estimated bottom based on historical cycles sits in the 45K to 55K region.
That means one of my current buys at 74K could potentially be 25% to 30% underwater. A lot of people are asking, "If you're confident in your thesis, why are you buying again at 74K?"
The answer is simple.
Investing and trading are two different things.
BTC is currently down 41% from the highs. At most, I believe we probably see another 25% to 30% decline. That means more than 65% of the bear market retracement has already occurred. Essentially, buying at 74K today, if historical cycles continue to play out, is comparable to buying around 30K during the last cycle, which ultimately worked out very well.
It doesn't matter how good you are as a trader or how much money you have. What matters is recognizing when the risk to reward profile begins shifting in your favor and positioning accordingly.
I think BTC will be sitting somewhere in the 160K to 200K range next cycle. Yes, those are bold targets and bold predictions, but they are not unrealistic. They are rooted in historical returns, diminishing returns, and cycle data.
That means buying around 70K today could potentially generate 100% to 150% returns over the next few years, significantly outperforming legacy markets and gold, even in a diminishing returns environment.
On the other hand, if BTC does reach my 45K to 55K bottom zone, that's another 25% to 30% downside from current levels.
So the question you need to ask yourself is simple:
Would you miss a potential 100% to 150% move higher over the next few years because you were worried about a possible 25% to 30% drawdown?
For me, the answer is no.
Even if that means sitting through temporary drawdowns in the short term.
Now, I am both a swing trader and an investor.
My current swing trade is still a short position, which I have been holding for nearly two months. The objective of that short position is to trade the current market structure, which remains bearish. I am not focused on being bullish until the structure itself turns bullish.
That is not flip flopping.
It is simply two different strategies with two different objectives.
On the higher timeframes, I am an investor and a buyer. On the intermediate timeframes, I am following trend and structure, positioning accordingly until I see evidence that the trend has shifted.
As most of you know, people on X love to take things out of context without understanding objectives or timeframe alignment, which is why I wanted to clarify exactly how I am thinking about the market right now.
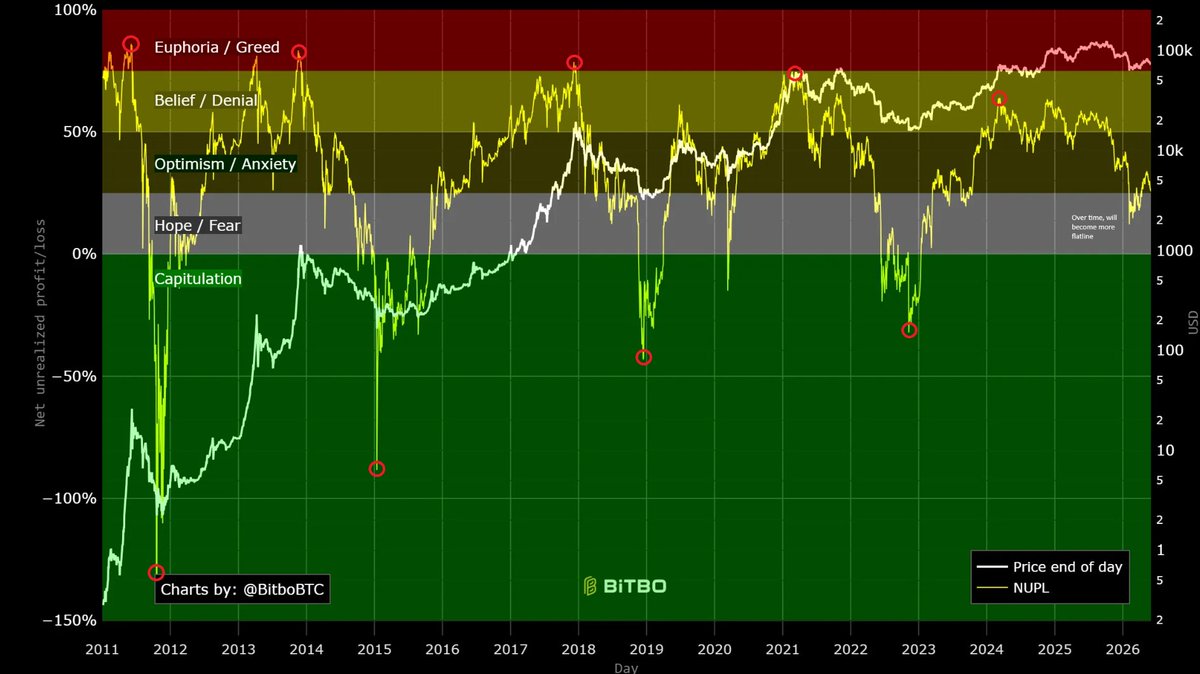
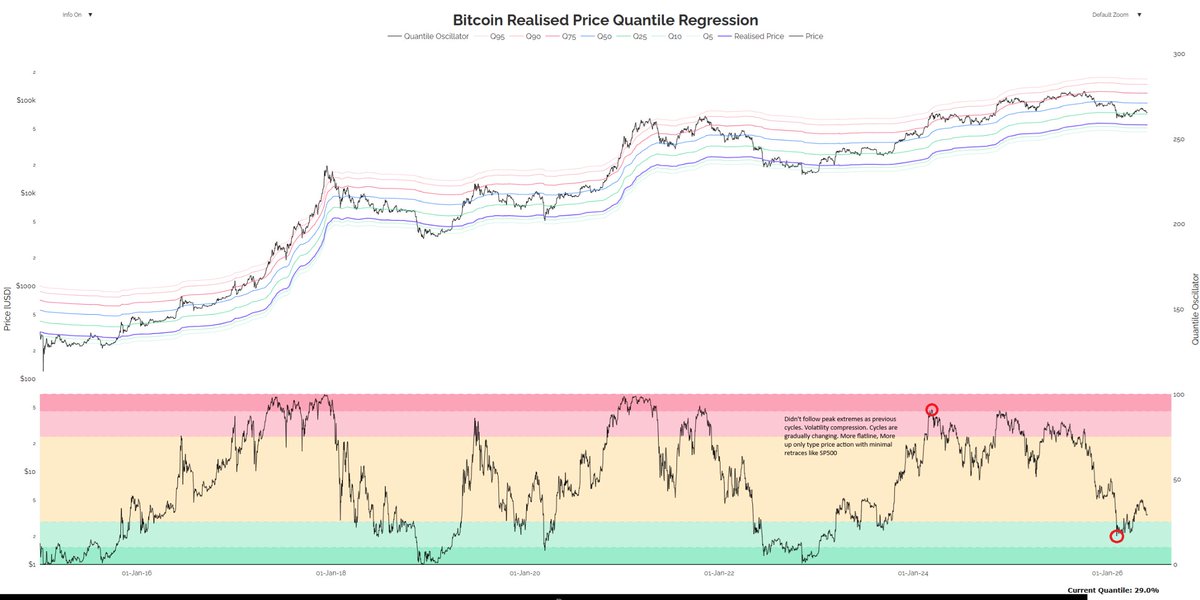
Additionally, many of the higher timeframe cycle indicators are beginning to shift.
When BTC reached 126K, most of the traditional cycle top indicators never reached peak euphoria. In fact, many remained well below previous cycle extremes. These indicators are a major component of my higher timeframe investing framework.
What I am noticing is a divergence.
During the bull market, many metrics failed to reach historical euphoria levels. At the same time, during the bear market, extreme capitulation readings are also becoming less severe and are not reaching the depths seen in previous cycles.
In other words, the cycles themselves appear to be evolving.
Volatility is compressing. Market behavior is changing. That means adaptation is necessary, and it also means we should remain open to the possibility that future cycles may not play out exactly as they have in the past.
Whether that happens this cycle or the next is impossible to know with certainty.
What I do know is that when the math, probabilities, and risk to reward are in my favor, I am simply a buyer.
That's it.
I have attached a few charts outlining the plan I had from 100K+, the areas where I intended to become a buyer, and several metrics showing that extreme capitulation zones continue to become shallower over time.
Volatility compression suggests there is a real possibility that future bear markets become less violent and less dramatic than what we have historically experienced.
Hopefully this post clears up any confusion regarding my current stance.
It took a while to write, but I felt it was necessary.
Let me know if you would like me to do more posts like this in the future.
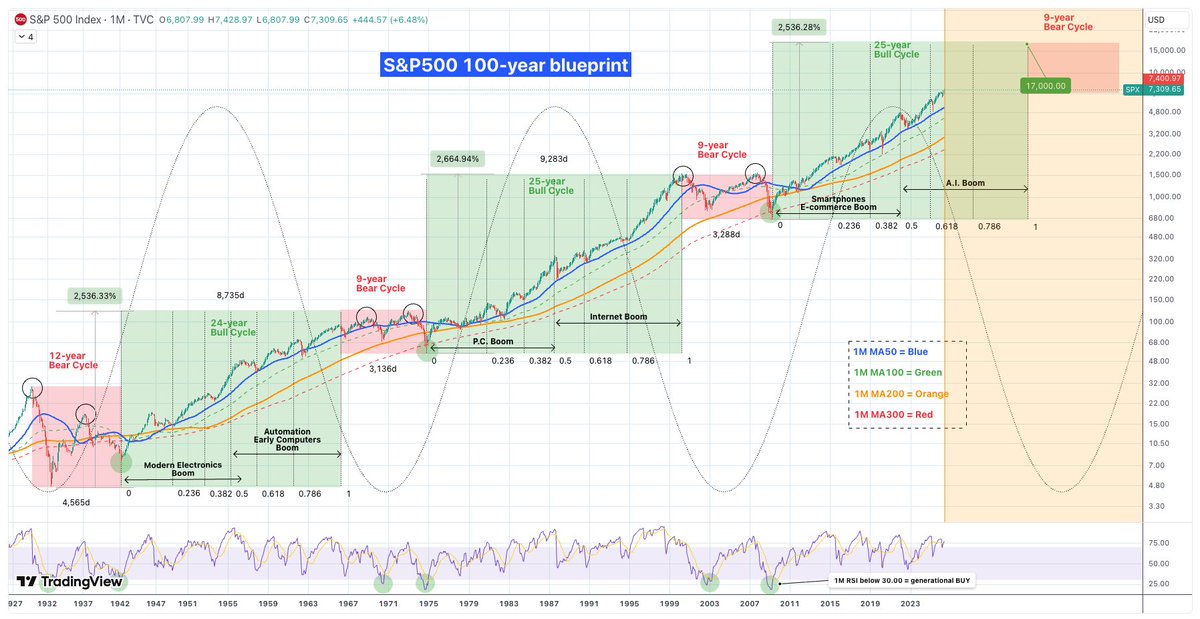
Der 100-Jahre-Plan für den Aktienmarkt
Wenn du dir die letzten 100 Jahre anschaust, siehst du ein klares Muster: Der Markt wiederholt immer wieder die gleichen Zyklen. Seit der Großen Depression 1930 gab es drei große Abwärtsphasen und drei Aufwärtsphasen .
Wir stecken gerade mitten im dritten großen Bullenmarkt.
Die schlechten Zeiten (Bärenmärkte)
Diese Phasen dauerten meistens etwa 9 Jahre (die Weltwirtschaftskrise von 1930 war mit 12 Jahren eine Ausnahme). Ein typisches Zeichen war, dass der Markt zweimal oben und zweimal unten „anklopfte“, bevor es wieder aufwärts ging. Oft krachte der Kurs bis zu einer bestimmten langfristigen Linie (dem 300er-Schnitt im Monatschart) und startete von dort aus neu durch.
Die guten Zeiten (Bullenmärkte)
Die ersten beiden großen Aufwärtsphasen dauerten jeweils 24 und 25 Jahre. Das Spannende: Sobald der Markt einmal Fahrt aufgenommen hatte, fiel er fast nie unter eine bestimmte grüne Linie (den 100er-Schnitt). Die blaue Linie (50er-Schnitt) war dabei immer die beste Chance, um günstig nachzukaufen, wenn es mal zwischendurch ruckelte.
Warum steigt der Markt so extrem?
Hinter jedem Bullenmarkt steckt eine neue Technologie:
Früher waren es industrielle Durchbrüche.
Dann kam der Internet-Boom.
Heute erleben wir den E-Commerce- und Social-Media-Boom.
Klar, irgendwann platzen diese Blasen immer, weil die Leute übertreiben. Aber die Technik bleibt! Das Internet ist nicht verschwunden, nur weil die Kurse im Jahr 2000 abgestürzt sind – es wurde zum Fundament für alles, was wir heute nutzen.
Der KI-Boom
Wir sind jetzt im zweiten Teil des aktuellen Aufschwungs, und der wird von der Künstlichen Intelligenz getrieben. Wahrscheinlich wird diese Blase um das Jahr 2034 platzen. Das wird wehtun, aber danach wird KI das feste Rückgrat unserer gesamten Wirtschaft sein.
Im Grunde sind die letzten 100 Jahre eine Kette von Erfindungen, die die Kurse immer höher treiben. Die Abstürze zwischendurch sind nur dazu da, die heiße Luft rauszulassen und Platz für neues Geld und die nächste Technologie zu machen.
Was bedeutet das für dich heute?
Wenn dieser Zyklus so läuft wie die letzten beiden, könnte der S&P 500 bis auf 17.000 Punkte steigen.
Es wird zwischendurch immer wieder Korrekturen geben. Der Zoll-Crash Anfang 2025 war so ein Moment, hat aber die wichtige blaue Linie nicht ganz berührt.
Schau auf den RSI-Anzeiger. Wenn der unter 30 fällt, ist das eine Chance des Jahrzehnts. Das ist in 100 Jahren erst sechsmal passiert – und jedes Mal war es der perfekte Zeitpunkt zum Kaufen.
Liken, Folgen, Speichern, Kommentieren, Teilen.
Danke für den Support 🫶😊🫶
The S&P 500 is now fully recovered and at ATHs.
Just as the Quartercent Cycles Theory suggested, the next important high is not due until the "19 Year" high in 2028.
Can Bitcoin still continue its bear market in its own cycle while the rest of the market rallies? Sure it can. This also happened in 2014 and 2018.
The S&P 500, Precious Metals, and Crypto, all have their own paths, which sometimes overlap.
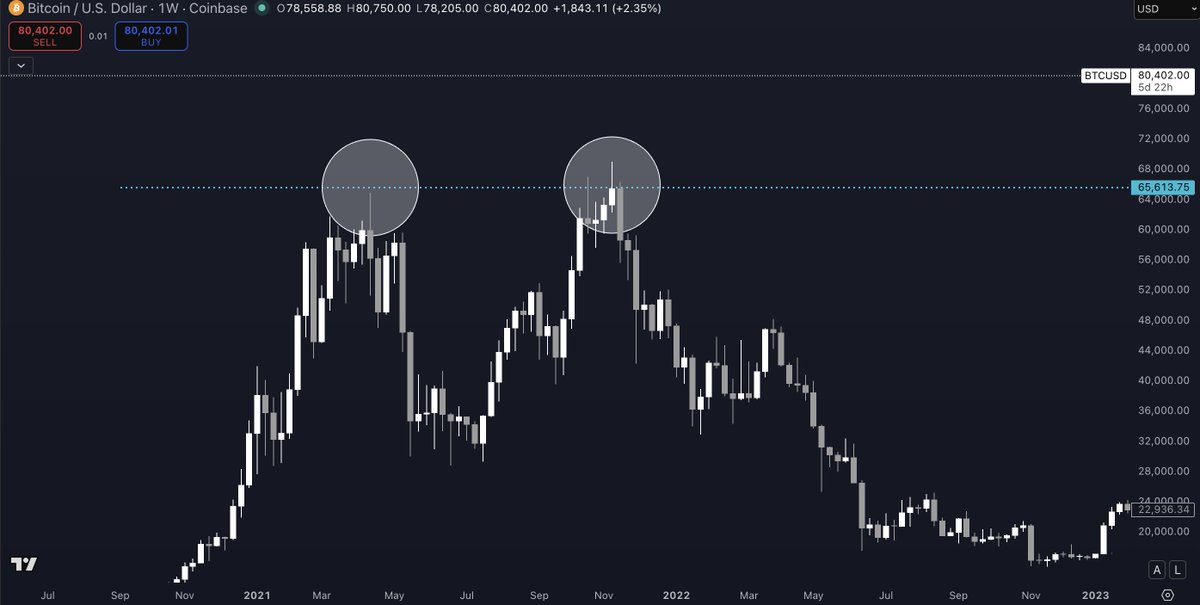
$BTC I have always been a fan of HTF's and historical levels. I've always used these to build out HTF ideas in my charts and execution.
I just want to point out how clean these lows were where each weekly candle closed or opened at the 21 cycles 1W ATH closes and opens perfectly. really look at how the candles opened and closed
Admittedly, I had bought 69k and sold 75-76k and then rebought that + more at 78k. (2-3k higher than where I last sold)
It's been a great year so far.
We traded 85k to 92k end of Q4, 69-75k and the current trade while avoiding drawdown from the last 8 months and are now able to accumulate far more BTC.
As prev said I think the real line in the sand is the mid 80's closes for momentum. But I do think the lows are in. In terms of the end goal. I dont know when, just that the likely path remains higher.
$BTC update:
Another disappointing close
I think even if you're an aggressive bull you'd wanna see a close above at least $71k
Otherwise you're just buying slow bleed
I'm not in a rush so I'm waiting for a deeper discount ($42k) or a market structure shift (above $86k)
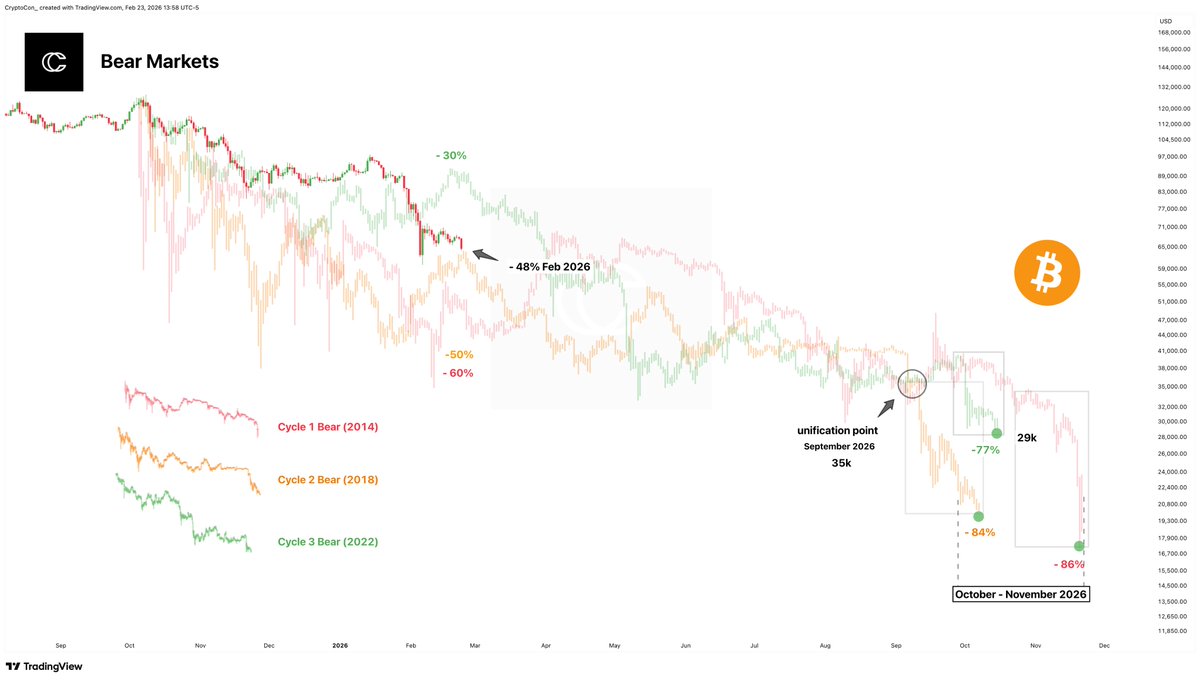
The current bear market is now closer to cycle 2 (2018) than it is to cycle 3 (2022).
Bitcoin is at -48% from the cycle top. 2018 was -50% at the same time, and 2023 was - 30%.
The trick is not to get too ancy to jump in; this is a slow process.
With only 3 examples, we also don't know for sure that drawdowns will diminish every cycle, meaning there is the possibility that this cycle has a harsher decline than other bear markets.
Just waiting
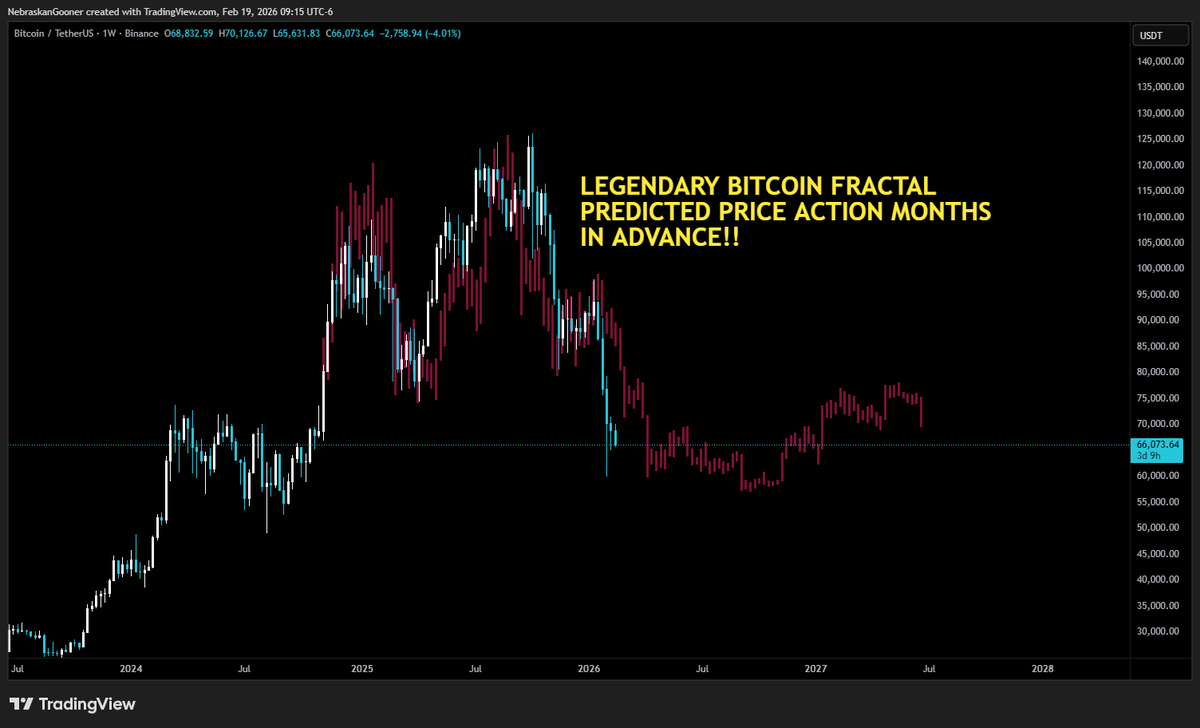
#BITCOIN FRACTAL UPDATE
REJECTED right where the fractal said it would! 🤯
Now it suggests chop between $60,000-$70,000 area for the next couple of months before a drop to mid $50k
Will anybody be left in Crypto if we go sideways that long??
$BTC is still playing out incredibly similarly to the previous bear market.
Obviously does not mean it keeps playing out the same, but something along these lines would not surprise me one bit.
Patience.
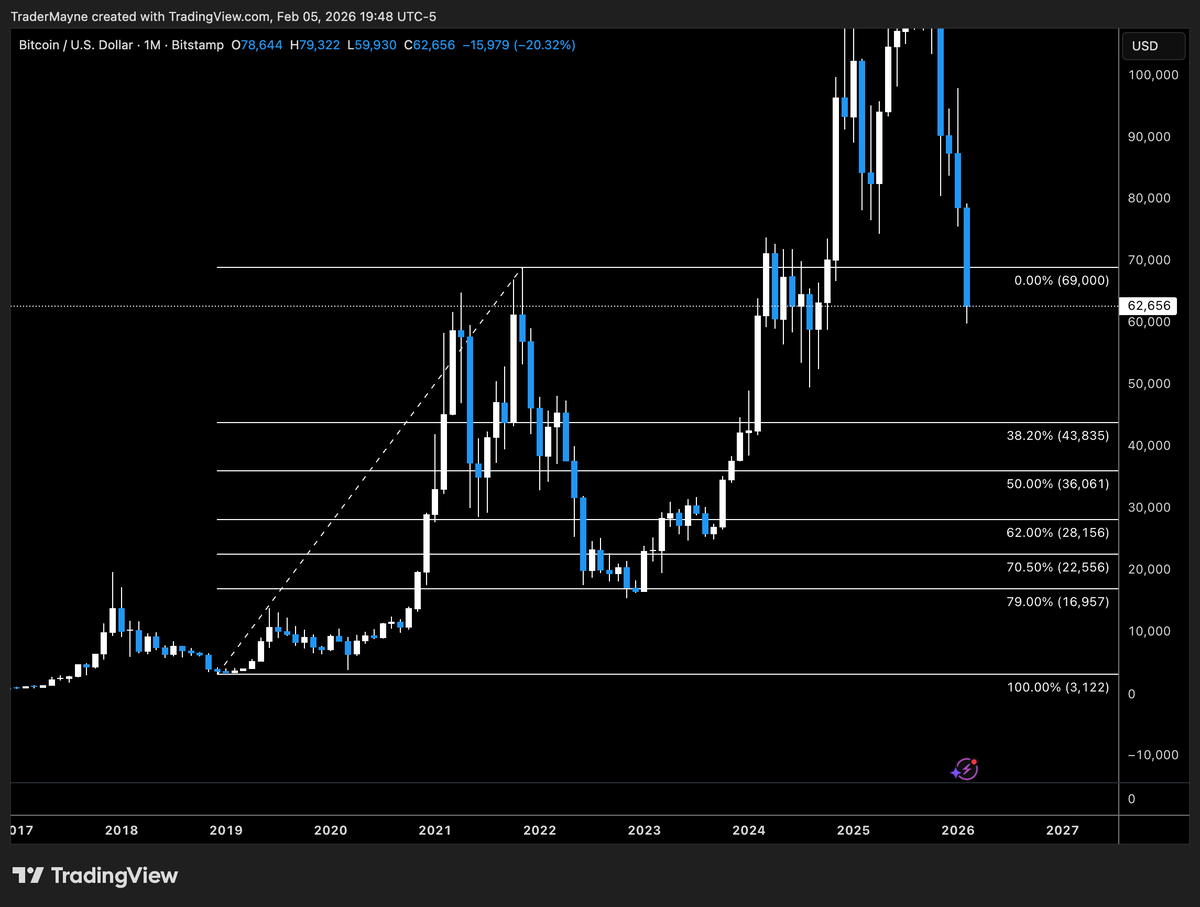
Historically, every major $BTC bear market bottomed below the 0.618 Fib retracement from the prior cycle high.
The first bear went much deeper, 64% below the fib, but every cycle since, bottoms have gotten progressively shallower past 0.618 - to the point that the last bear market low formed just 45% below.
0.618 from the current cycle high sits at $57,000.
If Bitcoin bottoms just 30% below the 0.618 retracement this time around, we're still looking at $42,000.
I get many questions about nPOC levels each day
My guy @Stoiiic has put together a simple yet effective breakdown on exactly what I look for each day
Not much education out there on them but he does a great job making it detailed, simplified and easy to understand! Check it out
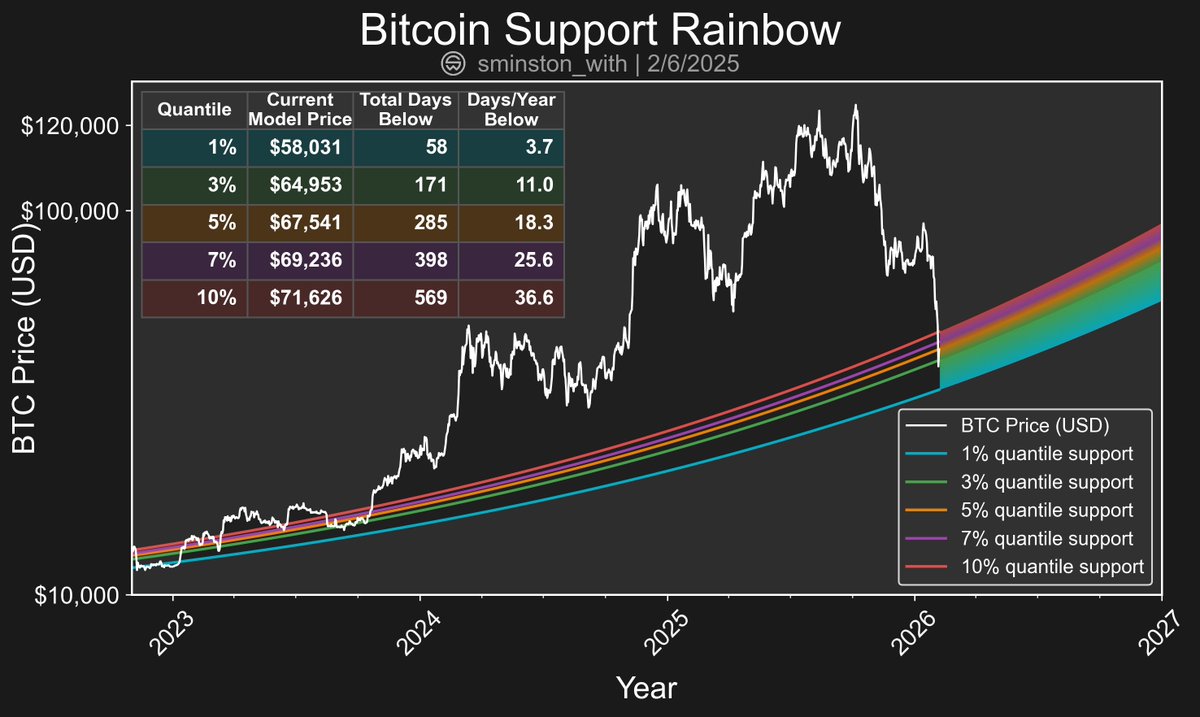
Here's the BTC support stats 📊
The drop yesterday swiftly took us below the 3rd %ile, just scraping ~$60k, before having a healthy bounce back up to what is now $67.4k, almost exactly the 5th %ile.
We should keep experiencing greater "strength" of support, the lower we go.
- - -
For example, we did actually briefly drop below the 1st %ile at the bottom in 2022 - but the average time spent below that level is only 3.7 days out of the year.
We've officially punched into the support rainbow - now you can NOT tell me we aren't right near the bottom, if we aren't already there.
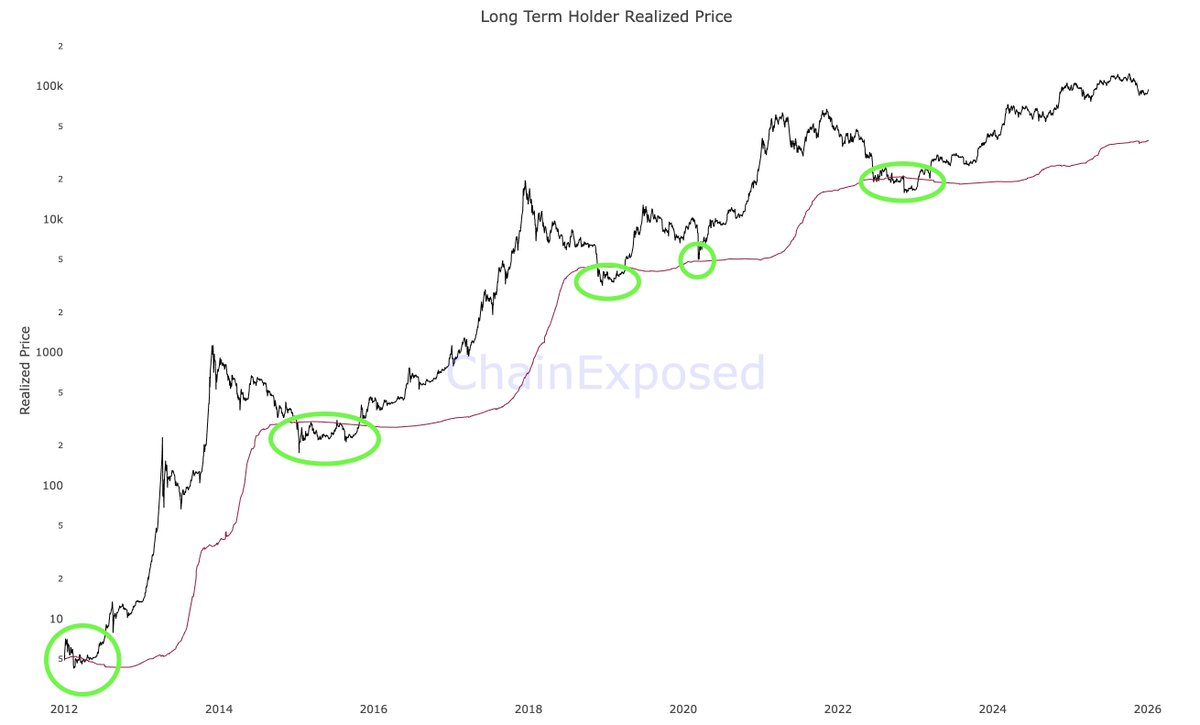
This is Bitcoin's long-term holder realized price.
It measures the cost basis of all Bitcoin that were transacted at least 155 days ago (and therefore older).
In bear markets, we go down to that level.
It's literally a magnet for price.
LTHRP is currently $39.3k.
So this time wasn't different, the 4 year cycle remains king and $BTC topped in Q4, 4 years after the prior top.
I can only assume then that this bear market will play out similar to the prior ones and BTC will eventually make it's way towards the 79% fib.
Last cycle I thought $30k and below was good value.
Cycle before that I thought $6k and below was good value.
At the rate we are selling off, I think we are approaching those good value levels pretty quickly.