@DJ_Tao@investingwithac This ETF replicates an equal weighted index which includes most insurance names, so $OSCR being the top one means it was the best performer since the last rebalancing. The only info we can gather from this is that they will likely sell share in the next rebalancing
Welcome back, prodigal son! 📈
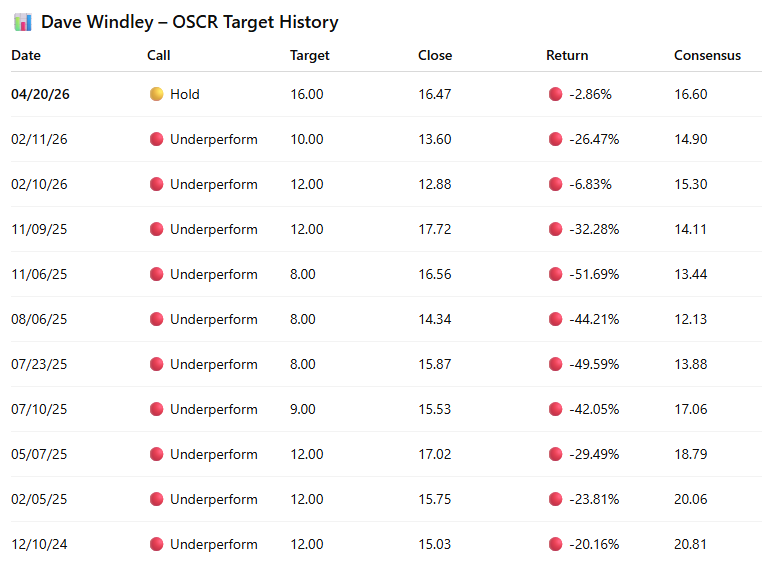
Good news for $OSCR: Jefferies today upgraded Oscar Health from Underperform to Hold, raising the price target to $16 (from $10) on stronger pricing outlook.
https://t.co/kbM8usuKNA
I’ve followed D. Windley at Jefferies since he started covering $OSCR.
Always the most bearish, lowest target on the Street. Last year he warned of ACA subsidy expiration Armageddon... and he was somewhat right. Stock hit $10.69 just a few weeks ago (but it was more a macro-driven dip, to be honest).
Yet he was bullish on other health insurers at the same time... never quite made sense to me.
But after $OSCR strong guidance + reaffirmation, Windley finally flipped... and here we are with a record target price, now at $16 Hold, during the first quarter without ACA enhanced subsidies!!!🤣
"""
The firm said its analysis of the company’s 2026 bids indicates Oscar Health likely priced sufficiently to reach its 2026 guided margin. Data and industry conversations point to market enrollment trending favorably versus expectations, which is a directional positive for market morbidity, Jefferies said.
Oscar Health is likely increasing its share of "good risk" even net of risk adjustment, the firm said. Jefferies said if the 2026 medical loss ratio meets or beats management’s guidance as it now expects, an Underperform rating is not defensible.
"""
"An Underperform rating is not defensible"?!
Here's a U-turn before it’s too late.
I’m usually very skeptical of sell-side analysts, but this is too hard to ignore.
Nice analysis on $OSCR, thank you.
Risk Adjustment will be the real elephant in the room.
The hope is that, after a very bad 2025 from a MLR standpoint, every player in the industry has made conservative pricing which will revert margins to the mean.
Oscar market share is now around 30%, representing a wider portion of the overall risk pool: because of this, RA could be less volatile than in the past.
@halfdome Good point on $OSCR.
Matching more closely the National market + increasing a lot their market share (30%) --> risk adjustment potentially much more predictable than in the past.
Guys,
there’s a debt turnaround story quietly unfolding in the market, on a relatively underfollowed stock operating in a highly defensive sector, with potentially very attractive valuations.
This stock is Clariane SE $CLARI.
Clariane SE is a European leader in providing care and support services for seniors. The company operates a network of nursing homes and clinics, offering long-term care, rehabilitation, and mental health services.
The company faced increased financial risk due to its high leverage and the need to manage its debt amid rising interest rates. The stock suffered... a lot, and is today down ~91.43% from its 2020 peak.
Debt killed stock performance, and at times, rightfully so.
But today we are going to ask ourselves:
How is the debt doing?
and, most importantly,
How is the real operating business performing?
Let's focus on cash flow & debt dynamics — the first image shows a breakdown of improving FCF 🟩 across CFO, CFI and CFF:
Operating CF 🟦 has been resilient, even in 2022, confirming the defensive nature of the business and solid unit economics.
Financing CF 🟧: a significant amount of debt was issued in 2020 to fund capex and acquisitions. Higher leverage backfired in 2022 as rates increased.
Investing CF (purple) : the expansion phase seems over, with flows turning positive from 2024.
The need to issue debt in 2020 to fund future capex came at an unfortunate time, just before rates surged.
Looking at the interest coverage ratio (EBIT / Interest Expense, second image), EBIT has been almost entirely absorbed by interest in recent years. However, since H2 2025, we’re already seeing a clear improvement, driven by lower debt and lower rates.
Looking at debt evolution, since 2022, repayments have exceeded new issuance, and D/E has declined from 2.5x (2019) to ~2.0x today (third image).
So, how is the debt doing?
The interest rate storm has passed, and the deleveraging trend is promising.
And how is the real operating business performing?
Relatively well — there was never an operating issue from an EBIT and Operating CF standpoint (fourth image).
Moreover, in the latest quarterly call, management made the following comments:
- Financial position strengthening plan successfully unfolding.
- Liquidity restored to €1.2bn
- Net financial debt down €390m YoY to €3.1bn
- Already ahead of schedule, close to <5x Net Financial Debt / EBITDA (currently at 5.1x vs 5.8x in 2024)
- Target ~4.5x leverage by 2028
- Debt reduction increasingly driven by cash generation
The market has partly priced these positive situation in (Forward P/E ~15.3x, near sector average)
But if margins revert to historical levels, there’s still meaningful upside.
Consensus sees ~2.3% profit margin by 2027 → €134m earnings → ~9.9x P/E
Yes, volatility in results remains high due to leverage, and outcomes can swing both ways.
But look at the last image and compare the stock price pattern to fundamentals and margins: this looks more like a broken stock than a broken company.
And net profit margin has just turned positive again.
Ah, and here are some interesting multiples Clariane is trading at:
- P/B = 0.37
- P/FCF = 1.64
- P/CFO = 1.25
It’s not every day you see multiples like these.
…and if this debt turnaround materializes, the re-rating potential is hard to ignore.
Not an open market buy.
Bertolini didn’t hit the order book, the 1M $OSCR shares were purchased directly from the company in a private placement (see footnote 5).
Knowing how a limit order book works, would be quite unlikely to purchase 1M shares exactly at the close price.
However, at $11.92, that’s $11.9M of real cash invested.
Combined with the 5.7M PSU vesting (and ~1M shares withheld for taxes), he effectively keeps his exposure intact.
... and the signal is clear: confidence.
I don’t want to have my position reduced, even to pay taxes!!
RA is very hard to predict. $OSCR is basically exposed to other insurers' underwriting skills.
But, adding to your points, we should not forget that now $OSCR could be representing 30% of the market. Hence their risk pool influences more the overall risk pool, leading to potentially less variability in RA compared to the past, when they were a tiny insurer.
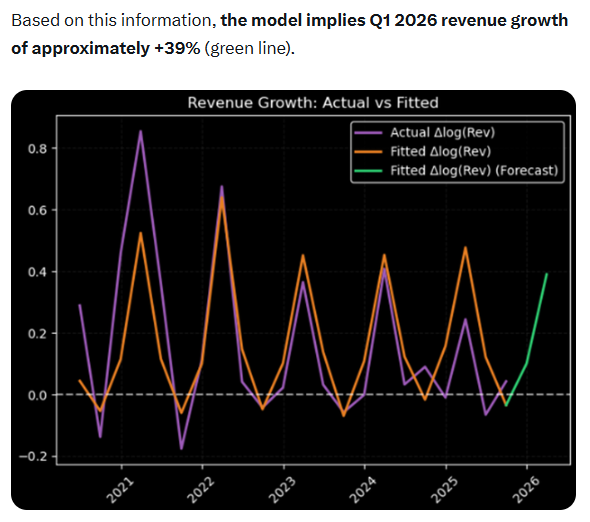
The model forecasted +39% growth in $OSCR revenues (screen below), while guidance now points to an impressive +62%.
What was missing? The 2026 price increase, announced today at +28%, much higher than in the past. Factoring it in brings the forecasted growth much closer to the guidance.
The revenue guidance is real.
If the MLR returns to its historical average, things will get very interesting.
Interesting, and thank you for the suggestion. Can you explain me the economic rationale behind? Revenue and sg&a shouldn't be related to MLR, which is a somewhat exogenous variable depending on the risk pool, right?
Or maybe I am missing something.
Maybe we could estimate the MLR looking at historical trend in health insurance. There is a sort of cyclicality in the insurance industry named soft Vs hard market, and looking at historical trends we could sort of infer what usually happens after insurance companies take a punch in the face like in 2025.
The model forecasted +39% growth in $OSCR revenues (screen below), while guidance now points to an impressive +62%.
What was missing? The 2026 price increase, announced today at +28%, much higher than in the past. Factoring it in brings the forecasted growth much closer to the guidance.
The revenue guidance is real.
If the MLR returns to its historical average, things will get very interesting.
@snack8812 Technically, the regression considers the repricing component occurred in the sample in drawing the relationship, and the forecast is fine as long as the future repricing is close to the historical average. That was not the case for 2026 pricing.
@ondrejslunecko Awful 95% medical loss ratio in Q4 for $OSCR, but this is more an industry issue, hopefully limited to 2025. 2026 could be a reset year with insurers factoring higher expenses into their premium models.
For reference, Q4 MLR was 94% for $CNC, 95% for $MOH and $CVS.