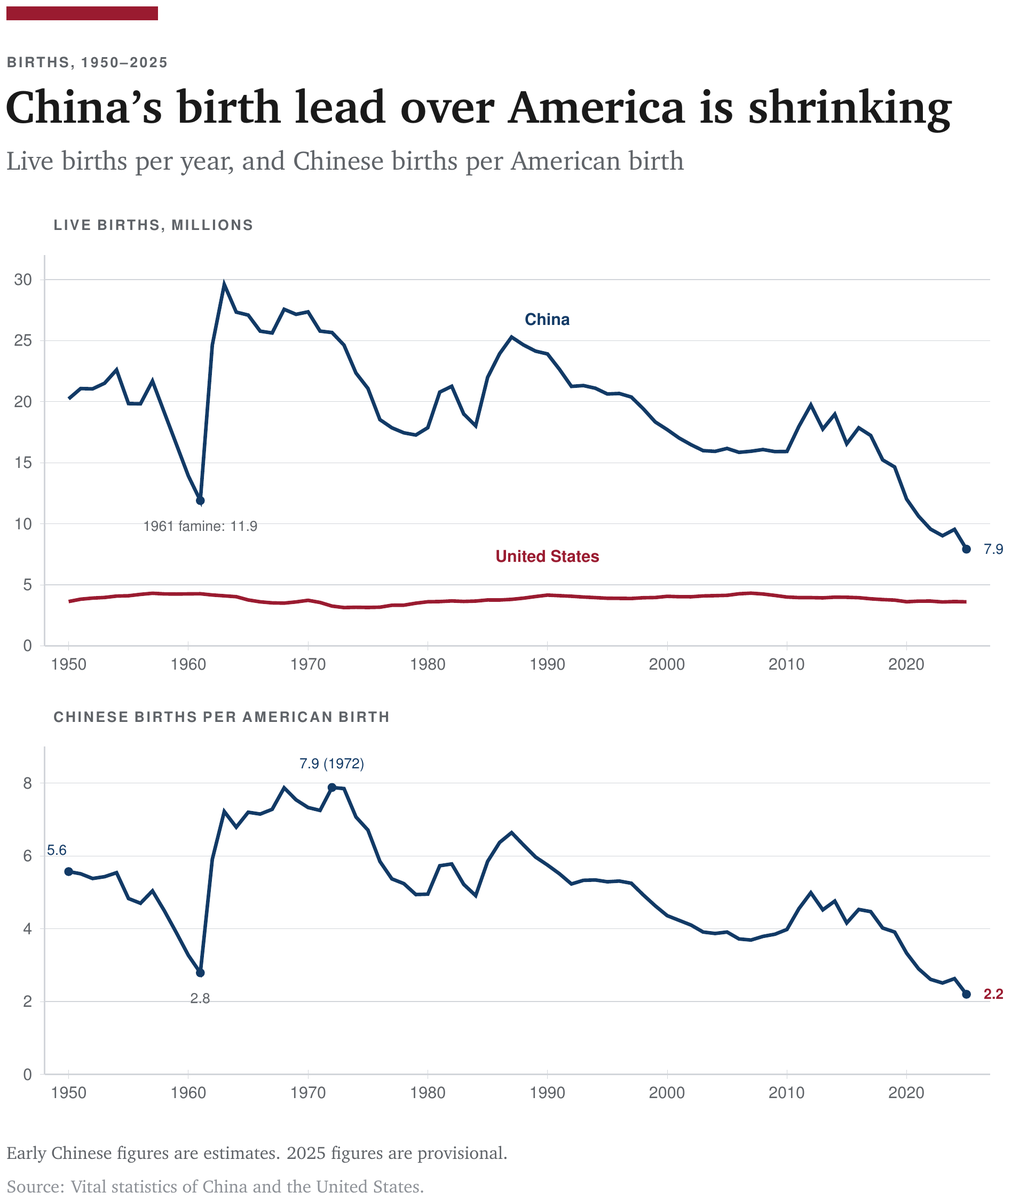
In 1972, nearly 8 times as many children were born in China as in the U.S. In 2025, only 2.2 times as many. Consider also that China’s total fertility rate in 2025 was 0.93, while the U.S. rate was 1.58.
If fertility rates remain at those levels, the U.S. will overtake China in births at some point in the 2060s (depending on immigration flows to the U.S.) and in total population by around 2100. A world where the U.S. has a larger population than China is very different from the world today.
Of course, this is a big “if,” but it is a nice thought experiment to illustrate the importance of demographics in shaping Great Power competition. Among the great powers, the U.S. is the least demographically exposed.
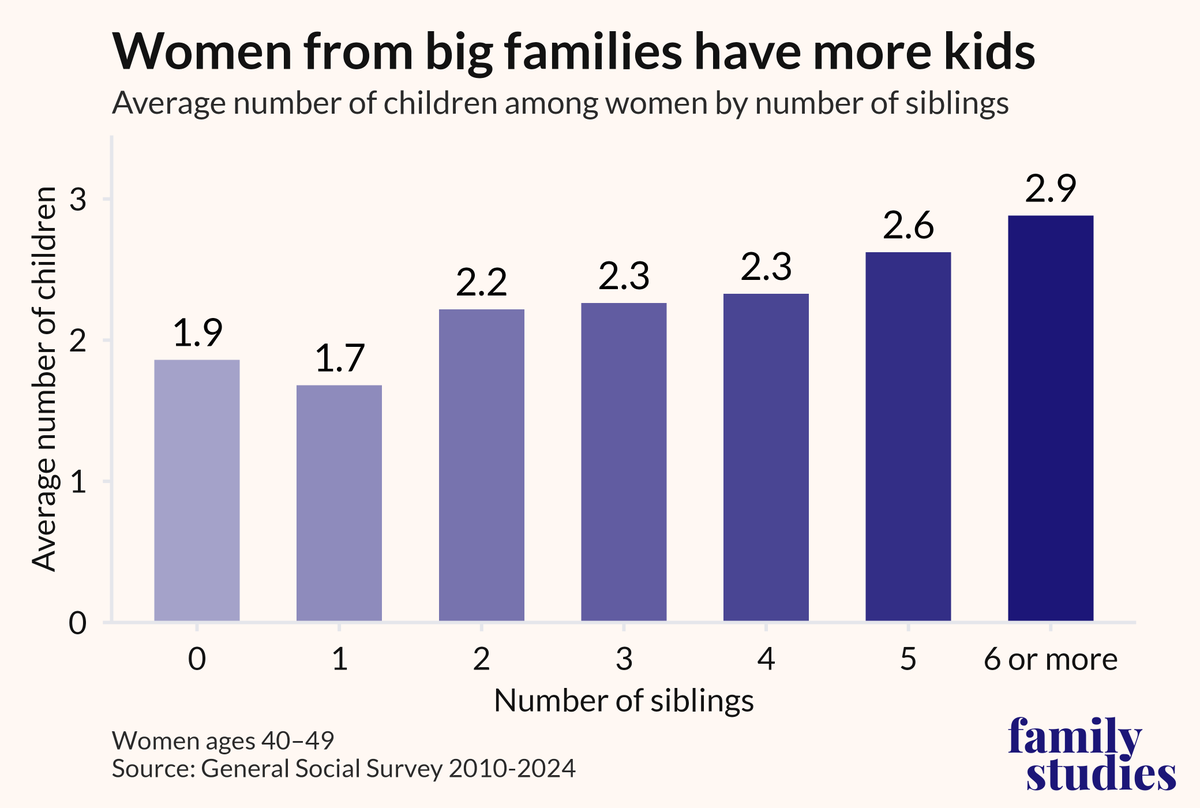
Women who grew up in big families tend to have more kids of their own. On average, each additional sibling is associated with having 0.2 more children.
As it turns out, asking your daughter to babysit probably won’t put her off motherhood.
We’re sharing a solution to the Navier-Stokes Millennium Prize Problem, one of the deepest problems at the frontier of mathematics.
The proof was produced by a group of agents, using an OpenAI next-generation model significantly more capable than GPT-6 Astra.
The problem concerns whether the description of smooth three-dimensional fluid motion modeled by the Navier-Stokes equations can break down. It has remained unresolved for roughly 90 years.
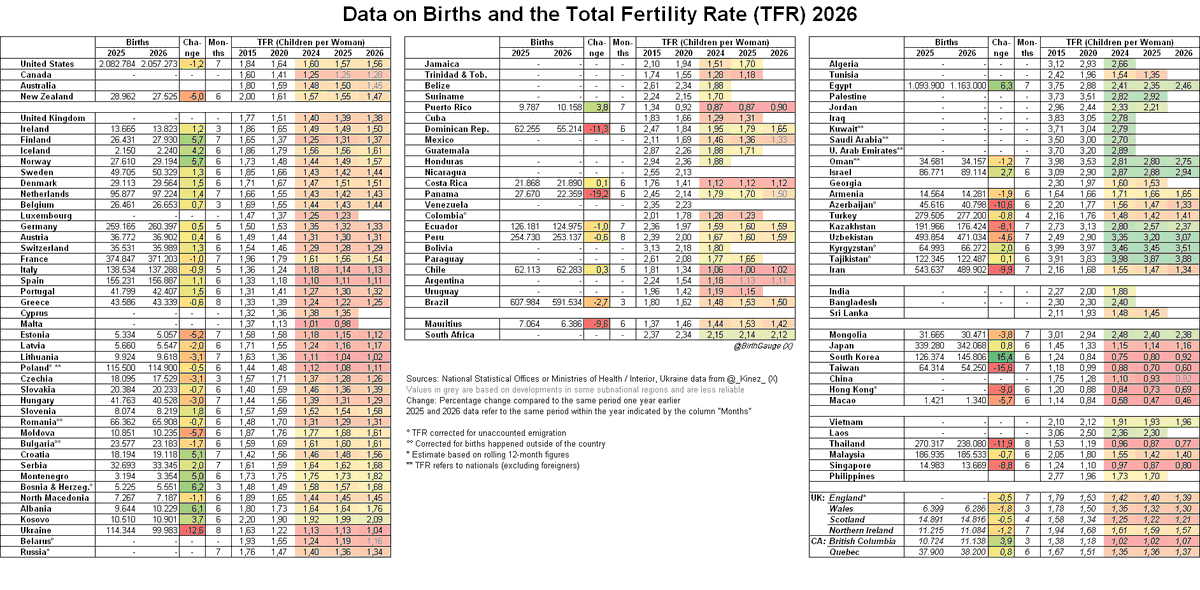
An update to my list of the TFRs decomposed into the Total Maternal Rate and the number of Children per Mother (Family size). Some countries have similar TFRs, but they differ a lot in how they attain them (Do they have low childlessness and small families or the other way round?).
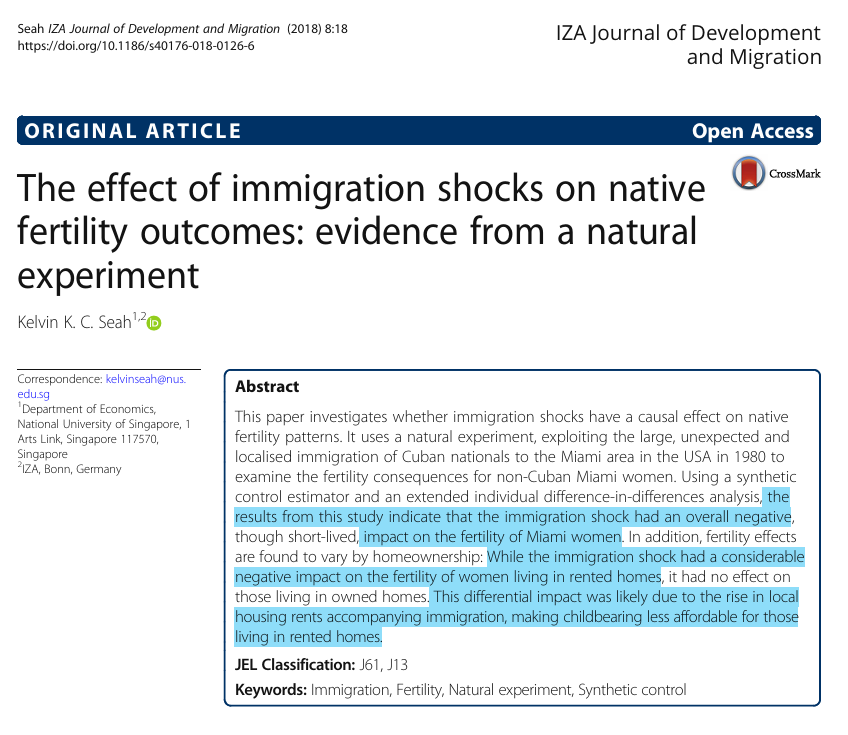
What is the effect of high immigration on native fertility?
A study used the natural experiment of the large and unexpected immigration surge to Miami in 1980.
Native fertility fell in Miami compared to controls as housing costs soared while wages fell. 🧵
Forthcoming in the AER: "Corporate Tax Cuts, Firm Growth, and Workers’ Earnings" by Patrick J. Kennedy, Christine L. Dobridge, Paul Landefeld, and Jacob Mortenson. https://t.co/IQPO8zgNp7
Today, we share a breakthrough on the planar unit distance problem, a famous open question first posed by Paul Erdős in 1946.
For nearly 80 years, mathematicians believed the best possible solutions looked roughly like square grids.
An OpenAI model has now disproved that belief, discovering an entirely new family of constructions that performs better.
This marks the first time AI has autonomously solved a prominent open problem central to a field of mathematics.
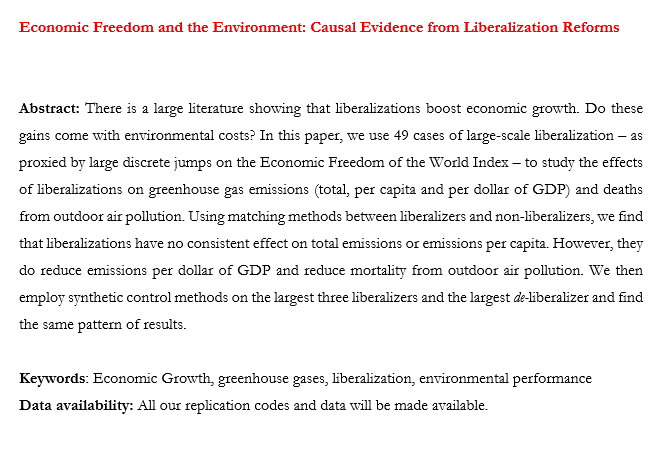
Now forthcoming at Structural Change and Economic Dynamics: Big liberalizations boost GDP per capita by 16% over ten years but have no effect on GHG emissions in total, or per capita. In other words, you can get more growth without hurting nature. We also find clear signs that those same liberalizations reduce mortality from air pollution.
The work is coauthored with Justin Callais and Alicia Plemmons. More on this soon.
Adverse local labor market shocks that reduce employment hasten cognitive decline, from Noah Arman Kouchekinia, @NeumarkEcon, and Tim A. Bruckner https://t.co/Bowqu8VVaT
Among the 36 countries surveyed, the level of support for ‘capitalism’ in Ukraine is only exceeded by Poland, while it is similarly high in the United States. In 33 countries, however, overall perceptions of capitalism are more negative than in Ukraine. In contrast, general opinions of capitalism were more negative in only two of the 36 countries than in Russia.
Konwergujemy - tak zatytułowali swój Dziennik Ekonomiczny ekonomiści @PKO_Research. Chodzi o dane @EU_Eurostat o PKB per capita w krajach UE, a dokładniej miejsce 🇵🇱w tym zestawieniu. A poniżej jak się to miejsce zmieniało, punkt(y) odniesienia to duże gospodarki 🇪🇺 i region.
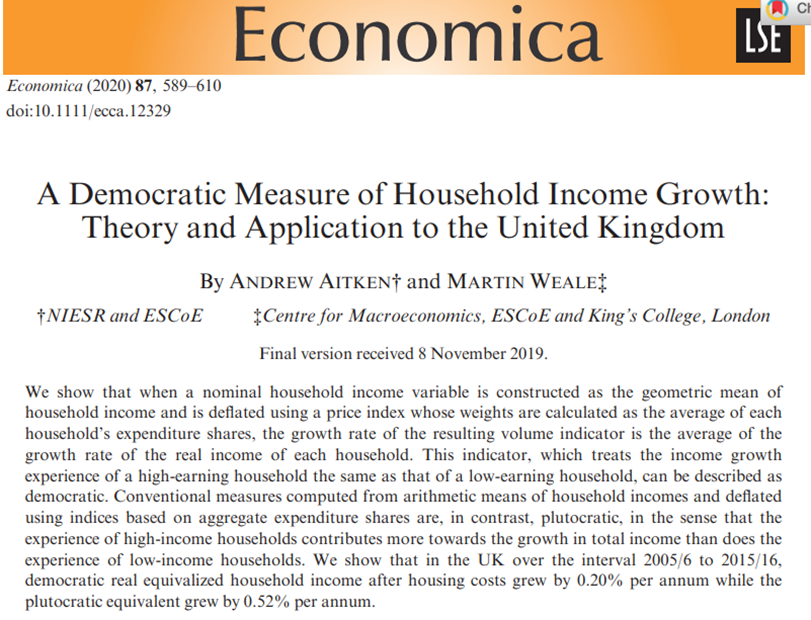
Measurement matters: Britain's stagnation of living standards is worse than you think
Standard income growth measures uses averages that overweight the rich. If high earners do well, the "average" looks healthy -- even if most households see little progress. A better approach asks: how fast did each household’s real income grow, on average?
To do that, you need two fixes. Which is what this 2020 paper in Economica does.
First, use the geometric mean of income. This treats percentage gains equally -- a 10% increase for a low-income household counts the same as for a high-income one. Second, use a democratic price index, which reflects the average household’s inflation experience, not the spending patterns of big spenders. The democratic price index corrects for the fact that the commonly used CPI tends to represent people that are definitely in the top 30% of the income distribution. It corrects by weighing according to number of households, not according to expenditures.
Put together, this gives a more accurate measure of average of real income growth across households. Applied to the UK, the result is stark: real income growth is much weaker than standard measures suggest.
The "usual" measure shows 0.52% per annum growth in real income. Not bad, not great. However, once corrected for the democratic price index and the geometric mean of income, its 0.2% per annum - close to stagnation pretty much.
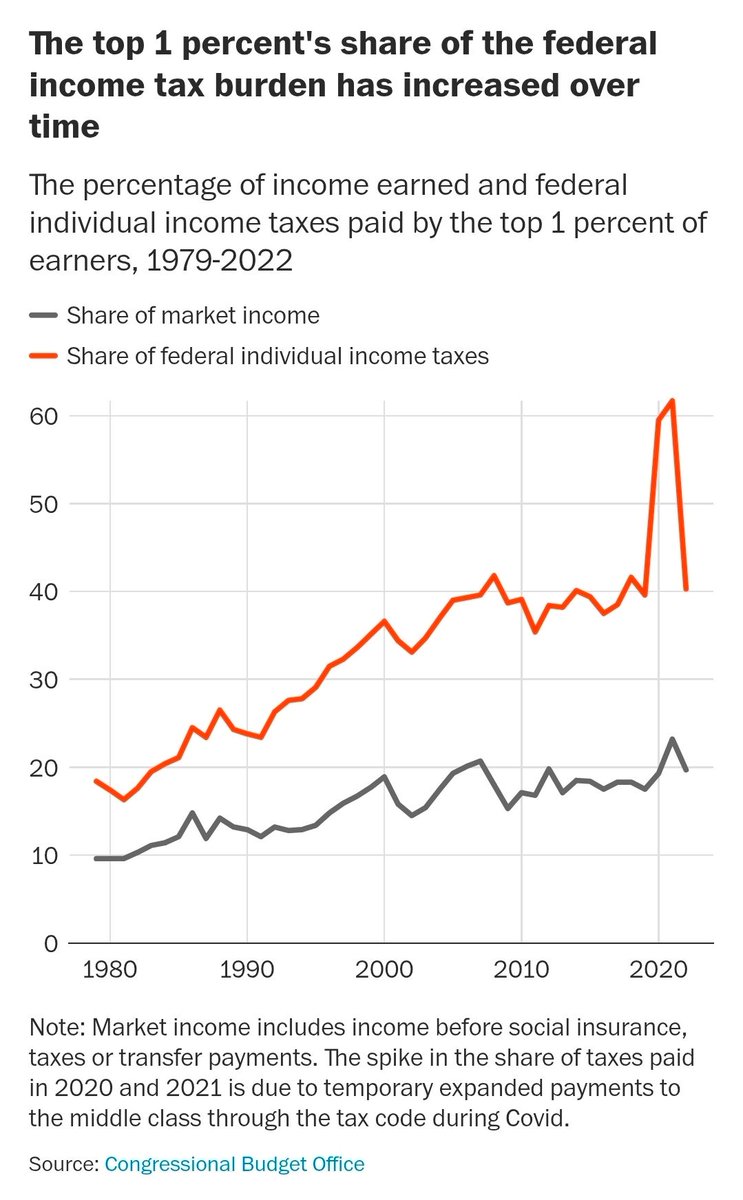
New research shows that raising taxes on the rich wouldn't raise revenue but would harm growth. Good writeup/charts from the WaPo team: https://t.co/DG0AKqxB1L