🚨 MARKET STRENGTH RADAR | NOVEMBER 6, 2026 CLOSE
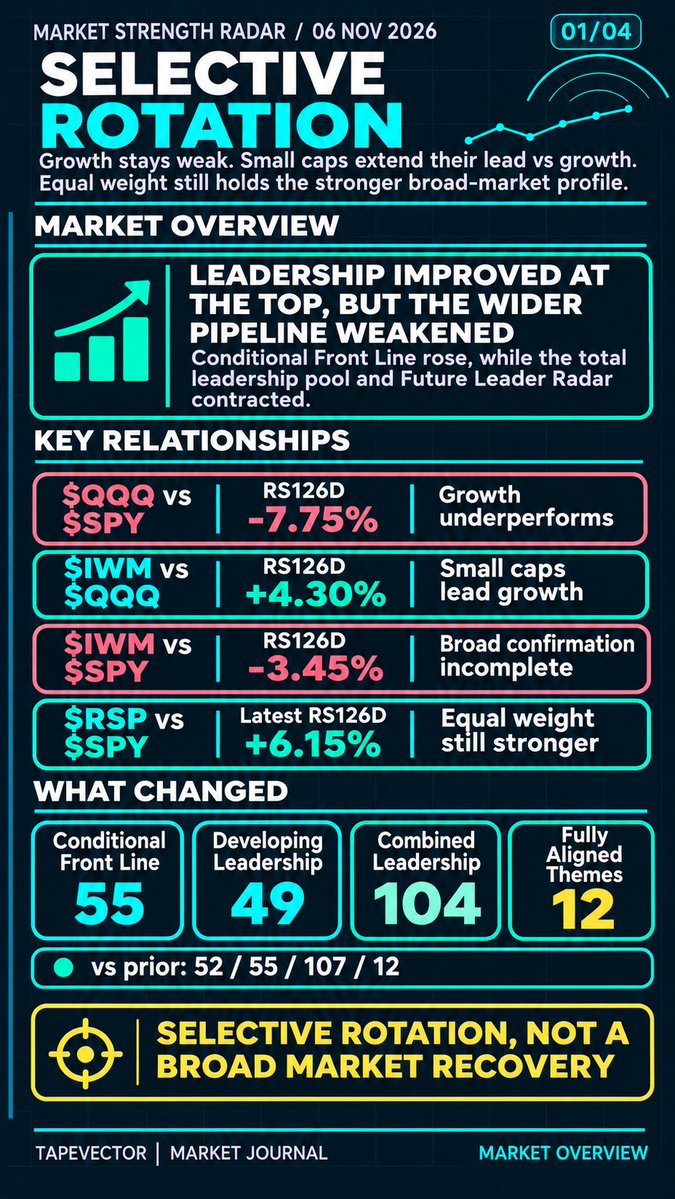
📉 GROWTH REMAINS STRUCTURALLY WEAK. SMALL CAPS ARE EXTENDING THEIR LEAD AGAINST GROWTH. EQUAL WEIGHT STILL HAS THE STRONGER BROAD MARKET PROFILE, BUT LEADERSHIP IS NOT BROADENING.
The latest completed Market Strength Radar shows a market where the relative rotation continues, but the stock screening system is producing mixed signals.
The stronger Conditional Front Line pool improved. The total leadership pool contracted slightly. More importantly, the Future Leader Radar lost 58 candidates while the Not Yet Confirmed category expanded by 55.
That is not a clean broadening signal.
📊 WHAT CHANGED SINCE NOVEMBER 5?
🟢 Conditional Front Line: 52 → 55
🔴 Developing Leadership: 55 → 49
🟡 Combined Leadership: 107 → 104
🔴 Future Leader Radar: 249 → 191
🔴 Not Yet Confirmed: 485 → 540
🟡 Fully Aligned Themes: 12 → 12
The highest conditional screening category gained three names, but the wider opportunity pipeline weakened.
There is another important change.
Semiconductors lost all 11 Developing Leadership candidates from the previous snapshot.
Financials now contribute eight Developing candidates.
Some relative strength is rotating away from semiconductors toward financials, but that is a screening shift, not proof that eight financial stocks have clean trade entries.
📉 THE MACRO PICTURE
🔴 $QQQ vs $SPY:
RS21D: -7.93%
RS126D: -7.75%
Growth remains behind the broad market across every measured window.
🟢 $IWM vs QQQ:
RS21D: +11.64%
RS126D: +4.30%
Small caps continue outperforming growth, and the six month advantage increased from +3.06%.
🟡 IWM vs SPY:
RS126D: -3.45%
Small caps are recovering against the broad market, but six month confirmation is still negative.
🟢 $RSP vs SPY:
Last available RS126D: +6.15%
Equal weight retains a positive structural advantage, although this particular benchmark observation is dated November 5, not November 6.
The rotation away from concentrated growth remains visible. Broad market confirmation is still incomplete.
🛡️ WHERE IS LEADERSHIP?
The stronger sector evidence remains concentrated in a few areas.
🟢 Healthcare $XLV: +25.62% RS126D
🟢 Biotechnology $IBB: +23.20%
🟢 Cloud $WCLD: +31.60%
🟢 Energy $XLE: +10.42%
🟢 Genomics $ARKG: +40.27%
Healthcare and biotechnology have particularly strong tactical and structural relative strength.
Cloud retains substantial six month leadership, but its tactical momentum has cooled.
Energy and genomics remain positive over six months, although their shorter windows are less convincing.
Cybersecurity $CIBR and software $IGV retain positive six month relative strength, but the recent tactical measurements remain negative.
The sector and stock pictures are not identical.
⚠️ THE BIGGEST WARNING: SEMICONDUCTORS
🔴 $SOXX:
RS21D: -26.74%
RS126D: -23.61%
🔴 $SMH:
RS21D: -21.80%
RS126D: -19.66%
🔴 $XSD:
RS21D: -18.78%
RS126D: -28.39%
Tactical readings improved from the previous session, but all three remain deeply negative against the broad market.
The six month readings for SOXX and SMH deteriorated further.
One better tactical measurement is not a confirmed structural reversal.
📉 MARKET BREADTH
The radar tracks 54 sector and theme relationships.
🟢 12 fully aligned.
🟡 9 partially aligned.
🔴 33 unaligned.
Only 17 have positive RS126D.
Positive RS21D participation declined from 21 to 20 groups.
Positive RS42D participation declined from 15 to 14.
Fully aligned participation did not expand.
The market has leadership pockets, but not broad confirmation.
🎯 THE STOCK OPPORTUNITY SET
The radar tracks 1,318 stocks.
🟢 55 Conditional Front Line.
🟡 49 Developing Leadership.
🔵 104 combined candidates.
🔴 0 Fully Confirmed Front Line.
Only 7.9% of the tracked universe sits in the two strongest screening layers.
WHERE IS LEADERSHIP CONCENTRATED?
🟢 Software IGV: 21 candidates.
🟢 Cybersecurity CIBR: 12.
🟡 Technology $XLK: 12.
🟢 Healthcare XLV: 11.
🟡 Financials $XLF: 8.
These five groups account for 64 of the 104 combined candidates, approximately 61.5%.
Software retains 16 Conditional Front Line candidates.
Technology has 12 Developing candidates but zero Conditional Front Line candidates.
Financials have eight Developing candidates and zero Conditional Front Line candidates.
That is why the headline candidate count does not tell the whole story.
⚠️ THE DATA WARNING
The November 6 benchmark and sector calculations have refreshed, but one benchmark relationship and three sector proxies still have November 5 observations.
Individual stock coverage is incomplete.
The imported driver layer also remains older than the current session.
Those limitations prevent me from treating the dashboard as complete market and driver confirmation.
🔎 WHAT AM I WATCHING NEXT?
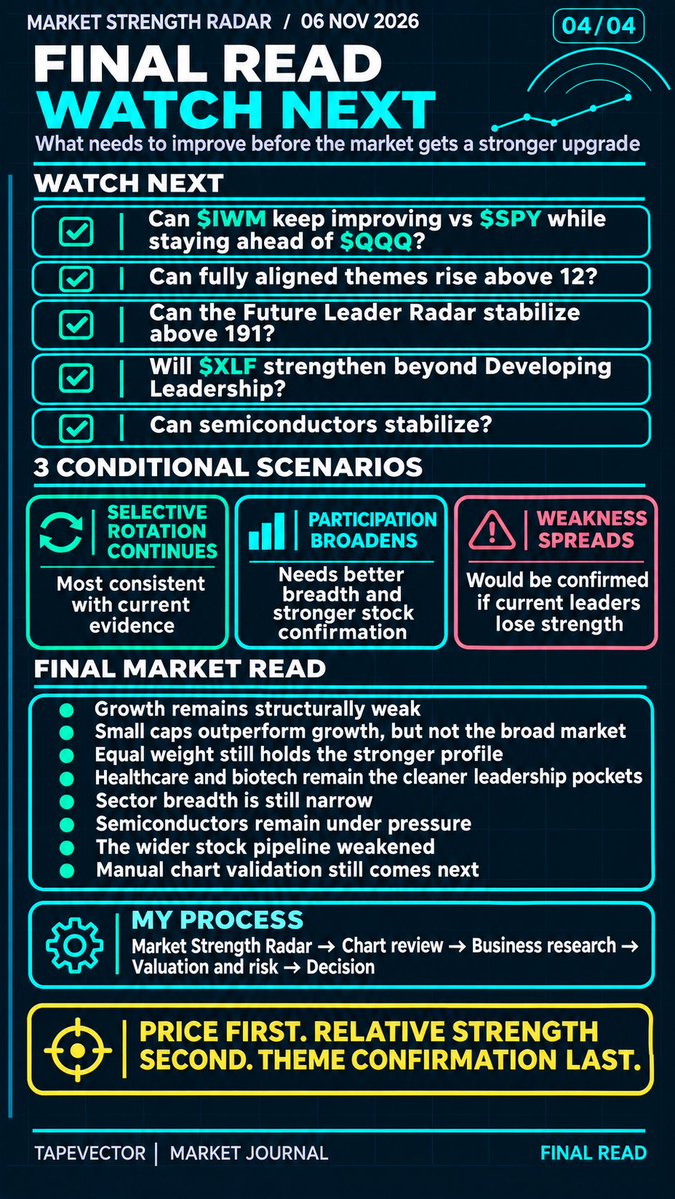
Can small caps maintain their six month advantage over growth and improve against the broad market?
Can fully aligned themes expand above 12?
Can the Future Leader Radar stabilize after losing 58 candidates?
Will financials develop stronger stock and theme confirmation?
Can semiconductor relative strength recover beyond a tactical improvement?
And will the 55 Conditional Front Line candidates produce clean weekly and daily charts?
📌 MY CURRENT READ
Growth remains structurally weak.
Small caps are outperforming growth.
Equal weight retains a positive relative strength advantage, based on the latest available observation.
Healthcare and biotechnology remain the cleaner sector leadership pockets.
Software and cybersecurity continue dominating stronger individual stock screening.
The Future Leader pipeline weakened, and sector breadth remains narrow.
My classification remains a mixed market with selective rotation, not a confirmed broad recovery.
The dashboard tells me where to look first.
Manual chart validation still comes next.
My market journal, not financial advice.
🚨 DEVELOPING LEADERSHIP | NOVEMBER 7, 2026
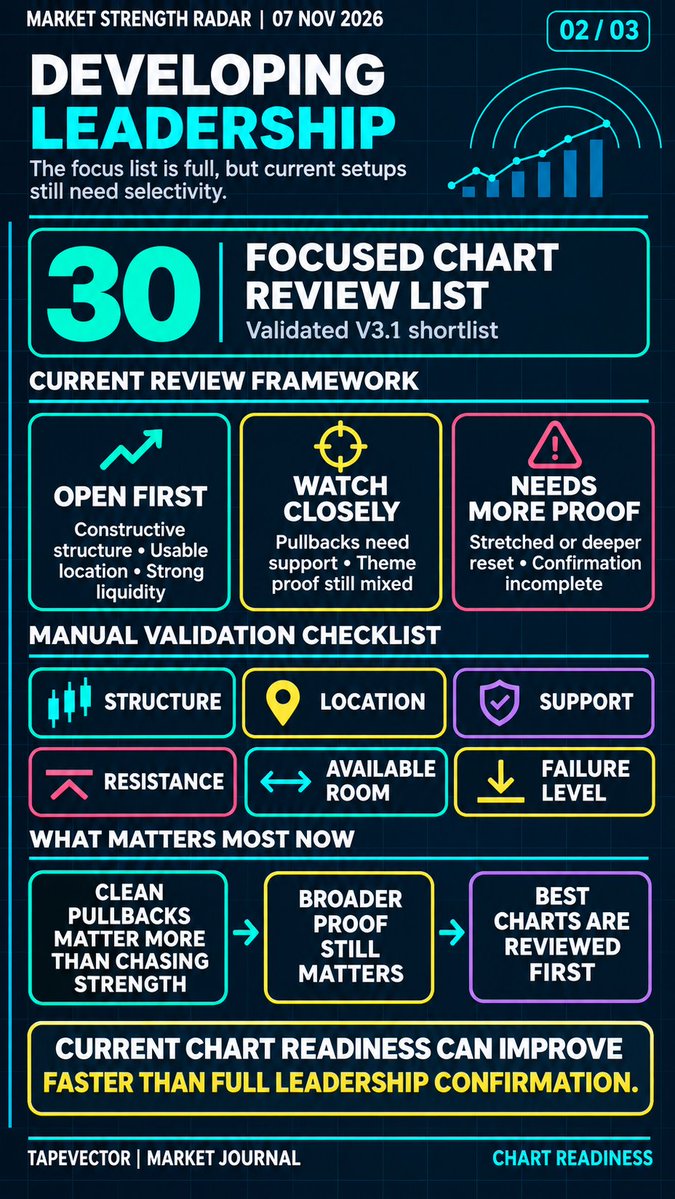
THE DEVELOPING LEADERSHIP POOL IS NARROWING. BUT MORE CHARTS ARE BECOMING TECHNICALLY RELEVANT.
Yesterday, Developing Leadership contained 55 stocks.
Today, it contains 49.
The focused chart review list remains at 30 stocks.
But the number of Best Positioned Now candidates increased from 7 to 12.
That is constructive for current chart readiness.
The problem is that stronger charts are not receiving complete confirmation from supporting themes, benchmarks and the broader market.
The next layer of potential leadership is taking shape.
Full confirmation is still missing.
📊 WHAT CHANGED IN THE DEVELOPING LEADERSHIP UNIVERSE?
Across the 49 stocks:
🟢 23 have aligned stock relative strength trends.
🔵 26 have mixed but positive relative strength evidence.
🟢 23 have aligned supporting theme trends.
🟡 26 have mixed positive theme trends.
The evidence becomes less convincing when I require the stock and its supporting theme to confirm together.
Only 3 stocks have fully confirmed stock and theme relationships.
Another 20 have confirmed stock strength but mixed theme confirmation.
The remaining 26 still have mixed broader confirmation.
All 49 remain under mixed broader market conditions.
That is the central distinction.
Some individual stocks are already performing well.
Others have constructive technical structures and improving theme relationships.
But the evidence is not consistently aligned across the full radar.
A technically strong stock does not automatically qualify as Front Line Leadership.
The next step is stronger confirmation, not simply a higher price.
🛡️ WHERE THE NEXT LEADERSHIP LAYER IS FORMING
The six largest theme concentrations:
🟢 $XLK: 12, technology
🟢 $XLF: 8, financials
🟢 $XBI: 6, biotechnology
🔵 $IGV: 5, software
🟡 $ARKG: 3, genomics
🟢 $XLV: 3, healthcare
These six lanes contain 37 of the 49 Developing Leadership stocks.
That is approximately 76% of the universe.
Yesterday, the six largest lanes represented approximately 75%.
The concentration remains high, but the composition has changed.
One important difference is the semiconductor group.
Yesterday, $SOXX accounted for 11 Developing Leadership names.
Today, that theme lane has none.
Financials now represent eight developing candidates.
This is a meaningful change in the screening composition.
But I am not automatically interpreting it as an improvement or deterioration in market leadership.
A stock can leave Developing Leadership because it moves toward stronger confirmation.
It can also leave because the supporting evidence weakens or its classification changes.
The net universe change does not establish which explanation applies to every stock.
Technology remains the largest developing group, with financials becoming more visible.
Biotechnology, healthcare and software continue to provide additional potential candidates.
However, approximately three quarters of the developing universe remains concentrated in six theme lanes.
That is not convincing evidence of broad participation.
I want to see more stocks confirming across different sectors, not simply a different concentration of candidates.
🎯 THE FOCUSED CHART REVIEW FUNNEL
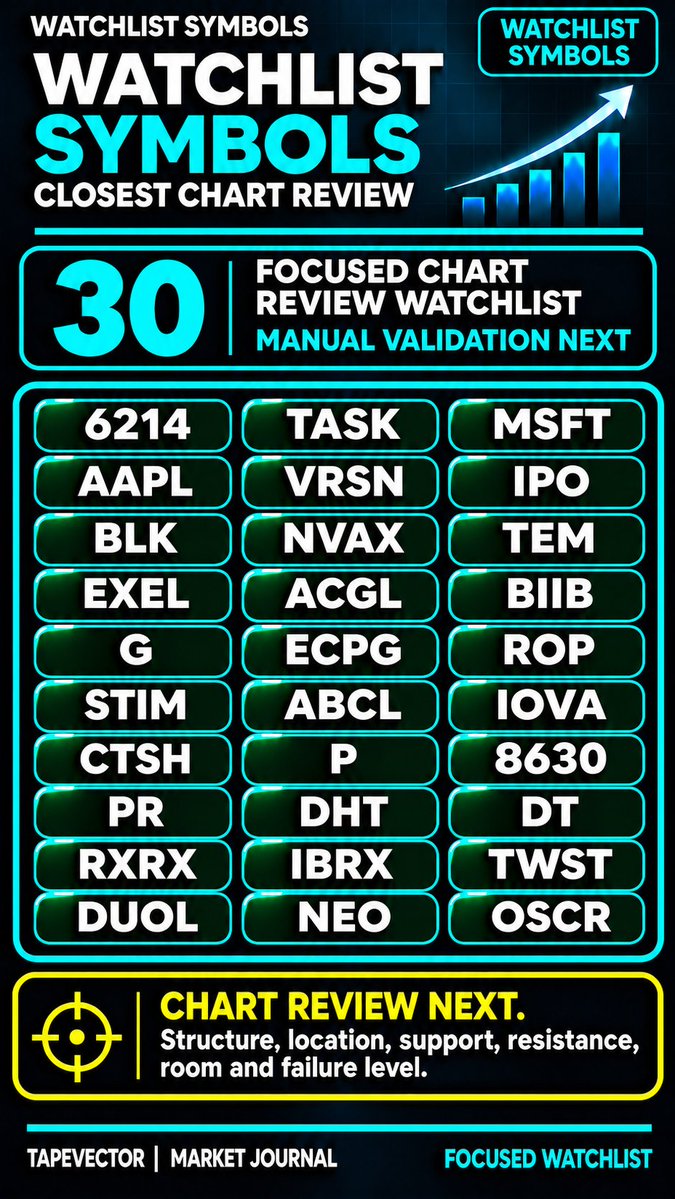
The experimental V3.1 selection contains 30 verified stocks from the larger 49 stock Developing Leadership universe.
🟢 Best Positioned Now: 12
🔵 Close to Confirmation: 4
⚪ Building Strength: 14
Compared with November 6:
Focused list: 30 → 30
Best Positioned Now: 7 → 12
Close to Confirmation: 3 → 4
Building Strength: 20 → 14
The number of cleaner current chart candidates increased.
That is a positive development for the screening process.
But the shortlist also changed.
Twenty-two stocks remain from yesterday's focused list.
Eight entered and eight left.
Therefore, the improvement cannot be attributed entirely to the same stocks becoming technically stronger.
The composition changed alongside chart readiness.
TREND STRUCTURE
🟢 9 strong uptrends
🔵 5 uptrends
🟡 2 repairing charts
⚪ 14 mixed structures
Fourteen stocks have established uptrends.
Sixteen are still repairing or showing mixed structures.
That is an improvement in the technical opportunity set, but the group is not uniformly strong.
CURRENT ENTRY LOCATION
🟢 7 normal extension conditions
🔵 15 pullbacks
🟡 5 deep pullbacks
🔴 3 stretched charts
Half the focused list is currently in pullback conditions.
A pullback can create a better entry location, but only when support behavior, remaining upside room and the failure level make sense.
Five names are in deeper resets.
Three are stretched.
Good chart structure and good current entry quality remain separate questions.
EXECUTION LIQUIDITY
🟢 26 high liquidity
🔵 1 normal liquidity
🟡 3 limited liquidity
Liquidity is generally constructive.
The bigger weakness is technical consistency and incomplete wider confirmation.
📌 WHAT THE 30 STOCKS ARE ACTUALLY PROVING
Across the focused selection:
🟢 20 have aligned stock relative strength trends.
🔵 10 have mixed positive stock relative strength.
🟢 12 have aligned supporting theme trends.
🟡 18 have mixed positive theme trends.
All 30 remain under conditional broader market conditions.
This is important.
The focused list contains technically constructive stocks.
But their supporting evidence is not equally complete.
Some have established stock strength while their themes are still mixed.
Others have aligned themes while their stock relative strength remains inconsistent.
A few have both stock and theme confirmation but lack broader market support and a clean immediate chart.
Different stocks have different evidence gaps.
That is why I separate source leadership quality from current chart readiness.
🔎 THE FIRST CHARTS I AM OPENING
🟢 BEST POSITIONED NOW | 12 STOCKS
These are the cleaner technical candidates within the current Developing Leadership selection.
But they are not all equally confirmed.
$6214
+43.8% primary relative strength.
Uptrend with a pullback.
The stock relative strength trend is aligned, but supporting theme confirmation remains mixed.
The technical chart deserves review before considering the strength durable.
$TASK
+40.7% relative strength.
Strong uptrend with normal extension.
Internal driver evidence is constructive.
However, average daily traded value is approximately USD 2.30 million.
Liquidity remains limited, making execution quality important.
$MSFT
+30.9% relative strength.
Uptrend with a pullback and high liquidity.
The stock evidence is aligned, but supporting theme confirmation remains mixed.
A controlled pullback could be constructive if support holds.
$AAPL
+21.8% relative strength.
Uptrend with a pullback and high liquidity.
Individual stock strength is aligned.
The wider technology confirmation still needs improvement.
$VRSN
+13.2% relative strength.
Strong uptrend with a pullback and high liquidity.
The larger structure is constructive, but the immediate support area still needs manual validation.
$IPO
+1.4% relative strength.
Strong uptrend with normal extension.
Average daily traded value is approximately USD 1.67 million.
The UK listing has limited liquidity, and its latest price date is November 5.
Execution and session timing matter.
$BLK
-2.6% primary relative strength.
Strong uptrend, normal extension and high liquidity.
The stock relative strength trend is aligned despite the slightly negative primary reading.
That distinction matters.
A constructive trend classification does not mean every relative strength window is positive.
$NVAX
-5.8% relative strength.
Uptrend with a pullback.
ATR is approximately 7.7% of price.
The stock has a constructive current technical classification, but volatility and incomplete theme confirmation still matter.
$TEM
+23.1% relative strength.
Uptrend with normal extension and high liquidity.
The supporting health innovation theme is aligned.
But stock relative strength confirmation remains mixed positive.
The theme is more convincing than the complete stock evidence.
$EXEL
+13.9% relative strength.
Strong uptrend, normal extension and high liquidity.
The supporting biotechnology theme is aligned.
Stock relative strength evidence is still mixed positive.
The current chart is constructive without complete wider confirmation.
$ACGL
+2.5% relative strength.
Strong uptrend, normal extension and high liquidity.
Both stock and supporting theme evidence remain mixed positive.
The technical structure is better than the complete relative strength evidence.
$BIIB
+2.1% relative strength.
Strong uptrend with a pullback.
The supporting biotechnology theme is aligned, but stock relative strength remains mixed positive.
The chart deserves review, although broader confirmation remains incomplete.
These twelve stocks are currently the stronger technical candidates within Developing Leadership.
Some have aligned stock strength and incomplete theme confirmation.
Others have stronger theme evidence but mixed stock confirmation.
A few have constructive trends despite weak primary relative strength readings.
The category is the same.
The missing confirmation is not identical.
🔵 CLOSE TO CONFIRMATION | 4 STOCKS
The next group remains technically relevant but needs a better immediate setup.
$G
+32.4% relative strength.
The chart is repairing and stretched.
Stock strength is constructive, but the immediate technical location is not clean.
$ECPG
+19.9% relative strength.
Strong uptrend, but stretched.
The larger structure is constructive.
I want a more controlled entry location.
$ROP
+24.7% relative strength.
Strong uptrend, but stretched.
Supporting theme evidence is aligned.
The stock relative strength trend remains mixed positive, and the current price location needs improvement.
$STIM
+0.9% relative strength.
Repairing structure with a pullback.
ATR is approximately 11.6% of price, while average daily traded value is approximately USD 2.67 million.
Volatility, liquidity and incomplete technical repair all require caution.
These four names remain worth monitoring.
But a strong relative strength reading does not guarantee a clean entry.
Good structure, bad current location can still be a reason to wait.
⚪ BUILDING STRENGTH | 14 STOCKS
This group is especially important because several names have strong relative performance without established immediate technical structures.
$ABCL
+69.6% primary relative strength.
The stock is in a mixed trend with a pullback.
Individual relative performance is strong, but its current technical structure and theme confirmation remain incomplete.
$IOVA
+67.6% relative strength.
The chart remains mixed and in a deep pullback.
ATR is approximately 15.4% of price.
Strong relative performance does not remove volatility risk.
$P
+27.7% relative strength.
Mixed structure with a deep pullback.
ATR is approximately 10.1% of price.
The stock deserves monitoring, but a usable technical recovery is still missing.
$TWST
+35.4% relative strength.
Mixed technical structure with a pullback.
ATR is approximately 13.6% of price.
Theme evidence is aligned, but stock relative strength confirmation and current chart structure remain incomplete.
$DUOL
+31.4% relative strength.
Mixed technical structure with normal extension.
Supporting theme evidence is aligned, and internal driver evidence is constructive.
The missing piece is a more established stock trend.
Three other names deserve a specific distinction.
$PR $DHT $DT
All three have confirmed stock and theme relationships in the radar.
But their immediate charts remain mixed and in deep pullback conditions.
Their primary relative strength readings are also slightly negative.
And the broader market remains conditional.
This is a useful example of why confirmed stock and theme evidence does not automatically create a trade ready setup.
The remaining developing charts:
$CTSH $8630 $RXRX $IBRX $NEO $OSCR
These six remain in mixed technical structures.
Some have aligned stock relative strength.
Others have aligned supporting theme trends.
But their current chart structures are not yet consistently established.
All fourteen remain relevant to the developing opportunity set.
Relevance is not readiness.
⚠️ WHAT IS STILL MISSING?
Three confirmation layers matter most.
STOCK AND THEME ALIGNMENT
The Developing Leadership universe contains constructive evidence.
But only three names show complete stock and theme confirmation together.
I want more consistency between individual stock performance, supporting themes and relevant benchmarks.
CHART STRUCTURE
Sixteen of the thirty focused stocks are repairing or in mixed structures.
A strong theme can remain constructive while an individual stock fails to establish a usable setup.
I need clearer support, resistance, available room and realistic failure levels.
BROADER MARKET CONDITIONS
All 49 Developing Leadership stocks remain under mixed market conditions.
That creates another obstacle to treating current strength as durable leadership.
I want broader participation and stronger market confirmation before upgrading the interpretation.
📌 WHAT WOULD UPGRADE THE NEXT PHASE?
The strongest developing candidates need better alignment across several layers.
🟢 More consistent stock relative strength.
🟢 Stronger benchmark and theme confirmation.
🟢 More participation from related stocks.
🟢 More mixed and repairing structures transitioning into established uptrends.
🟢 Cleaner entry locations with controlled risk.
🟢 Better broader market confirmation.
I am not expecting every Developing Leadership stock to become a Front Line Leader.
Some may continue underperforming even when their themes remain constructive.
The goal is to identify improving evidence early and then determine whether the price structure supports a usable opportunity.
A better chart alone does not create Front Line Leadership.
📋 FOCUSED DEVELOPING LEADERSHIP WATCHLIST
30 verified unique stocks currently deserve focused manual chart review.
TradingView copy and paste:
TWSE:6214,NASDAQ:TASK,NASDAQ:MSFT,NASDAQ:AAPL,NASDAQ:VRSN,LON:IPO,NYSE:BLK,NASDAQ:NVAX,NASDAQ:TEM,NASDAQ:EXEL,NASDAQ:ACGL,NASDAQ:BIIB,NYSE:G,NASDAQ:ECPG,NASDAQ:ROP,NASDAQ:STIM,NASDAQ:ABCL,NASDAQ:IOVA,NASDAQ:CTSH,NYSE:P,TYO:8630,NYSE:PR,NYSE:DHT,NYSE:DT,NASDAQ:RXRX,NASDAQ:IBRX,NASDAQ:TWST,NASDAQ:DUOL,NASDAQ:NEO,NYSE:OSCR
The source refreshed on November 7 at 05:06 Bucharest time.
Twenty-nine selected stocks carry November 6 prices.
The UK listing carries a November 5 price date.
This is not a synchronized global closing snapshot.
All 30 selected symbols passed the current identity, price, currency and evidence checks.
The experimental V3.1 shortlist differs from the unchanged production selection by two names.
That is a selection difference, not proof that the experimental ranking delivers better returns.
This is a chart review selection, not an automatic buy list.
📌 MY FINAL MARKET READ
Developing Leadership narrowed from 55 to 49 stocks.
The focused review list remains at 30.
Best Positioned Now candidates increased from 7 to 12.
Technology remains the largest developing theme concentration, while financials, biotechnology and software provide additional potential participation.
The evidence is improving in the focused technical selection.
But the wider confirmation picture is still mixed.
Stock relative strength, supporting themes and broader market conditions are not consistently aligned.
Many selected charts still need technical work.
My next step is manual chart validation.
Weekly, daily and 2D structure.
Support, resistance, available room, volatility, liquidity and clear failure levels.
Only charts that survive this review move into deeper company research.
No blind chase.
No automatic entries.
No full size position simply because a stock appears in the radar.
The Focus Engine narrows my attention.
It does not make the trading decision.
The radar tells me what deserves the next review.
The chart still decides whether the setup is usable.
Price first.
Relative strength second.
Theme confirmation last.
My market journal, not financial advice.
Deep dive & support: https://t.co/lR9nZgCynk
Well, this is going to be an interesting journey. 😂
@Twills08 invited me to his $1K to $1M Trading Challenge, even put me on the GOAT list, and I decided the best way to thank him was to turn my starting $1,000 into $471 in the first week.
Excellent start, Paul. Absolutely brilliant!
For anyone who hasn't seen the challenge, the rules are pretty simple. Everyone starts with $1,000, stocks, options and crypto are allowed, no margin, and the first person to reach $1 million wins. Paper or real accounts are accepted, and everyone shares their progress.
I'm doing this on an IBKR paper trading account, and I've decided to use the challenge to learn options trading.
Why options? Because turning $1K into $1M means multiplying the account 1,000 times. Options offer the kind of leverage that could make such a ridiculous target possible.
Unfortunately, that leverage works in both directions, and I've already received a very practical demonstration.
My first victim was $PLTR . Or perhaps I should say I was its first victim.
On November 2, I opened two November 6 / November 13 $185 call calendar spreads.
The idea was to work with different expiration dates rather than simply buying calls and hoping for the best.
On November 3, I bought back the two short November 6 calls at $1.49 each. I closed that leg too early and ended up holding the two November 13 $185 long calls on their own.
And then $PLTR absolutely fucked me.
Or, more accurately, I fucked up the management of my own trade.
Here's what my IBKR account is showing:
Starting balance: $1,000
Realized P&L: +$1,764.06
Unrealized P&L: -$2,296.06
Remaining long calls: -98%
Current value of those calls: around $47
Net liquidation value: $471
Yes, you read that correctly.
I managed to realize $1,764 in profits on one side of the position while the other side lost even more.
I'm now down 52.9% from my starting balance.
My account is redder than the fucking Oscars carpet, and we're only one week into the challenge. 😂
But here's the part I actually find useful.
I entered this competition knowing that I still have a lot to learn about options. I understand stock charts and market structure much better than I understand option pricing, time decay, volatility and how different option legs interact.
And this trade exposed exactly that weakness.
I opened a calendar spread, changed its structure by closing the short calls, and left myself with a directional position that I didn't manage properly.
The market didn't make that decision. I did.
I was initially disappointed that I couldn't participate with real money, but after seeing how I handled this trade, I'm starting to think the paper account was the better choice.
I wouldn't have experimented this aggressively with real capital.
At least here I can make mistakes, examine every trade, understand what happened and hopefully stop repeating the same ones before putting real money at risk.
And I'm going to share the ugly results too, not just the trades that work.
That's part of the challenge for me. Learning options properly while competing with traders who have a lot more experience using them.
A big thank you to @Twills08 for organizing this and bringing everyone together.
To the other participants, I hope your first week went better than mine.
As for my journey from $1K to $1M, I apparently decided to take the scenic route.
First stop: $471.
Only $999,529 to go. 😂
My trading journal, not financial advice.
$1K to $1M Challenge, Ladies and Gents: Here is my eow. I got hit hard x 1 today. Over traded instead of paytience. Lost 40% in one go. Made a good trade after that, and wound up only 25% down from peak.
Here were my trades that caused the kerfuffery…
$VLO: I took entry and almost instantly regretted it. This is a chart that I’m comfortable with in a scenario that will pay out. However, I exited and took a massive loss for my impatience.
$UBER I’ve been watching this chart for the obvious. It’s been grinding down in a steady fashion. I had a fairly good idea that this would form a double top or a H&S on the 4h. I took a short dated expiry, and captured 100%.
Here are the stocks/options I’m currently in as part of the challenge:
$COF $USO $TII
I am watching $RIVN closely as a substitute if one of these doesn’t behave as the should.
On another note, I know that a lot of you took a massive loss over the past one or two days. Chin up. Live to fight another day. Keep grinding. This market is a different kind of beast, and it takes a village to fight it off. I highly recommend getting to know some of the traders following along on this challenge. They are some of the best that I know.
NFA and JFF as always.
🚨 MARKET STRENGTH RADAR | NOVEMBER 6, 2026 CLOSE
📉 GROWTH REMAINS STRUCTURALLY WEAK. SMALL CAPS ARE EXTENDING THEIR LEAD AGAINST GROWTH. EQUAL WEIGHT STILL HAS THE STRONGER BROAD MARKET PROFILE, BUT LEADERSHIP IS NOT BROADENING.
The latest completed Market Strength Radar shows a market where the relative rotation continues, but the stock screening system is producing mixed signals.
The stronger Conditional Front Line pool improved. The total leadership pool contracted slightly. More importantly, the Future Leader Radar lost 58 candidates while the Not Yet Confirmed category expanded by 55.
That is not a clean broadening signal.
📊 WHAT CHANGED SINCE NOVEMBER 5?
🟢 Conditional Front Line: 52 → 55
🔴 Developing Leadership: 55 → 49
🟡 Combined Leadership: 107 → 104
🔴 Future Leader Radar: 249 → 191
🔴 Not Yet Confirmed: 485 → 540
🟡 Fully Aligned Themes: 12 → 12
The highest conditional screening category gained three names, but the wider opportunity pipeline weakened.
There is another important change.
Semiconductors lost all 11 Developing Leadership candidates from the previous snapshot.
Financials now contribute eight Developing candidates.
Some relative strength is rotating away from semiconductors toward financials, but that is a screening shift, not proof that eight financial stocks have clean trade entries.
📉 THE MACRO PICTURE
🔴 $QQQ vs $SPY:
RS21D: -7.93%
RS126D: -7.75%
Growth remains behind the broad market across every measured window.
🟢 $IWM vs QQQ:
RS21D: +11.64%
RS126D: +4.30%
Small caps continue outperforming growth, and the six month advantage increased from +3.06%.
🟡 IWM vs SPY:
RS126D: -3.45%
Small caps are recovering against the broad market, but six month confirmation is still negative.
🟢 $RSP vs SPY:
Last available RS126D: +6.15%
Equal weight retains a positive structural advantage, although this particular benchmark observation is dated November 5, not November 6.
The rotation away from concentrated growth remains visible. Broad market confirmation is still incomplete.
🛡️ WHERE IS LEADERSHIP?
The stronger sector evidence remains concentrated in a few areas.
🟢 Healthcare $XLV: +25.62% RS126D
🟢 Biotechnology $IBB: +23.20%
🟢 Cloud $WCLD: +31.60%
🟢 Energy $XLE: +10.42%
🟢 Genomics $ARKG: +40.27%
Healthcare and biotechnology have particularly strong tactical and structural relative strength.
Cloud retains substantial six month leadership, but its tactical momentum has cooled.
Energy and genomics remain positive over six months, although their shorter windows are less convincing.
Cybersecurity $CIBR and software $IGV retain positive six month relative strength, but the recent tactical measurements remain negative.
The sector and stock pictures are not identical.
⚠️ THE BIGGEST WARNING: SEMICONDUCTORS
🔴 $SOXX:
RS21D: -26.74%
RS126D: -23.61%
🔴 $SMH:
RS21D: -21.80%
RS126D: -19.66%
🔴 $XSD:
RS21D: -18.78%
RS126D: -28.39%
Tactical readings improved from the previous session, but all three remain deeply negative against the broad market.
The six month readings for SOXX and SMH deteriorated further.
One better tactical measurement is not a confirmed structural reversal.
📉 MARKET BREADTH
The radar tracks 54 sector and theme relationships.
🟢 12 fully aligned.
🟡 9 partially aligned.
🔴 33 unaligned.
Only 17 have positive RS126D.
Positive RS21D participation declined from 21 to 20 groups.
Positive RS42D participation declined from 15 to 14.
Fully aligned participation did not expand.
The market has leadership pockets, but not broad confirmation.
🎯 THE STOCK OPPORTUNITY SET
The radar tracks 1,318 stocks.
🟢 55 Conditional Front Line.
🟡 49 Developing Leadership.
🔵 104 combined candidates.
🔴 0 Fully Confirmed Front Line.
Only 7.9% of the tracked universe sits in the two strongest screening layers.
WHERE IS LEADERSHIP CONCENTRATED?
🟢 Software IGV: 21 candidates.
🟢 Cybersecurity CIBR: 12.
🟡 Technology $XLK: 12.
🟢 Healthcare XLV: 11.
🟡 Financials $XLF: 8.
These five groups account for 64 of the 104 combined candidates, approximately 61.5%.
Software retains 16 Conditional Front Line candidates.
Technology has 12 Developing candidates but zero Conditional Front Line candidates.
Financials have eight Developing candidates and zero Conditional Front Line candidates.
That is why the headline candidate count does not tell the whole story.
⚠️ THE DATA WARNING
The November 6 benchmark and sector calculations have refreshed, but one benchmark relationship and three sector proxies still have November 5 observations.
Individual stock coverage is incomplete.
The imported driver layer also remains older than the current session.
Those limitations prevent me from treating the dashboard as complete market and driver confirmation.
🔎 WHAT AM I WATCHING NEXT?
Can small caps maintain their six month advantage over growth and improve against the broad market?
Can fully aligned themes expand above 12?
Can the Future Leader Radar stabilize after losing 58 candidates?
Will financials develop stronger stock and theme confirmation?
Can semiconductor relative strength recover beyond a tactical improvement?
And will the 55 Conditional Front Line candidates produce clean weekly and daily charts?
📌 MY CURRENT READ
Growth remains structurally weak.
Small caps are outperforming growth.
Equal weight retains a positive relative strength advantage, based on the latest available observation.
Healthcare and biotechnology remain the cleaner sector leadership pockets.
Software and cybersecurity continue dominating stronger individual stock screening.
The Future Leader pipeline weakened, and sector breadth remains narrow.
My classification remains a mixed market with selective rotation, not a confirmed broad recovery.
The dashboard tells me where to look first.
Manual chart validation still comes next.
My market journal, not financial advice.
🚨 FRONT LINE LEADERSHIP | NOVEMBER 7, 2026
THE STRONGEST STOCKS AND THEIR THEMES ARE STILL CONFIRMING. BUT THE BROADER MARKET IS NOT FULLY SUPPORTING THEM YET.
Front Line Leadership expanded from 52 to 55 stocks.
All 55 show aligned stock relative strength, confirmed stock and theme relationships, and valid supporting evidence.
But none has full broader market confirmation.
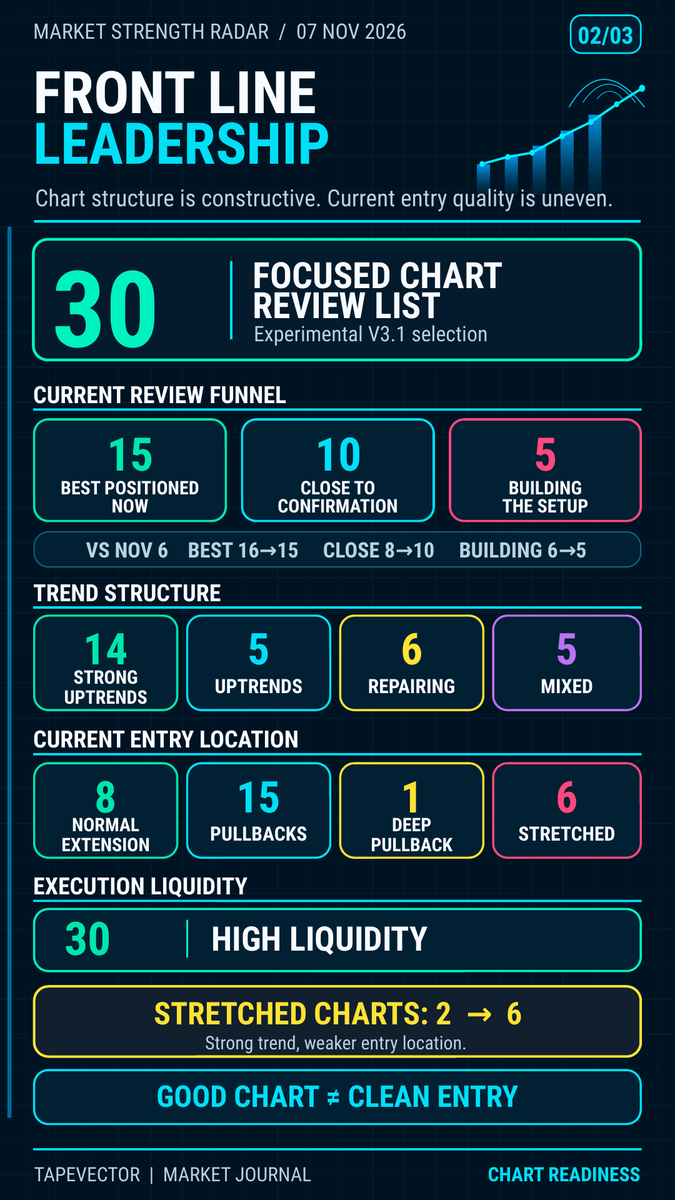
The focused chart review list remains at 30 stocks.
Only 15 are currently Best Positioned Now, compared with 16 yesterday.
Leadership expanded slightly. Current entry quality weakened.
That is the distinction in today's update.
📊 WHAT THE FRONT LINE UNIVERSE SAYS
Across the 55 stocks:
🟢 55 have aligned stock relative strength.
🟢 55 have confirmed stock and theme relationships.
🟢 55 have aligned supporting theme trends.
🟢 55 have valid data.
But the market confirmation layer tells a different story.
🔴 Fully Confirmed Front Line: 0
🟡 Conditional Front Line: 55
All 55 remain under mixed broader market conditions.
This does not mean the individual stocks are weak.
The stock and its supporting theme are already confirming each other.
The missing piece is broader market participation.
That matters because even strong stocks can become less reliable when the wider market deteriorates.
The evidence supports selective leadership.
It does not establish a broadly confirmed market advance.
🛡️ WHERE FRONT LINE LEADERSHIP IS CONCENTRATED
The largest theme lanes:
🟢 $IGV: 16, software
🟢 $CIBR: 11, cybersecurity
🔵 $XLV: 8, healthcare
🟡 $XLE: 5, energy
🟢 $HEAL: 4, health innovation
🔵 $IBB: 4, biotechnology
🟢 $WCLD: 4, cloud software
These seven lanes contain 52 of the 55 Front Line stocks.
That is approximately 95% of the entire leadership universe.
Software and cybersecurity alone account for 27 names, approximately 49%.
Leadership is visible, but still heavily concentrated.
Compared with November 6, the two largest lanes are unchanged.
Healthcare increased from 7 to 8 names.
Health innovation increased from 3 to 4.
Biotechnology increased from 3 to 4.
The additional participation is constructive, particularly inside healthcare related groups.
But I am not interpreting three additional stocks as confirmed market broadening.
Most Front Line leadership remains inside the same established pockets.
I want to see more sectors producing confirmed stock and theme relationships.
Until then, this remains concentrated leadership, not broad participation.
🎯 THE FOCUSED CHART REVIEW FUNNEL
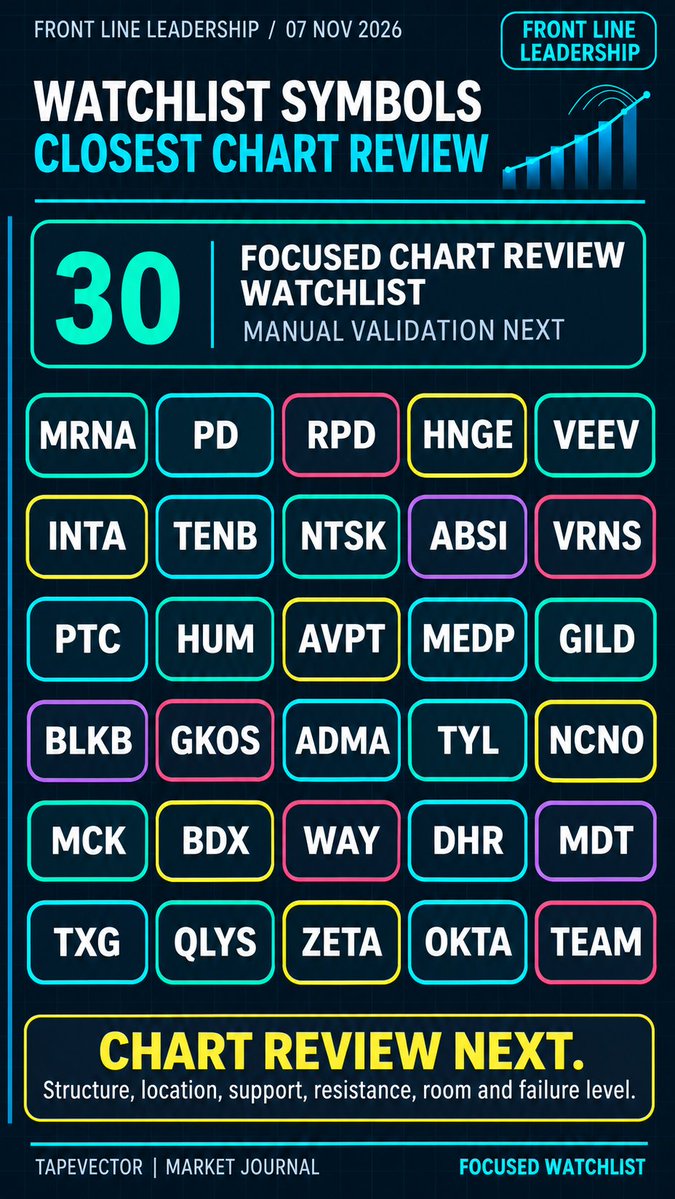
The experimental V3.1 selection contains 30 verified unique stocks from the larger 55 stock Front Line universe.
🟢 Best Positioned Now: 15
🔵 Close to Confirmation: 10
⚪ Building the Setup: 5
Compared with November 6:
Best Positioned Now: 16 → 15
Close to Confirmation: 8 → 10
Building the Setup: 6 → 5
The focused list remains full.
But one fewer candidate is cleanly positioned for immediate chart review.
The technical structure is not necessarily deteriorating across the entire group.
The bigger issue is current entry location.
TREND STRUCTURE
🟢 14 strong uptrends
🔵 5 uptrends
🟡 6 repairing charts
⚪ 5 mixed structures
Nineteen of the thirty focused stocks are in established uptrends.
That is constructive.
Strong uptrends increased from 11 to 14 compared with yesterday.
But stronger trend structure does not automatically create a better entry.
CURRENT ENTRY LOCATION
🟢 8 normal extension conditions
🔵 15 pullbacks
🟡 1 deep pullback
🔴 6 stretched charts
Yesterday, only two focused charts were stretched.
Today, six are stretched.
That is the more important deterioration.
A stock can become technically stronger while simultaneously becoming less attractive to enter.
Higher prices can improve trend confirmation while reducing the available room before resistance.
Good chart, bad current location.
EXECUTION LIQUIDITY
🟢 30 high liquidity
No selected stocks are classified as having normal or limited liquidity.
That removes one common screening obstacle.
But liquidity cannot compensate for a poor entry, excessive extension or an incomplete technical structure.
📌 WHAT THE 30 STOCKS ARE ACTUALLY PROVING
All 30 selected stocks have aligned individual relative strength and supporting theme trends.
All 30 also have confirmed stock and theme relationships.
But every selected name remains under conditional broader market conditions.
This is a strong leadership selection.
It is not a fully confirmed market selection.
And the current charts are not equally attractive.
Some have strong uptrends and reasonable extension.
Others are pulling back inside established trends.
Several are already stretched.
Five have mixed structures despite strong relative strength evidence.
That is why I separate leadership quality from current opportunity quality.
Strong leadership deserves attention.
It does not automatically deserve an entry.
🔎 THE FIRST CHARTS I AM OPENING
🟢 BEST POSITIONED NOW | 15 STOCKS
These are the stocks with the more constructive current technical conditions.
But the quality of the setup still varies.
$MRNA
+131.4% primary relative strength.
Strong uptrend with normal extension and high liquidity.
ATR is approximately 9.3% of price.
The stock and supporting biotechnology theme are aligned.
The structure deserves review, but the volatility is significant.
I still need a realistic failure level and enough room before resistance.
$PD
+68.4% relative strength.
Uptrend with a pullback and high liquidity.
The software theme is aligned.
The pullback could provide a more controlled opportunity, but only if support holds.
$RPD
+56.5% relative strength.
Uptrend with a pullback.
ATR is approximately 9.7% of price.
The cybersecurity theme is aligned.
The immediate question is whether the pullback establishes a usable support area.
Strong relative strength does not eliminate volatility risk.
$HNGE
+53.5% relative strength.
Strong uptrend, normal extension and high liquidity.
The supporting health innovation theme is aligned.
The current technical structure is constructive, although broader market confirmation remains incomplete.
$VEEV
+52.1% relative strength.
Uptrend with a pullback and high liquidity.
The software theme is aligned.
The radar also shows confirming internal driver evidence.
That makes the stock worth deeper investigation, but the actual business explanation still needs independent verification.
$INTA
+48.4% relative strength.
Strong uptrend with a pullback and high liquidity.
The larger structure is constructive.
I want to see whether the current pullback holds support and leaves sufficient upside room.
$TENB
+46.8% relative strength.
Uptrend with a pullback.
The supporting cybersecurity theme is aligned.
But the current entry still depends on support behavior and acceptable risk.
$NTSK
+41.6% relative strength.
Uptrend with a pullback and high liquidity.
The stock is participating in a strong supporting theme.
I still need the chart to confirm that the current pullback is constructive rather than the beginning of a larger deterioration.
These eight illustrate different types of Front Line leadership.
Some are strong and reasonably positioned.
Others are pulling back inside constructive trends.
The leadership evidence is aligned.
The immediate opportunity is not identical.
📈 OTHER BEST POSITIONED STOCKS
Seven additional names remain technically constructive.
HEALTHCARE AND BIOTECHNOLOGY
$HUM $MEDP $GILD
All three have strong uptrend classifications and high liquidity.
The first and third are at normal extension.
The second is in a pullback.
The larger technical structures are constructive, but current entry quality still needs validation.
SOFTWARE AND CYBERSECURITY
$VRNS $PTC $AVPT
These names show strong uptrends with normal extension and high liquidity.
Their supporting themes are aligned.
They deserve attention, although a strong trend still needs an acceptable risk and reward relationship at the current location.
HEALTH INNOVATION
$ABSI
+35.4% relative strength.
Strong uptrend with a pullback.
ATR is approximately 10.9% of price.
The structure is constructive, but the volatility makes position sizing and failure level selection especially important.
These seven complete the 15 Best Positioned Now candidates.
They deserve manual chart review.
They are not automatic entries.
⚠️ TEN CHARTS THAT NEED MORE WORK
This group remains legitimate Front Line leadership.
The problem is the immediate technical opportunity.
STRONG STRUCTURE, STRETCHED LOCATION
🔴 $GKOS $MCK $BDX $MDT
All four have strong uptrend classifications.
But their current locations are stretched.
The bigger structure is constructive.
The immediate entry is less attractive.
I want consolidation, support acceptance or a more controlled pullback before considering a more aggressive position.
REPAIRING AND STRETCHED
🔴 $ADMA $TYL
These two have an additional problem.
Their structures are repairing while their current locations are stretched.
Strong stock and theme confirmation does not resolve that combination.
I want a more established trend and a cleaner price location.
REPAIRING STRUCTURES
🟡 $BLKB $WAY $DHR
All three are repairing with pullbacks.
The leadership evidence remains aligned.
But the immediate charts still need stronger technical confirmation.
REPAIRING WITH NORMAL EXTENSION
🟡 $NCNO
The current location is not classified as stretched.
However, the structure remains in repair.
That is a different problem from excessive extension.
I want the chart to establish a more convincing trend before upgrading its current readiness.
These ten names remain relevant.
But leadership quality and current entry quality are separate questions.
Strong structure does not guarantee a clean entry.
⚪ BUILDING THE SETUP | 5 STOCKS
This group is particularly interesting because relative strength remains constructive even while the immediate charts are mixed.
$TXG
+61.0% primary relative strength.
Mixed technical structure with a pullback.
ATR is approximately 12.2% of price.
The stock and genomics theme are aligned, but the immediate chart is not yet established.
$QLYS
+51.3% relative strength.
Mixed structure with a pullback.
The supporting cybersecurity theme is aligned.
A stronger technical trend is still needed.
$ZETA
+51.2% relative strength.
Mixed structure with a pullback.
The software theme remains aligned.
The relative strength evidence is more convincing than the immediate technical setup.
$OKTA
+50.9% relative strength.
Mixed structure with a pullback.
The cybersecurity theme is aligned.
The stock remains relevant, but the current chart needs to establish a stronger structure.
$TEAM
+43.6% relative strength.
Mixed technical structure with a deep pullback.
The software theme is aligned, and internal driver evidence is constructive.
But the immediate chart remains incomplete.
These five show why I do not use relative strength alone to classify a stock as trade ready.
The evidence can be strong while the price structure remains weak or mixed.
Two names in this group also appear in the experimental V3.1 selection rather than the unchanged production shortlist.
That is a selection difference, not proof of better future returns.
⚠️ WHAT IS STILL MISSING?
Three things matter most.
BROADER MARKET CONFIRMATION
All 55 Front Line stocks remain conditional.
The stock and theme relationships are working.
But broader market conditions are mixed.
I want stronger market participation before treating this leadership as broadly confirmed.
CLEANER CURRENT ENTRIES
Six focused charts are stretched.
Six are repairing.
Five have mixed structures.
A strong stock can still offer a poor current entry.
I need realistic failure levels and sufficient room to resistance.
WIDER SECTOR PARTICIPATION
Approximately 95% of the Front Line universe remains concentrated in seven theme lanes.
That is selective strength.
I want stronger confirmation from additional sectors before calling the market advance broad.
📌 WHAT WOULD UPGRADE MY READ?
I want stronger evidence across several layers.
🟢 Broader market conditions improving from mixed to supportive.
🟢 More sectors establishing confirmed stock and theme leadership.
🟢 Stretched charts resetting into controlled technical locations.
🟢 Repairing charts establishing sustainable uptrends.
🟢 More attractive entries with clear risk levels and room to resistance.
The next step is not to assume every strong stock deserves more exposure.
It is to determine which companies can maintain leadership while offering a usable entry.
📋 FOCUSED FRONT LINE LEADERSHIP WATCHLIST
30 verified unique stocks currently deserve the closest manual chart review.
TradingView copy and paste:
NASDAQ:MRNA,NYSE:PD,NASDAQ:RPD,NYSE:HNGE,NYSE:VEEV,NASDAQ:INTA,NASDAQ:TENB,NASDAQ:NTSK,NASDAQ:ABSI,NASDAQ:VRNS,NASDAQ:PTC,NYSE:HUM,NASDAQ:AVPT,NASDAQ:MEDP,NASDAQ:GILD,NASDAQ:BLKB,NYSE:GKOS,NASDAQ:ADMA,NYSE:TYL,NASDAQ:NCNO,NYSE:MCK,NYSE:BDX,NASDAQ:WAY,NYSE:DHR,NYSE:MDT,NASDAQ:TXG,NASDAQ:QLYS,NYSE:ZETA,NASDAQ:OKTA,NASDAQ:TEAM
The data refreshed on November 7 at 05:06 Bucharest time.
All 30 selected stocks carry November 6 price dates.
The selected symbols passed the current identity, price, currency and evidence checks.
The experimental V3.1 shortlist differs from the unchanged production selection by two names.
That is a selection difference, not demonstrated ranking superiority.
This is a chart review selection, not an automatic buy list.
📌 MY FINAL MARKET READ
Front Line Leadership expanded from 52 to 55 stocks.
All 55 have aligned individual stock strength and supporting theme confirmation.
But all remain conditional because the broader market is mixed.
Software and cybersecurity remain the largest leadership concentrations.
Healthcare related participation has improved slightly.
The focused selection remains at 30 stocks.
Fifteen are Best Positioned Now.
Ten are Close to Confirmation.
Five are Building the Setup.
The larger technical structures remain constructive.
But six focused stocks are now stretched, compared with two yesterday.
That is why I am separating the quality of the leadership from the quality of the current entry.
The next step is manual chart validation.
Weekly, daily and 2D structure.
Support, resistance, available room, volatility, liquidity and clear failure levels.
Only charts that survive this review move into deeper company research.
No blind chase.
No automatic entries.
No full size position simply because a stock appears in the radar.
The Focus Engine narrows my attention.
It does not make the trading decision.
The stocks and themes are providing leadership evidence.
The broader market has not yet provided full confirmation.
And the chart still decides whether the current setup is usable.
Price first.
Relative strength second.
Theme confirmation last.
My market journal, not financial advice.
Deep dive & support: https://t.co/lR9nZgCynk