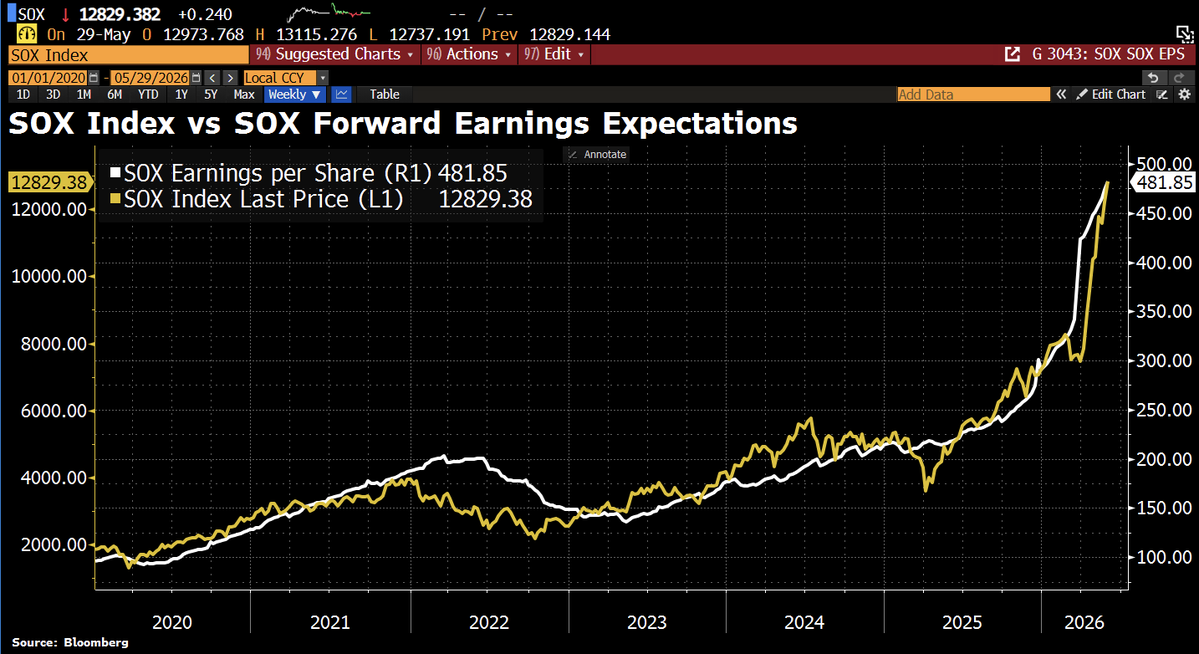
One of the most striking charts out there: the SOX index has risen sixfold since 2020, while SOX earnings per share have climbed fivefold. In other words, most of the rally has been backed by real earnings growth, not just higher valuations. The key question now is whether these profits will actually come through and whether they can keep rising. (HT Goldman Sachs)
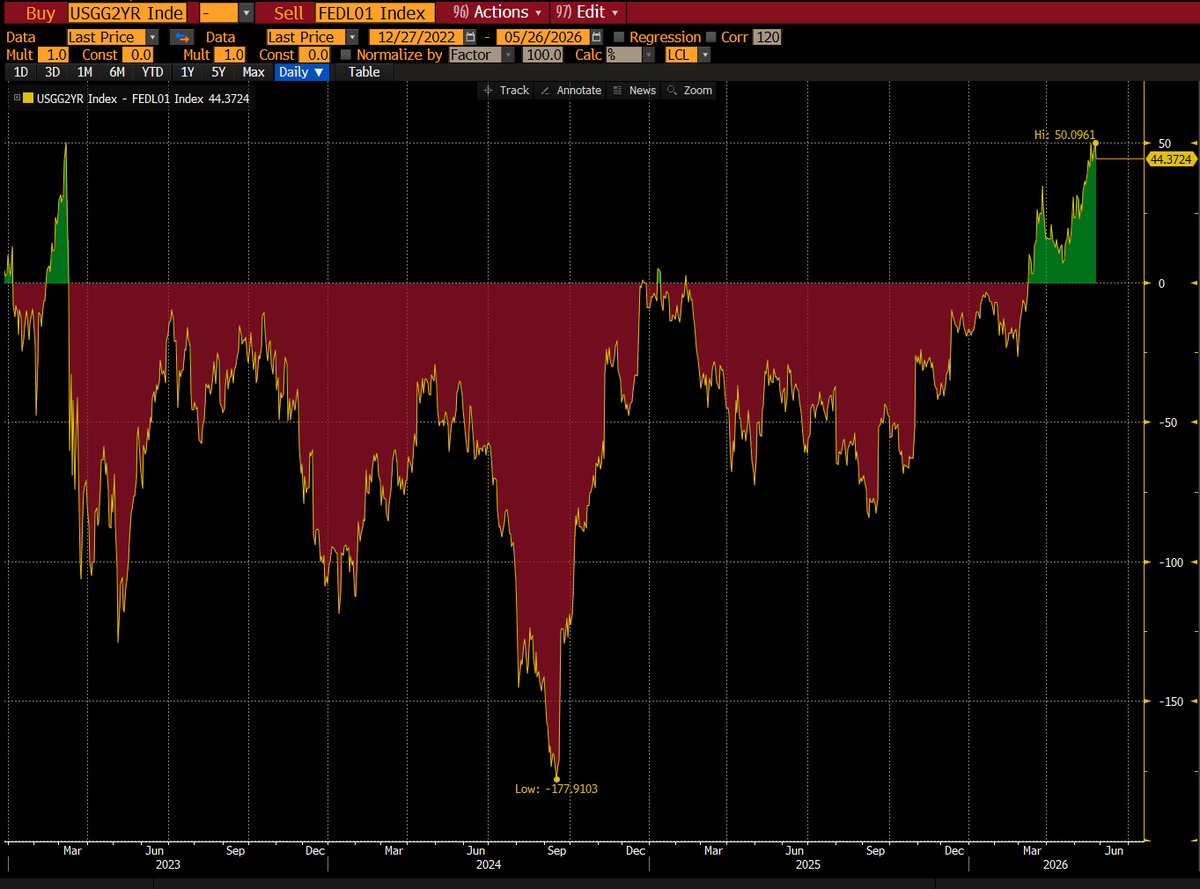
Traders aren't listening as much to Fed speak as forward guidance and instead are pricing in rate hikes with more certainty than what's coming from US central bankers. Last week, US 2-year yields climbed to 50bp above the Fed funds rate, the biggest gap since late 2022.
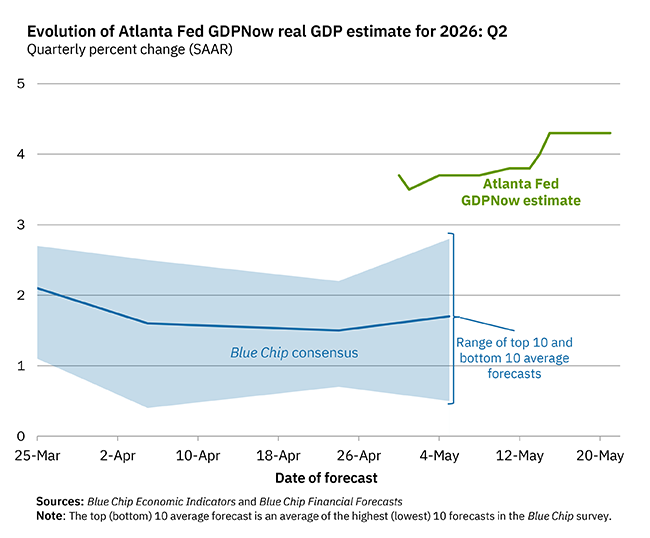
On May 21, the #GDPNow model nowcast of real GDP growth in Q2 2026 is 4.3%: https://t.co/T7FoDdgYos. #ATLFedResearch
Download our EconomyNow app or go to our website for the latest GDPNow nowcast: https://t.co/JPMzsC5TNo.
Total AI investment has only added a few tenths to the level of US GDP in the last few years since nearly all the high value parts are imported. Nice recent chart from @RenMacLLC which lines up with some recent work I did as well.
https://t.co/Rb9hmAXtmz
🚨 After six incredible years at Bloomberg building index products and portfolio solutions, I’m happy to announce I’m stepping into a new role as Head of Research @Silicon_Data. I’m honored to join my former colleague @carmenli—one of the sharpest and hardest-working humans I know—and an exceptionally talented team.
We are bringing standard benchmarks and financial derivatives to the physical market of AI compute, which now numbers over a trillion $ in planned expenditures. Last week, Silicon Data and @CMEGroup announced plans to launch the first compute futures.
The stakes are high and there are risks in being both too aggressive or too cautious, as evidenced recently by Anthropic’s compute constraints. This is exactly what financial derivatives were meant to do: help measure, transform, and manage capital risks.
Silicon Data is systematically collecting a vast amount of data across the entire AI value chain around the globe: GPU rental prices, model token prices, usage and expenditures, utilization metrics, data center bottlenecks, and token economics, just to name a few.
Traded financial derivatives on AI data leverage wisdom of the crowd, bring about liquidity and price discovery, and provide builders and users of AI compute the instruments with which they can price their risks and plan their capital allocation.
If you’re building AI infrastructure, running data centers, or wrestling with compute allocation, let’s talk.
I’m excited to help solve one of the biggest missing pieces in the AI ecosystem. Let’s go! 🚀
@Maverick_Equity@CliffordAsness Great 2 charts, thx! Can you please post also the notional from the initial post, yet the version with recessions and drawdowns like you have it with these 2? THX!
Good Morning from Germany, where business morale has improved for 1st time since the Iran war. The Ifo Expectations Index rose to 83.8 in May, from a revised 83.5 the prev month. The Current Assessment Index also surprised on the upside, rising to 86.1 from 85.4 in April. This points to stabilization, but not yet a real turnaround. A slight contraction in GDP in Q2 is still expected, after 0.3% growth in Q1.
The tweet says “as a percentage of the economy” but the graph seems to just be the notional value.
As a percentage of the economy it is high but doesn’t look like the below.
As a percentage of market cap (because the market is expensive vs. GDP) it is low.
For the, it feels like, 1000th time. It is not a surprising result that the higher expected return / vol asset outperforms over time. But we are (literally 3rd day of finance class) supposed to separate out how much risk to take from what’s the best portfolio in which to take it. A 90/10 portfolio has a decently lower Sharpe-ratio than 60/40 and even more so vs risk balanced stocks and bonds. Leverage is a danger but modest leverage can be less of a danger than concentration and worth it for a higher Sharpe at the same risk level. And the theory has long-term worked.
@neilksethi@MikeZaccardi If I am wrong there with anything, happy to say my bad and apologise. If not, sorry, but other's research is not anybody else's research. Copy pasting from others, then asking for credit from others that copy paste is strange at least to say
@neilksethi@MikeZaccardi I get the part that one takes time to read the stuff, select the interesting stuff, and have their commentary.
But the part of 'MAKING' the chart I don't when it is a 3rd party one: making the chart, buying the raw data / license is the HARDEST part, not copy paste & commentary
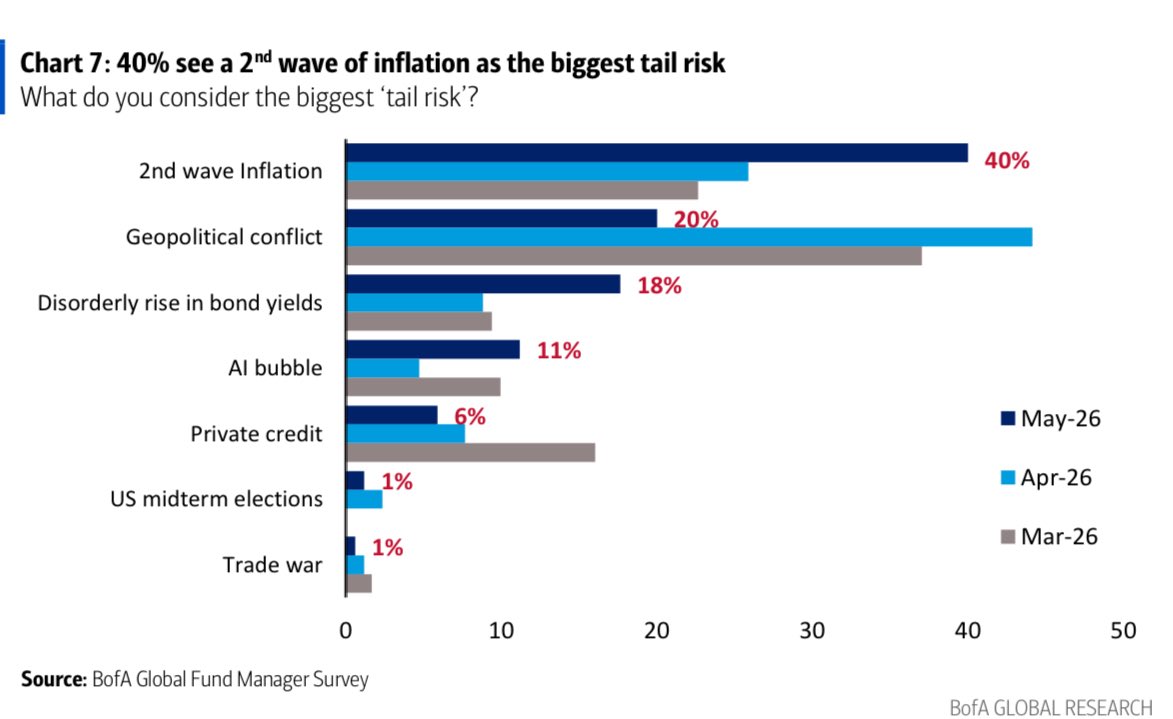
Two takeaways from May’s BofA fund manager survey: first, equity allocations surged by a record amount on the month, and second, 40% of respondents see a second wave of inflation as the biggest tail risk. The two ideas are connected: stocks are increasingly seen as an inflation hedge