$FAN is testing a major breakout zone near (2021 highs).
After years of consolidation, relative strength is improving, momentum is accelerating, and the rounded base suggests long-term accumulation.
Clean setup. Clear level. Strong theme.
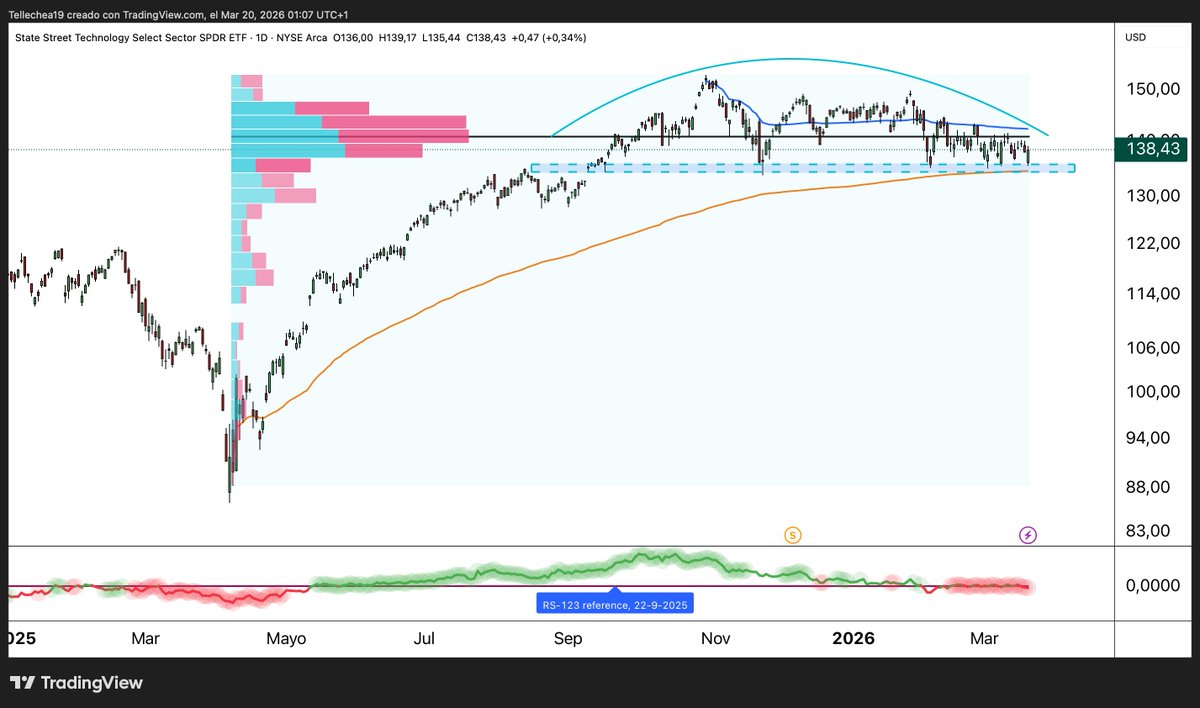
Tech led the bull run. Now it may be topping.
$XLK has formed a rounded top from its $153 ATH — the pattern that develops slowly and strikes without warning.
$1.88B out the door in 3 months. RS turning red. Volume wall at $138–$143.
📎 https://t.co/CzKG74xgjx
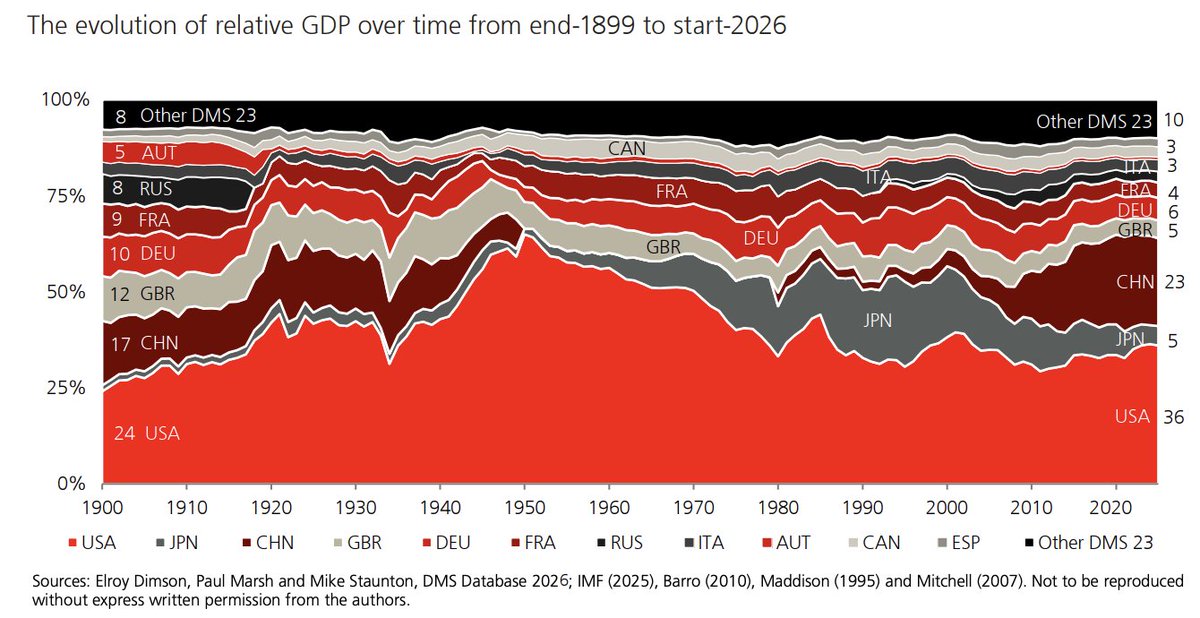
The 2026 Global Investment Returns Yearbook is out!
• US Dominance - The US market now dominates, accounting for around 62% of total world equity market value today.
• Industry Mix - Of the US firms listed in 1900, ~80% of their value was in industries that are small or extinct today. Meanwhile, 70% of today’s companies in the US come from industries that were small or non-existent in 1900.
• Inflation - Although the US had the third-lowest rate of inflation in the DMS 35 markets, averaging 2.9% per year since 1900, this still means that USD 1 in 1900 had the same purchasing power as USD 38 today.
• Gold - Of the 28 years in which inflation exceeded 3%, gold returns were negative in 13 of them. Since 1900, annualized real gold returns were 1.3% but in the 54 years post Bretton Woods, it's 4.7% (US).
• Geopolitical Risk - Using a simple regression of future world equity returns against a geopolitical threat index, the authors found no relationship (both 1 month and 1 year ahead).
• Diversification Still Works - Since 1900, equities and bonds have on several occasions lost more than 70% in real terms. yet a 60:40 equity:bond blend has never declined more than 50%.
https://t.co/Ggn04v68oO
Just saw this, but we lost a true legend last month.
John Murphy started @StockCharts and he is one of the main reasons I do what I do.
I read all of his books more than 20 years ago and it shaped how I view the world. His research notes were second to none and taught generations of investors how to read the tea leaves.
I mention all the time (I did it just last week) in interviews that I am a disciple of John Murphy and use intermarket analysis to make many investment decisions.
John, thank you for everything you've done to make our industry better.
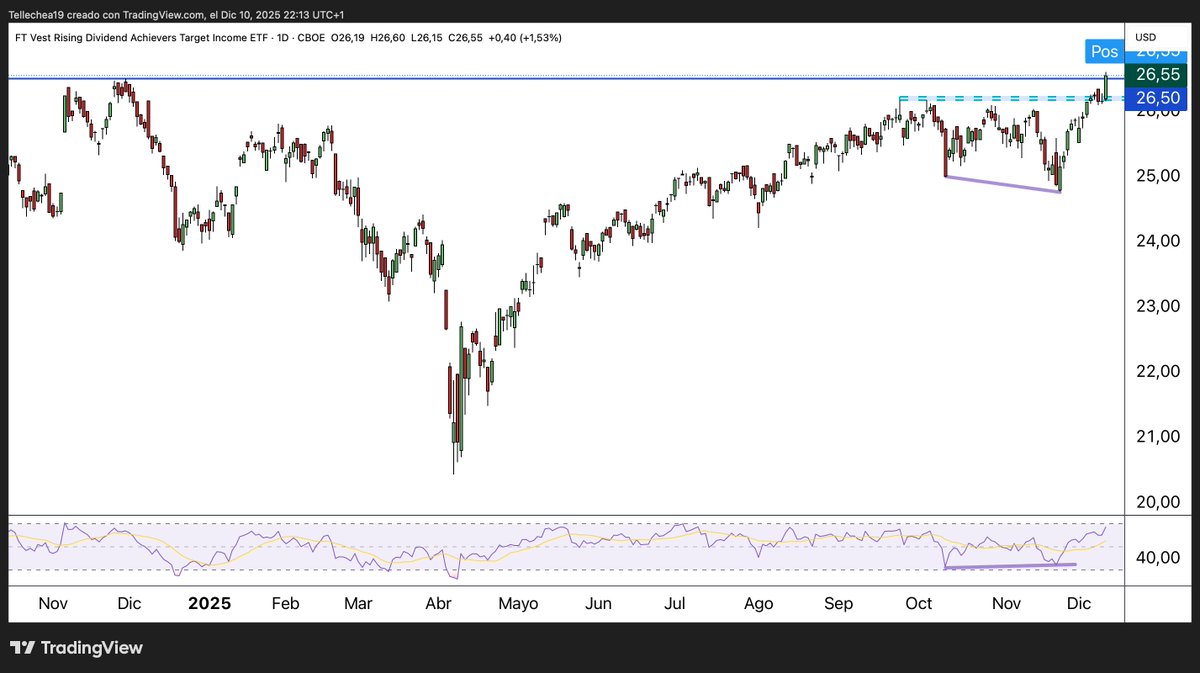
$RDVI just pushed above $26, establishing a new all-time high and extending its ~28% rally off the April lows. A high-yield dividend powerhouse shining as the Fed shifts toward cuts. Who’s stacking?
Palladium: Trend reversal after a 3-year bear market?
#Palladium just printed its first major higher-high since the 2021 collapse.
This signals a potential structural shift.
Short-term outlook: positive (+40–52% YTD).
But long-term risk remains due to the EV transition.
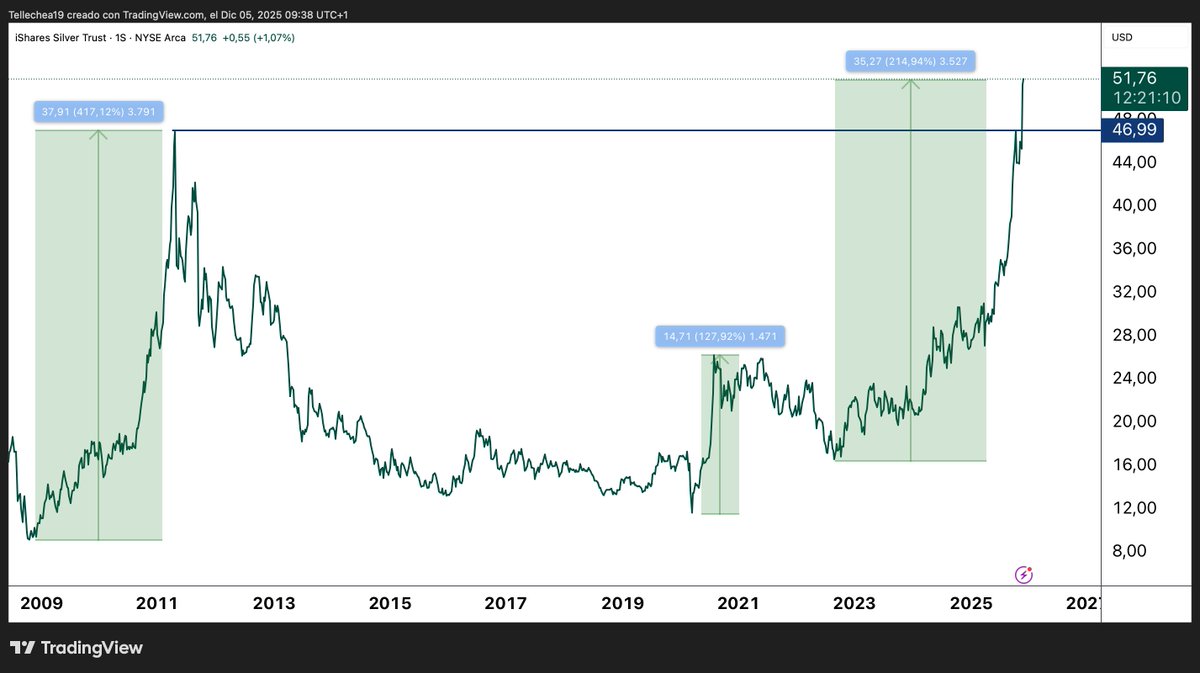
Silver a long-term structural breakout.
$SLV is outperforming even within the metals group.
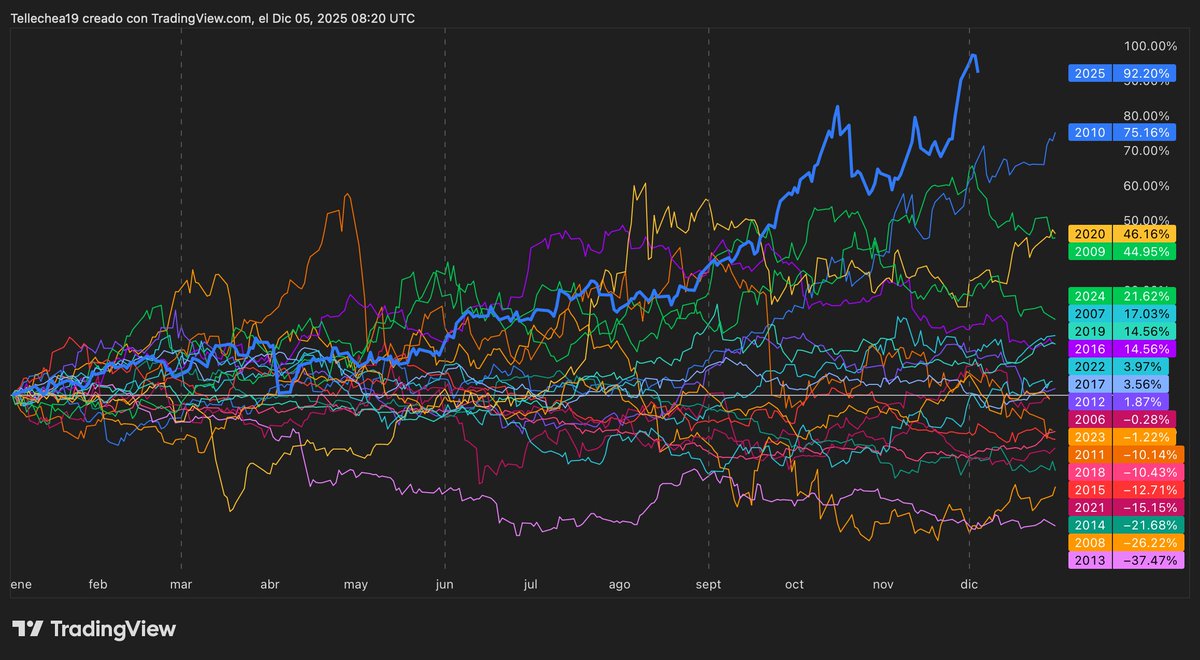
Seasonality shows 2025 is one of the strongest years since 2010.
A base this wide generally precedes long-lasting, accelerated uptrends.
The breakout above $51 validates this scenario
The rally is being driven by:
• flight-to-quality flows
• structural inflation narrative
• strong industrial and tech demand
• USD weakness
This aligns with the technical breakouts we’ve seen in gold, silver, and aluminum.
2025 is shaping up to be a historic year for metals.
Today’s Chart Advisor report for Investopedia highlights three major signals shaping the global market.
🧵👇
https://t.co/esyJVkomyw
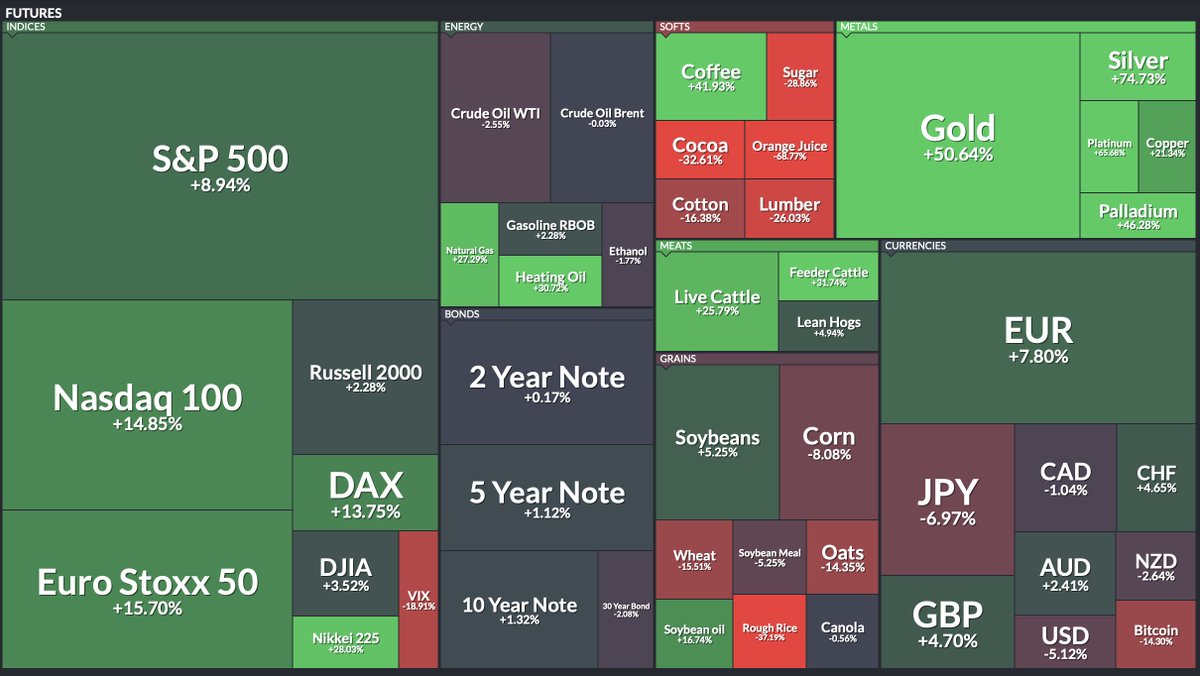
Annual performance shows extreme contrasts across asset classes.
Metals are the clear winners:
Silver +74.7%
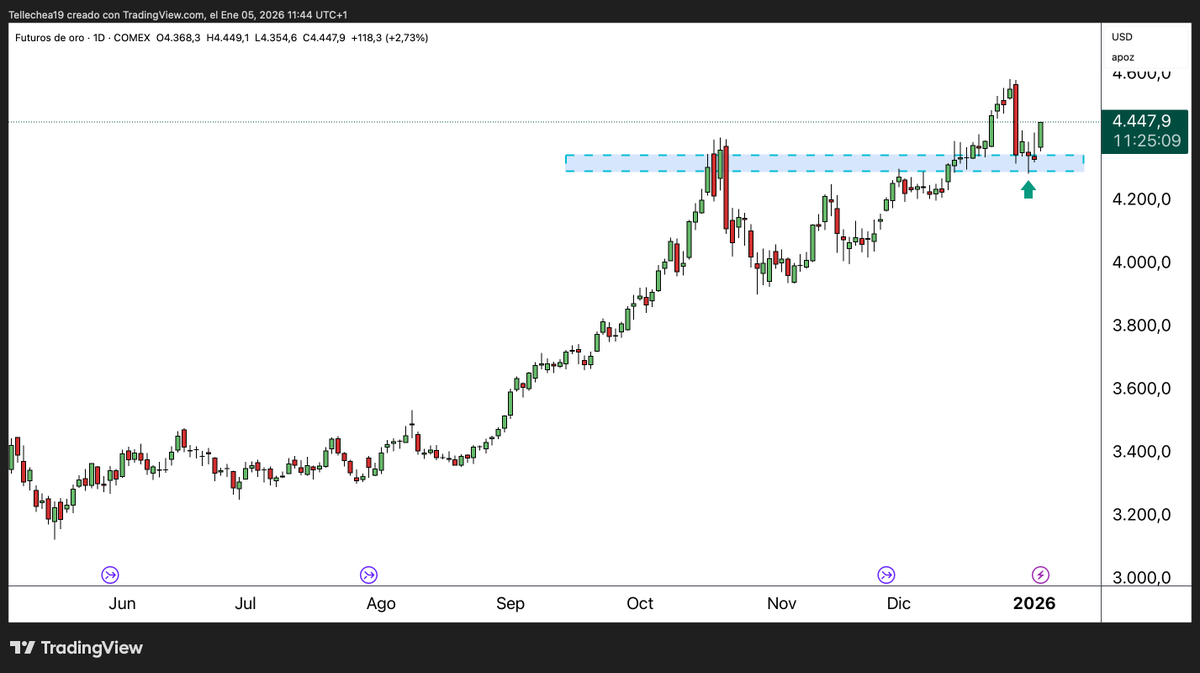
Gold +50.6%
Platinum +65.7%
Palladium +46.3%
Copper +21.5%
The metals complex is having its best collective year in more than a decade.
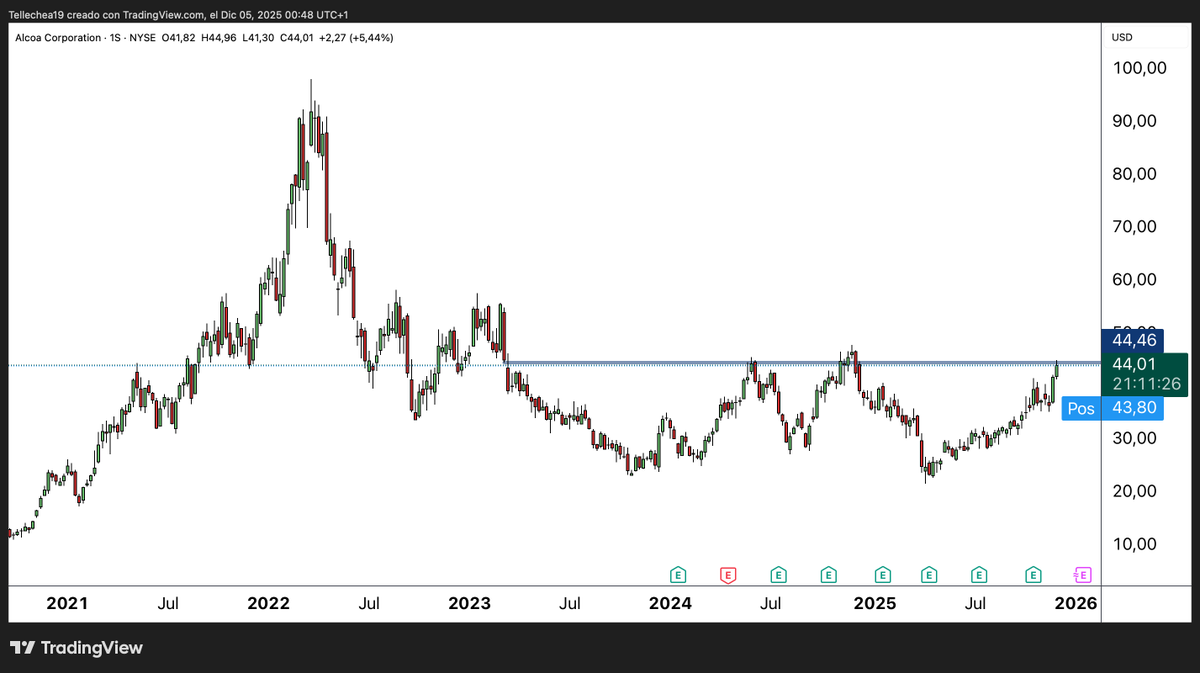
Alcoa ( $AA ) Strengthens in Sync with Aluminum’s Breakout
Aluminum futures have already confirmed a major breakout — and Alcoa (AA) is now pushing toward the $44–47 resistance that has capped the stock since 2023. AA is up +20% in two weeks, hinting at a possible catch-up move.
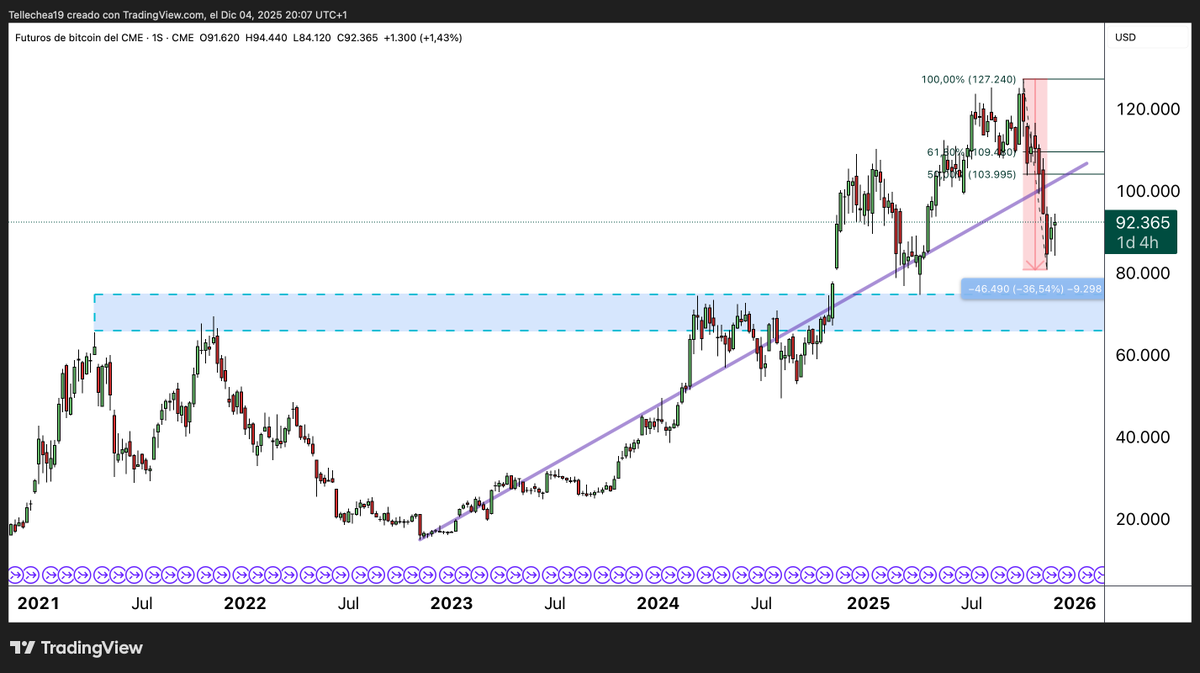
What’s Next for $BTC?
After a +4/5 month rally and a ~40% pullback, BTC is now at a key decision zone.
• Above ~$100–110k → momentum could resume toward new highs.
• Below ~$80-82k → risk of a deeper move toward $74k.
My full Chart Advisor report:👉
https://t.co/6rpVGquvdn
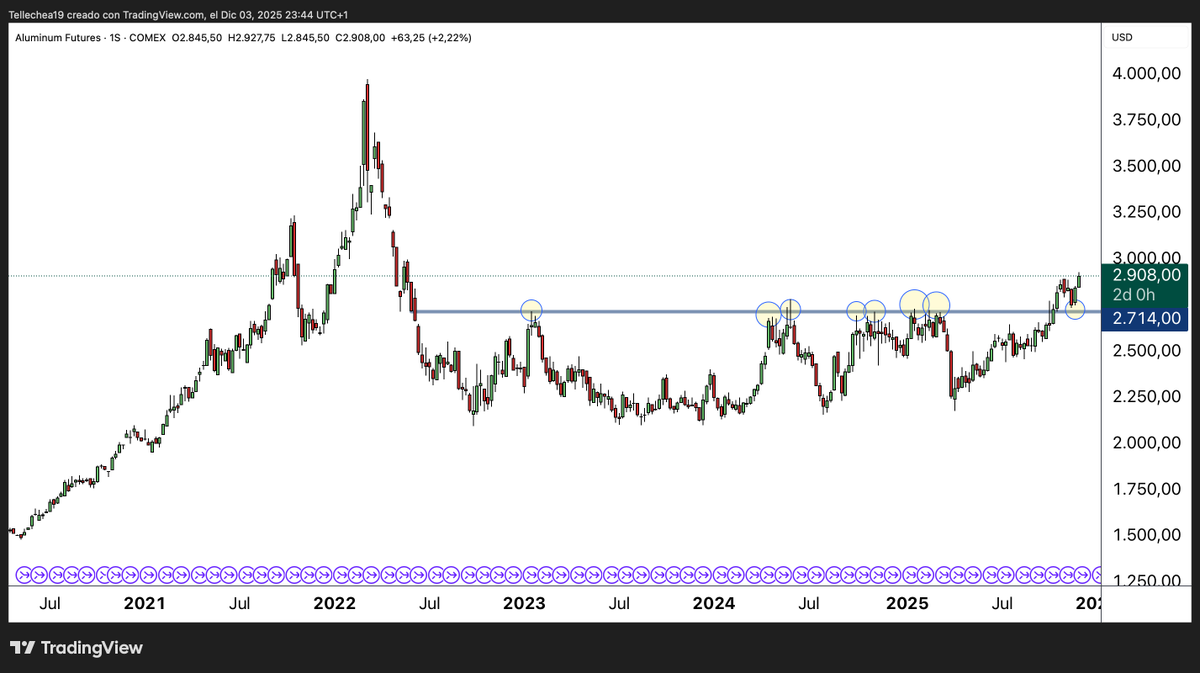
Aluminum hits 3-year highs! LME futures ~$2,900/t as China caps output + green demand (EVs, renewables, construction) surges.
2025 looking at structural supply deficit, but watch macro risks—construction & autos hate slowdowns.
Bullish base case, volatile ride ahead. #Aluminum
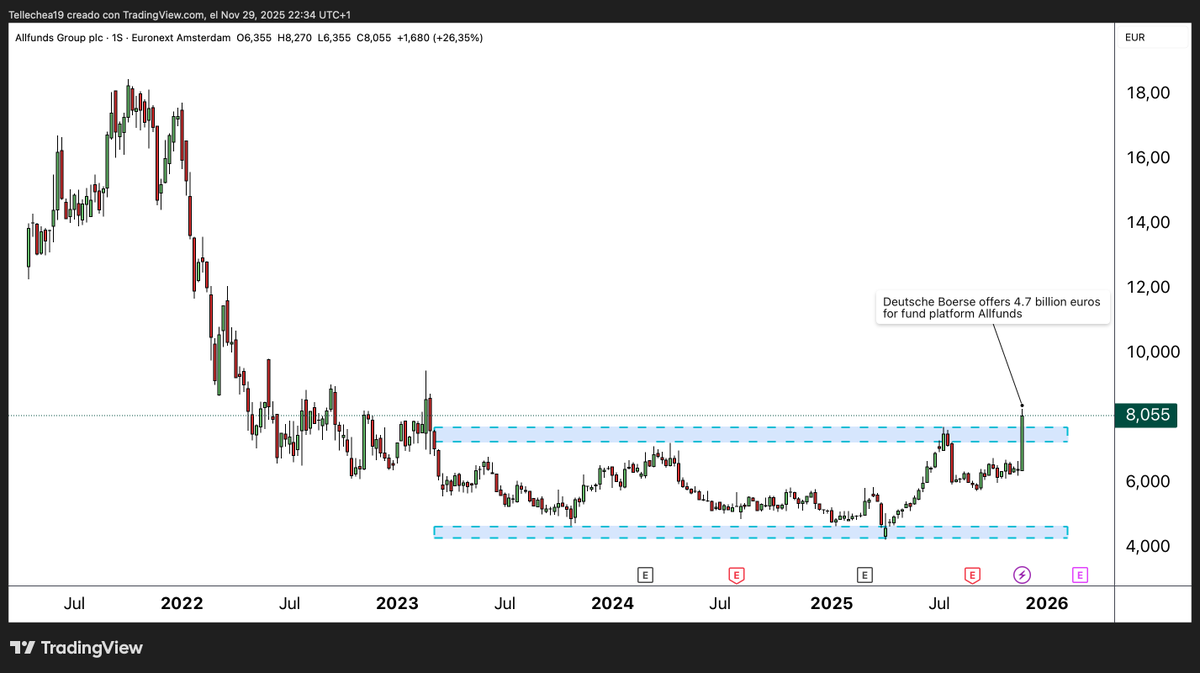
📈 Allfunds Group ( $ALLFG ) breaks out sharply after Deutsche Börse submits a €4.7B offer for the fund-platform operator.
The stock had been consolidating for 2 years in a 4.50–7.00 € range.
A textbook case of corporate catalyst + technical breakout.