That’s a wrap-up for the first Terra Health Day in San Francisco. Hundreds of @ycombinator founders got their morning workout kick with Pickleball games and some pull-ups. @bryan_johnson, the world’s most measured man, then took the stage to speak about the philosophy of longevity: Don’t Die
@lancearmstrong then, in discussion with @kyriakosel, spoke about the early days, the Tour De France, the winning mindset, and the secrets of investing.
More details soon!
“The best founders pattern match on success, not failure - and stay ridiculously, stupidly optimistic.”
@gralston is the former President of @ycombinator, the true internet pioneer with exits to Yahoo and Apple.
He is now running @SAIFVC, since ‘Humanity is running on a tight rope right now’
We discussed:
0:00 Introduction
2:10 Why Silicon Valley celebrates startups
4:45 The single venture deal that created Sand Hill Road
7:55 Startup timing
11:20 The moment he quit HP
16:40 @paulg acquisition framework
26:10 Startups die from suicide
30:50 How to tell if someone is actually better than you
34:20 The day Zuck killed his company in one decision
38:55 The Steve Jobs lesson that still guides him
42:30 The real YC superpower almost nobody talks about
46:40 How far YC can actually scale
54:06 Why AI is more dangerous than people think
01:01:15 Peter Thiel is wrong about competition
01:03:31 Marc Andreessen is wrong about introspection
01:05:18 What he tried to teach his children
Do people actually sleep better alone or together?
Conventional wisdom says having a partner is good for long-term health. In theory a big chunk of that benefit should show up during sleep, our prime recovery window. So I decided to test the hypothesis: Does sharing a bed actually improve sleep and recovery?
I analysed a large dataset of wearable sleep records where users had labeled whether they slept alone or with a partner.
So what did I find…The results were more nuanced than I expected.
• Shared-bed nights showed more awake time (roughly +8-11 minutes) and slightly less total sleep time! I’ll leave it to the reader to hypothesise on this.
• Resting heart rate tended to be lower on shared nights in population views, but RMSSD (HRV) was modestly lower.
• Alone-dominant users showed more stable night-to-night sleep (lower coefficient of variation).
• The patterns held across population, within-person, and lifestyle cohort views, though effect sizes were generally small.
The data suggests that, on average, sleeping alone is associated with better sleep continuity (less awake time, more sleep), while the recovery marker story is mixed.
Of course, this is all observational. There are clear limitations and potential confounders: people who diligently label their sleep data might not be representative, alone nights often happen during travel, and we can’t cleanly separate causation from correlation.
I wouldn’t rush to the spare room just yet. Unless you’re a hardcore recovery optimiser willing to run your own 10+ night experiment (controlling what you can), the data doesn’t scream that sharing a bed is ruining your recovery!
Full research in the comments below
Got a busy week with a few events I’m really looking forward to.
On Wednesday afternoon, I’m speaking at @LBS with Cameron Crawford about my journey into Health Tech research, how we built @TerraAPI Research, the role of AI in automating and scaling our wearable data work, and where we’re deliberately choosing not to use it. Cameron will cover the incredible work he is doing with agents. Link in the comments below to sign up.
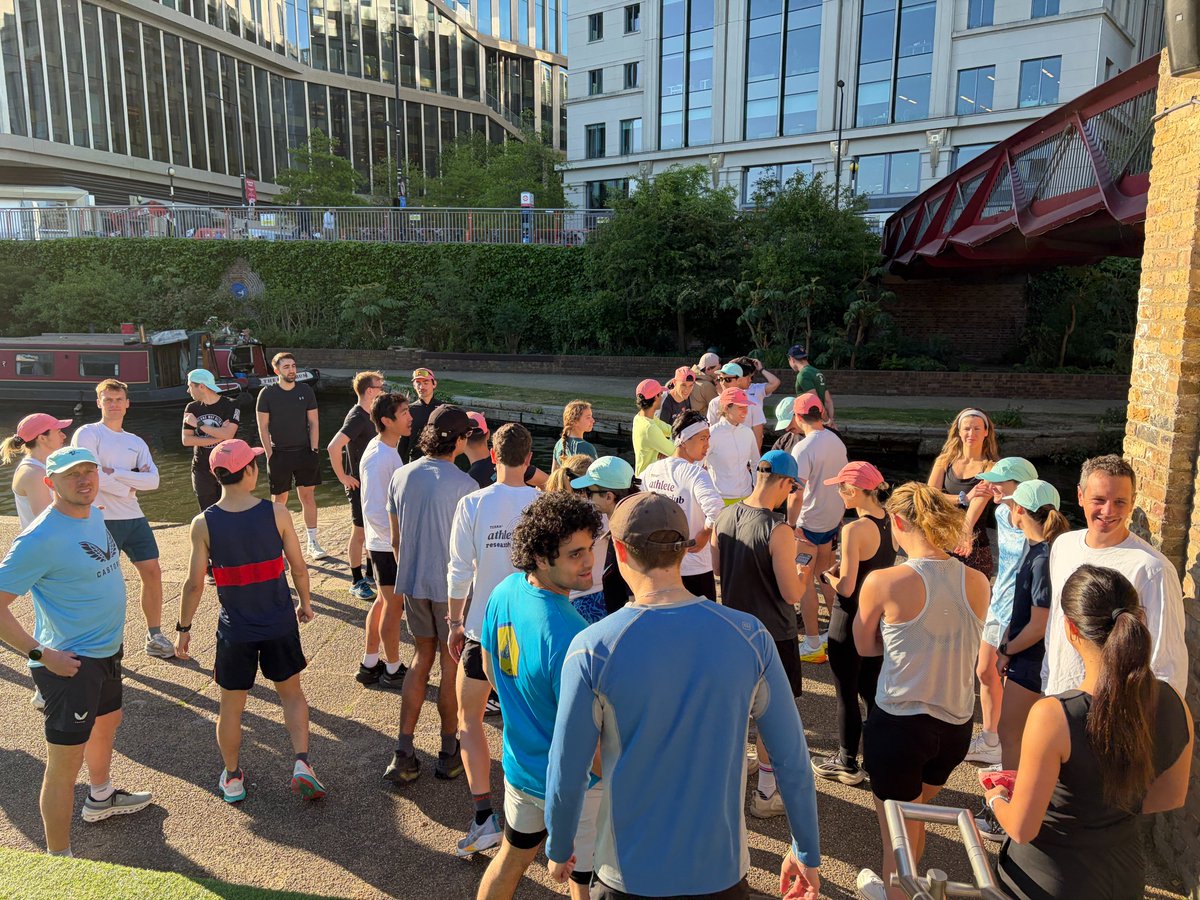
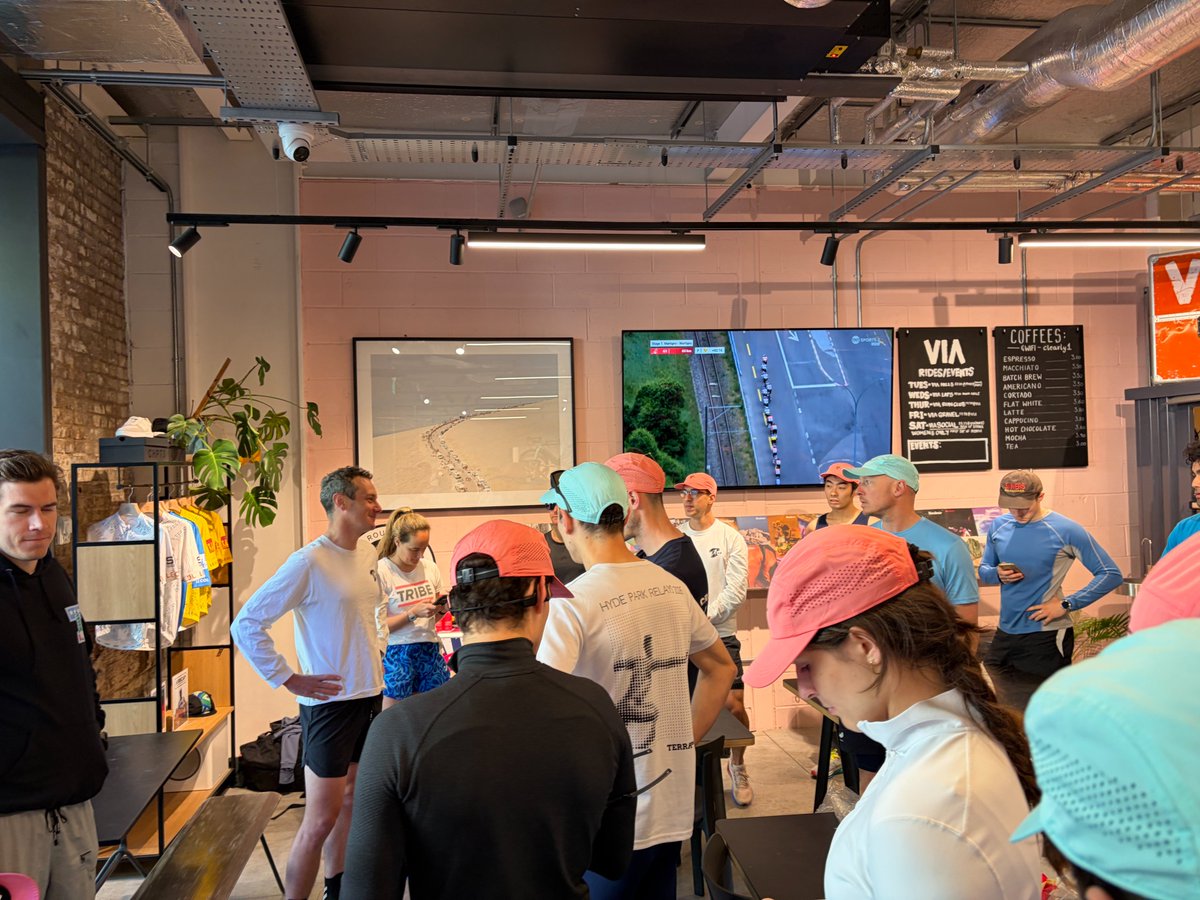
On Thursday morning, I’m hosting the monthly Athlete Research Club Run from Via in Kings Cross. This is easily one of my favourite mornings each month. A relaxed jog (or run!) along the Regent’s Canal while chatting about health, data, tech and performance. Just good conversation with great people, and the chance to get involved in some real-world health research.
We’ve got some fresh merch to give away too: the next 20 people who sign up via the link below and bring a +1 will get one of the new t-shirts.
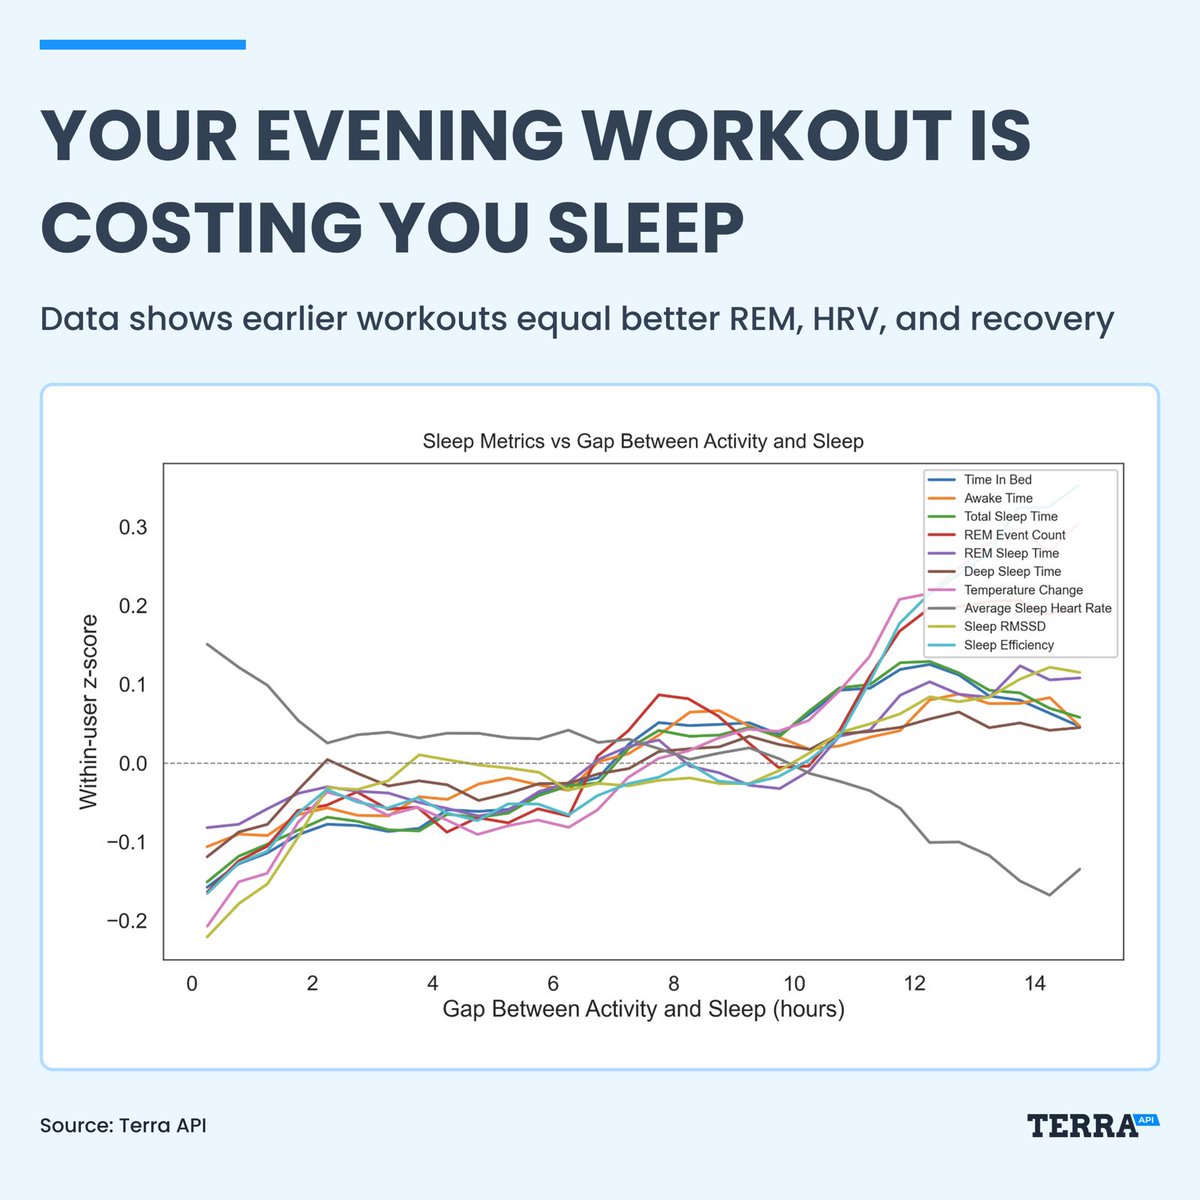
Should you work out in the morning or evening?
We studied over 100,000+ workout sessions against sleep to give you the answer
The later you train, the worse you recover
Exercising closer to bedtime means higher sleep heart rate, lower HRV, and fewer REM events
The benefits plateau around 10 hours - the sweet spot is an 11-14 hour gap between workout and bedtime
Time awake in bed drops with later workouts, but that's not better sleep - it's just falling asleep faster while recovering less
Does watching the pros race actually get us off the sofa and onto our bikes?
I have to declare a bias up front here; I desperately want it to! From the Monuments to the Tour de France, I’ve always felt that professional cycling inspires amateurs to ride more. I was the kid that was inspired by watching the best and London 2012 coming to the UK. I saw my training routes in Yorkshire get busy with cyclists afterward. Of course I want the data to back it up.
So I dug into activities from six European countries (UK, Germany, France, Italy, Spain, Belgium) across 2023–2024. I compared outdoor cycling on event weekends vs. normal weekends, using running/walking/hiking as a control to isolate the effect.
Key findings:
• Tour de France: Massive cycling-specific uplifts in Germany (+50.5%), France (+39.4%), Italy (+33.7%), and Belgium (+17.9%). All statistically significant, with controls flat or down.
• Classics/Monuments: Strong signals in Italy (+18.9% pooled) and standout days like Paris-Roubaix in France (+105% cycling while controls dipped).
• Rolling averages and post-event windows show the inspiration lingers, people watch, then ride.
• New/returning cyclists start 27% more than expected on event days.
Spoiler. Even though the figures are good here, the data doesn’t “prove” inspiration (we can’t demonstrate causality, weather and sample size matter), but the patterns are compelling, especially in cycling heartlands.
Full analysis in the comments below
This is an area I want to do more work on, so if you’ve got any clever ideas of how to approach this question with data please let me know.. What’s your experience? Do you ride more when the Tour is on?
#Cycling #TourDeFrance #SportsInspiration #DataDriven
@TerraAPI
We analyzed 130,000+ nights of sleep - earlier bedtimes drive dream recall more than anything else
Going to bed earlier than your own baseline was the strongest predictor of remembering dreams
Dreams followed the laziest days, not the hardest ones - rest time the day before was roughly 5x larger than any other day-level factor
Dream recall nights had less deep sleep, more light sleep, and more time awake
REM duration and total sleep time did not show a clean linear trend once bedtime was controlled for
Dreaming rearranges sleep architecture, but HRV stays flat
Dream recall looks more like fragmented sleep than restorative sleep
"Any fool can make something complicated. It is hard to keep things simple.”Richard Branson
I’ve always loved that line. But this one from Rutger Bregman might be even more relevant to endurance training:
“It’s easy to make things hard, but hard to make things easy.”
I think this principle applies perfectly to both training and how we analyse training.
In this week’s analysis, I looked for simple, effective answers to two key questions:
1. Is there a simple way to measure someone’s running fitness?
2. Is there a simple training approach that actually works?
To answer question 1. I looked at a very simple approach: track the pace an athlete runs at specific heart rates across multiple sessions and plot the curve. If that curve shifts right over time, fitness is improving. Then identify which training methods create the biggest positive shifts.
I’ll be diving deeper into this in future posts using a novel approach for standardised performance testing.
What’s your take? Do we overcomplicate endurance training?
Full research in the comments below
@TerraAPI
#RunningScience #Simplicity
David Lee (@davidlee) was diagnosed with stage 4 lymphoma at 25 - and didn't let it stop him. He went on to early Google, made partner at SV Angel during the Airbnb / Twitter / Dropbox / Snapchat era, and now runs @SamsungNext, Samsung's global venture fund.
His take: digital health still hasn't had its "reusable rocket" moment. The puncture in the equilibrium that pulls everything forward by 5 years.
He makes the case for why the NFL gets the #1 draft pick wrong half the time and what that means for picking founders, why most professional athletes are scared in the big games, and the "red zone of intelligence" he believes AI will never touch - the 20 yards where taste, judgment, and reading the room still belong to humans.
What I'll remember most is his line on leadership: "Your kids will never do what you tell them. They'll always copy what you do." He uses the same lens on Jensen Huang, Elon Musk, and every founder he backs - what do they actually do on a Saturday.
Enjoy.
00:00 Intro
02:30 Why digital health hasn't had its "reusable rocket"
07:00 "Law school is coding for your mind"
11:00 Telling Yo-Yo Ma from a college cellist
14:00 The NFL gets the #1 pick wrong 50% of the time
16:30 Most pro athletes are scared in big games
19:30 Without a killer product, you have no strategy
22:00 Vanity beats health
29:00 Your kids copy what you do, not what you say
32:30 Jensen, Saturdays, and setting the tone
37:30 The "red zone of intelligence" AI will never touch
38:30 Why the great fitness instructor gets paid more in the AI era
40:30 Why VC is the wrong financing model for the next decade
41:30 Mike Ovitz, CAA, and the playbook for winning in AI
Yesterday in London, two men ran under the two-hour marathon. Sawe in 1:59:30, Kejelcha in 1:59:41. A barrier that has stood for decades, gone.
None of their watch data is on Terra. But 571 other runners on the same streets are, and their data turned up something I wasn't expecting.
The spread of the field alone is fascinating. Finish times ranged from sub-2:12 to nearly 7 hours. Heart rates told a counterintuitive story too: sub-3 runners averaged 167 bpm for the entire race, while six-hour finishers averaged 154.
But the calorie data is what really jumped out. Garmin and Coros watches agreed on heart rate. They agreed on distance. They disagreed on calories by 12% at the median, and the gap got much worse for slower runners.
Here's the part that I think matters: kcal/km should be roughly flat across finish-time bands on the same course on the same day. The fact that one device produces a flat line and the other produces a steep one is a self-contained plausibility check on the calorie algorithm.
Calories from a watch are a model output, not a measurement, and the slower you run, the further the model can drift from physiology.
This is exactly the kind of question we're tackling at the Terra Research Run Club this Thursday, built to advance our understanding of wearable data in the real world, and ask how well our watches actually capture what's happening.
Link for the Research and Run club below
@TerraAPI
Happy birthday to the GOAT @AliBrownleetri 🎂
He spent it settling the argument every endurance athlete has had:
Which sport is actually the hardest, according to the research team — across 9 sports and ~1M sessions.
Now covered by @Olympics 👇
It is my birthday today, so I allowed myself a completely self‑indulgent data analysis.
I have had the “what is the hardest endurance sport” argument in so many changing rooms and cafes that I lost count years ago. Swimming feels psychologically hardest for me. Cycling feels highest risk. Running just feels brutally honest.
So this time I tried to answer it with data.
I pulled nearly a million sessions across nine endurance sports and looked at what each one does to the cardiovascular system, both per minute and per session.
Here is what I found:
- Every sport has a distinct heart‑rate “fingerprint”. Running is a tight, right‑shifted bell around 145 bpm. Walking and ski touring sit broader and lower. Downhill skiing is all peaks and troughs.
- Running really is hard on the heart. It has the highest session average, peak HR, and sustained intensity ratio.
- Walking’s “high” intensity ratio is a statistical trick. Low average, low peak, very flat sessions that only look hard on paper.
- Downhill skiing has the biggest swings. Peaks rival outdoor cycling, but average HR sits near walking. That 47 bpm gap matches the feeling of short bursts and a lot of standing around.
- Cross‑country skiing behaves like running at the top end and like cycling on average. Huge peaks, long gliding recoveries.
- Indoor cycling is the purest steady effort after running. The sustained profile is similar in relative terms, but the absolute load is lower because seated cycling simply costs less than weight‑bearing running.
Within the same person, running still wins. Among 1,480 people who both run and ride outside, 93% hit a higher fraction of their personal max HR when they run. Same body, same heart, different biomechanical demand.
Then I changed the question. Because intensity is only part of the story and I recently cycled for 35 hours at a low Heart Rate, but it certainly felt pretty hard!
Do you want to reward time on feet, or time in the red zone?
Full research below.
A couple of years ago, I was walking through Salesforce Park in SF with @AliBrownleetri, talking about something surprisingly frustrating: how little usable data exists in health research.
That conversation sparked an idea - what if we built an internal team focused on cutting through the noise and open-sourcing the most useful insights on physiology, exercise, and supplementation?
Fast forward, the team grew significantly, and we have released some of the most interesting insights across the industry:
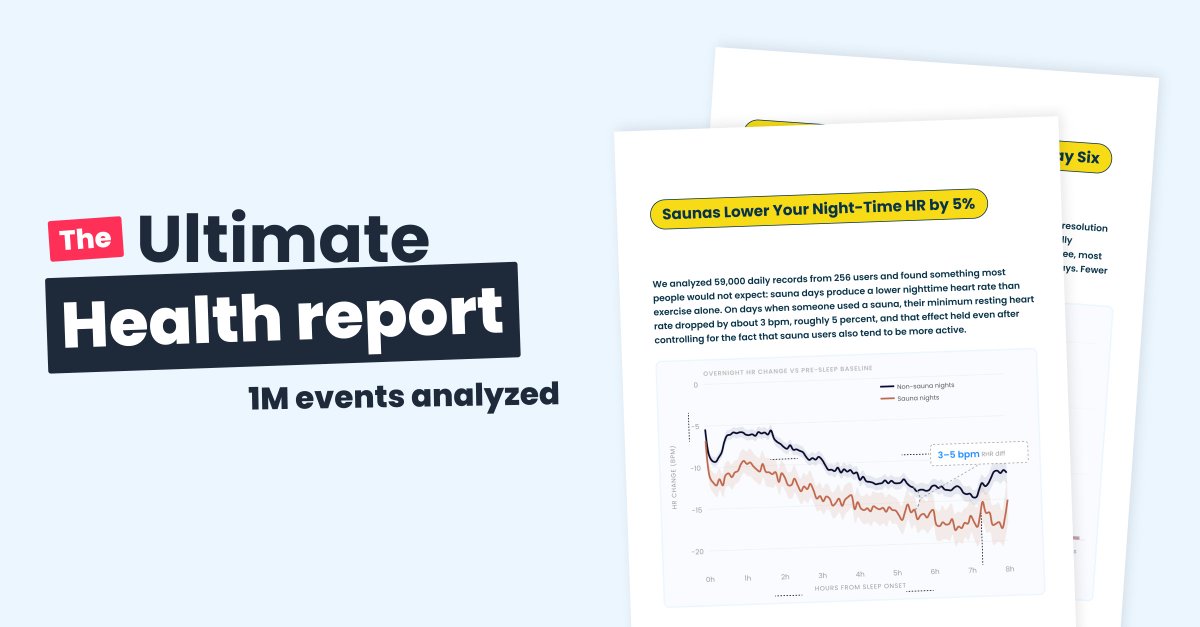
- Saunas can lower nighttime heart rate by ~5%
- Melatonin impacts heart rate more than actual sleep quality
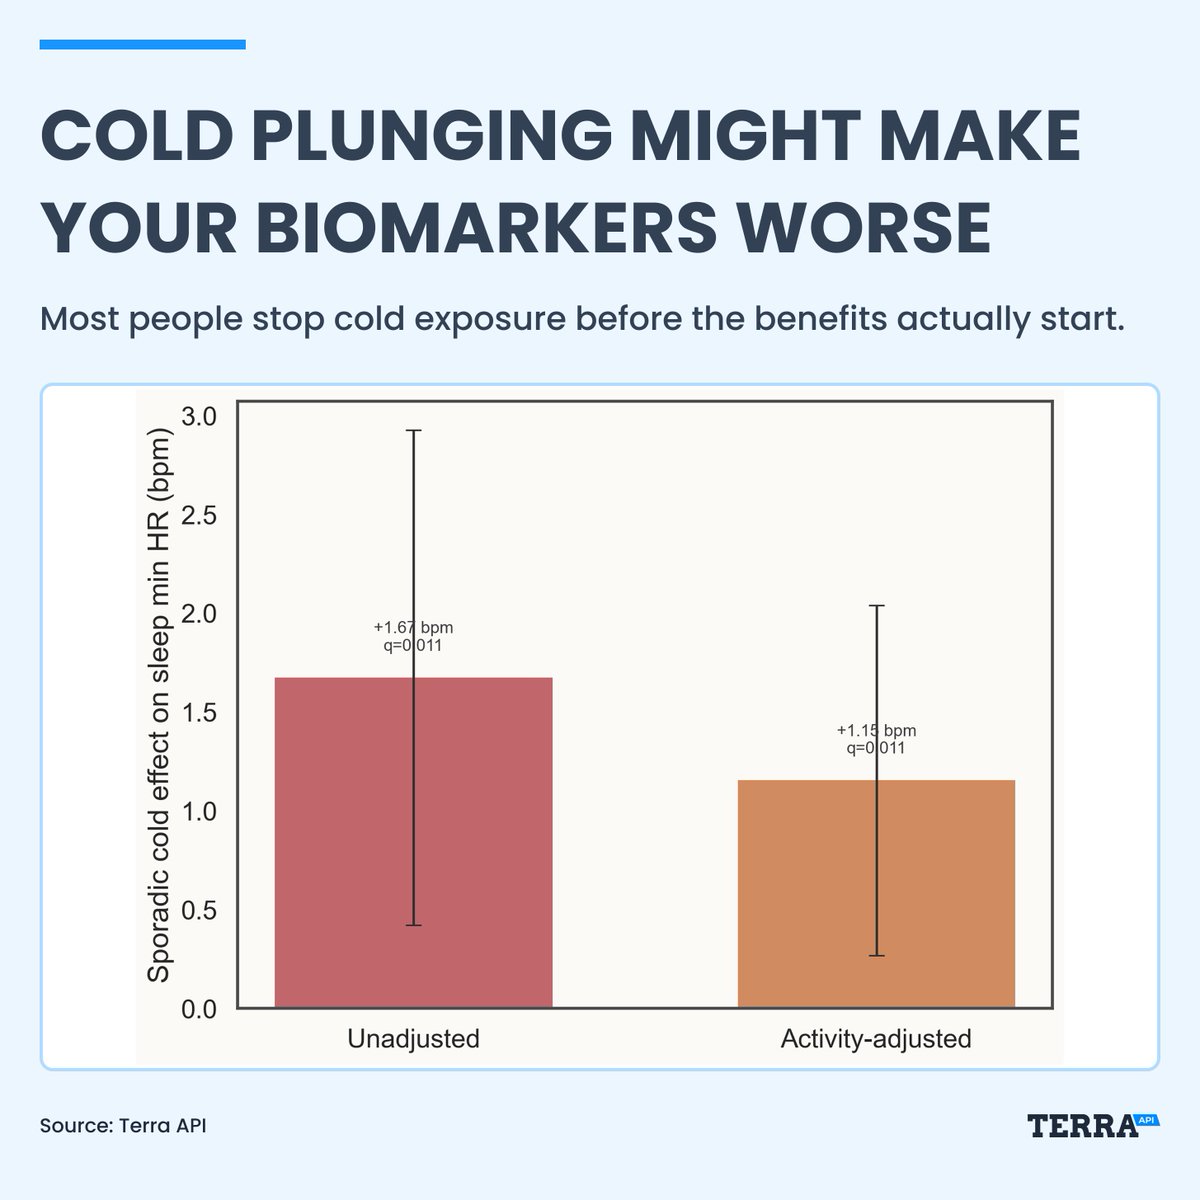
- Cold plunges show measurable effects on key biomarkers
- Where you live may influence your sleep more than your habits
- Alcohol’s impact on sleep is more nuanced than most think
Today, we’re releasing our latest quarterly findings in a comprehensive report
We studied 170,000 days of cold plunge - it's a stressor until you adapt; the threshold is 3 sessions in 14 days
Below that, sleep heart rate goes up by about 1 bpm, consistent with an acute sympathetic response
Above it, recovery score improves by 1.33, sleep score by 1.01, and daily heart rate drops by nearly 1 bpm
Combining sauna and cold gives the highest recovery composite, but sauna alone gets you most of the way there
In women, cold exposure during the luteal phase raises sleep heart rate by 1.68 bpm even with frequent use - the follicular phase shows no effect
Adaptation is the whole story
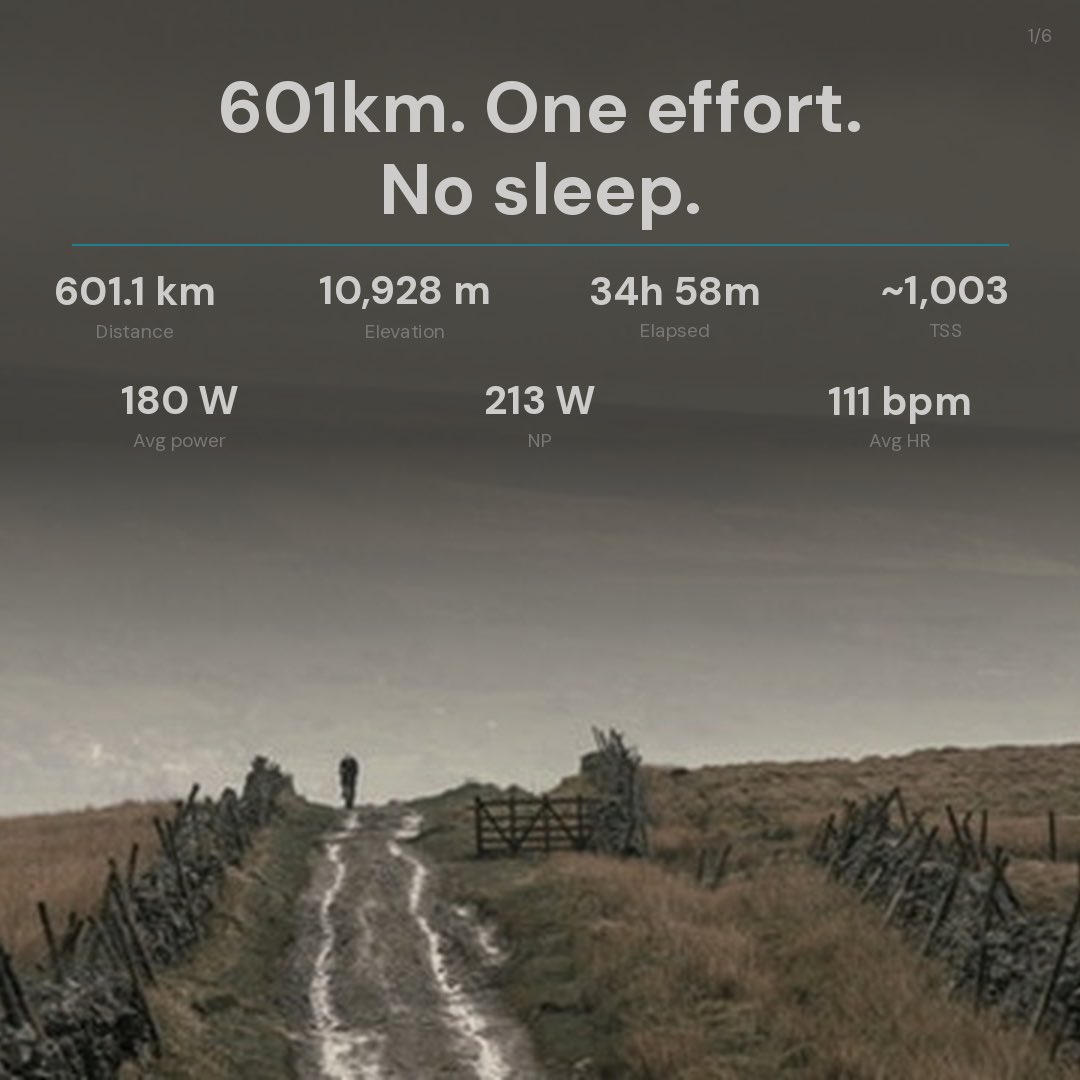
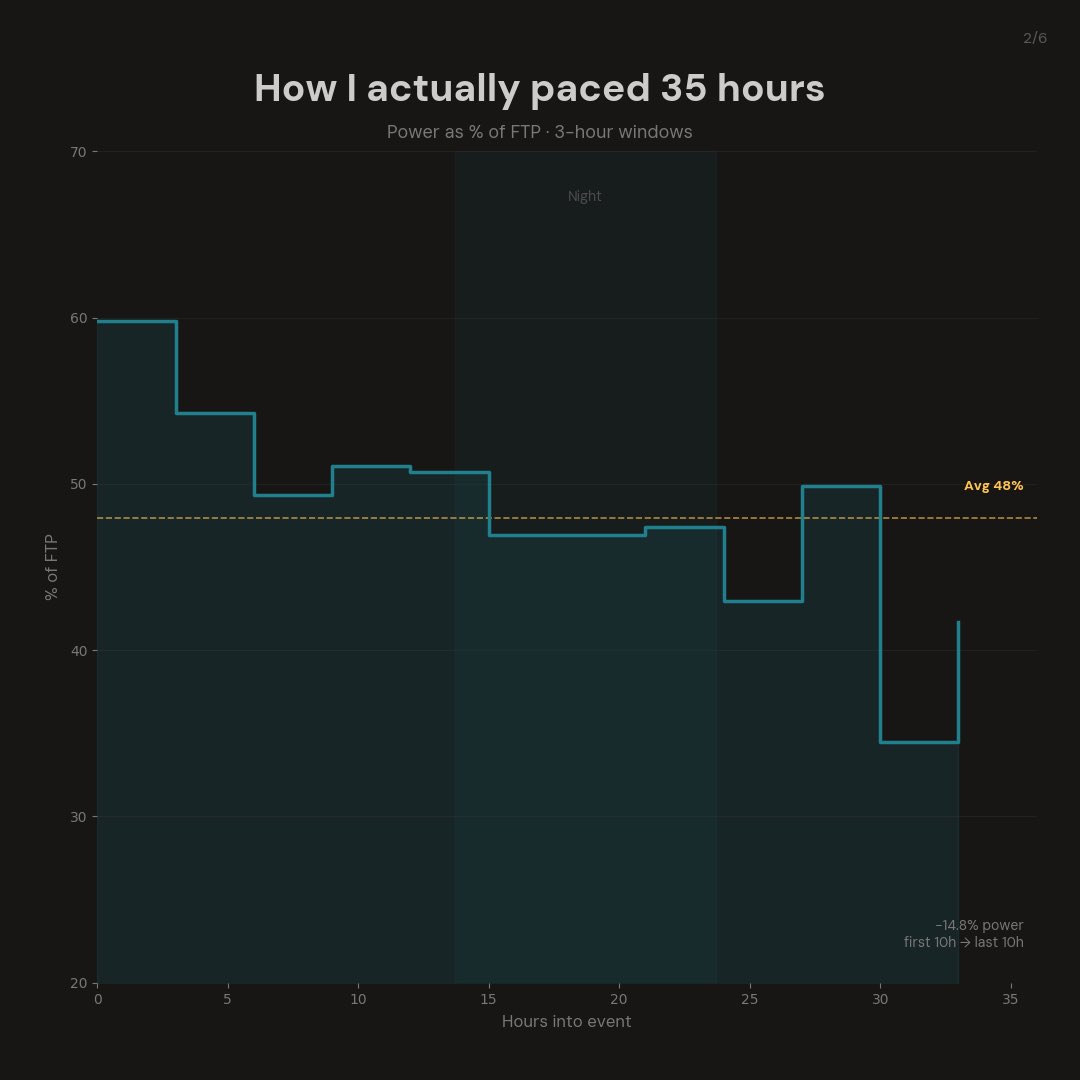
601 km. 35 hours. No sleep.
I’ve spent the last few days digging into the data from last week’s ride, and a few things really surprised me.
My heart rate at the same power output dropped 15 bpm from early to late in the effort