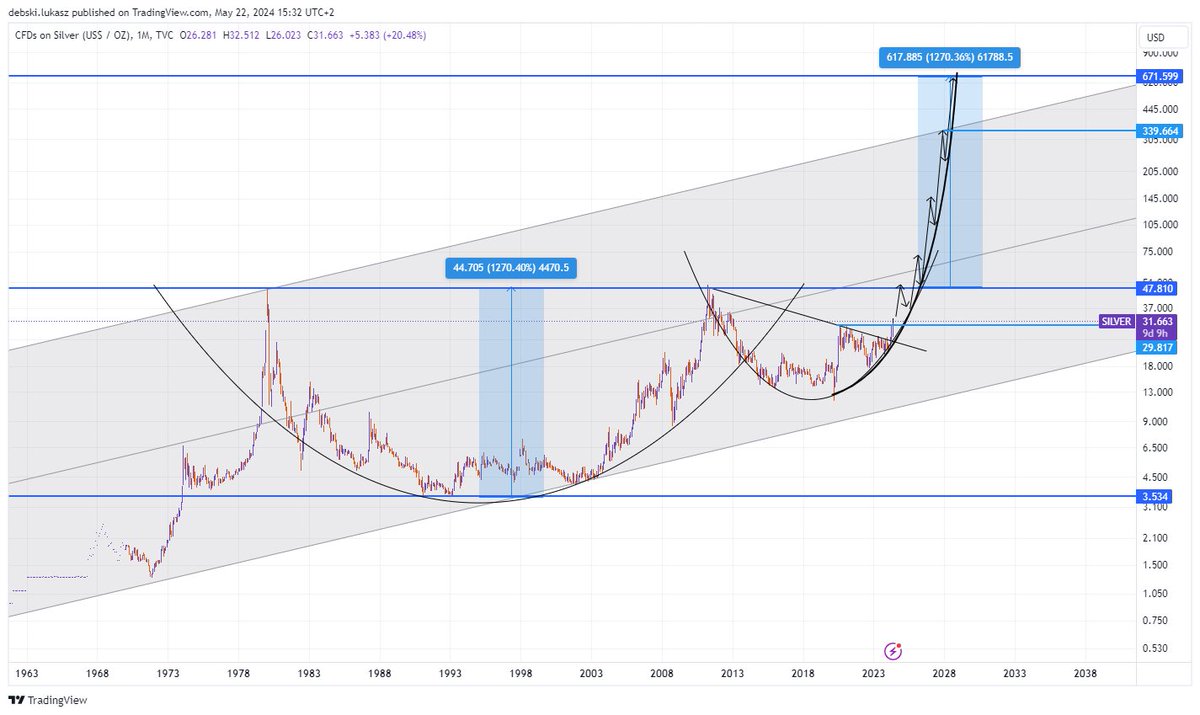
My forecast for #Silver price in this bull run. This is optimistic scenario with at $340 target in early 2028 and possible blow off top at around $670 at the end of 2028. Price will be moving on this parabola which is simply an extension of the massive 44 year old cup and handle.
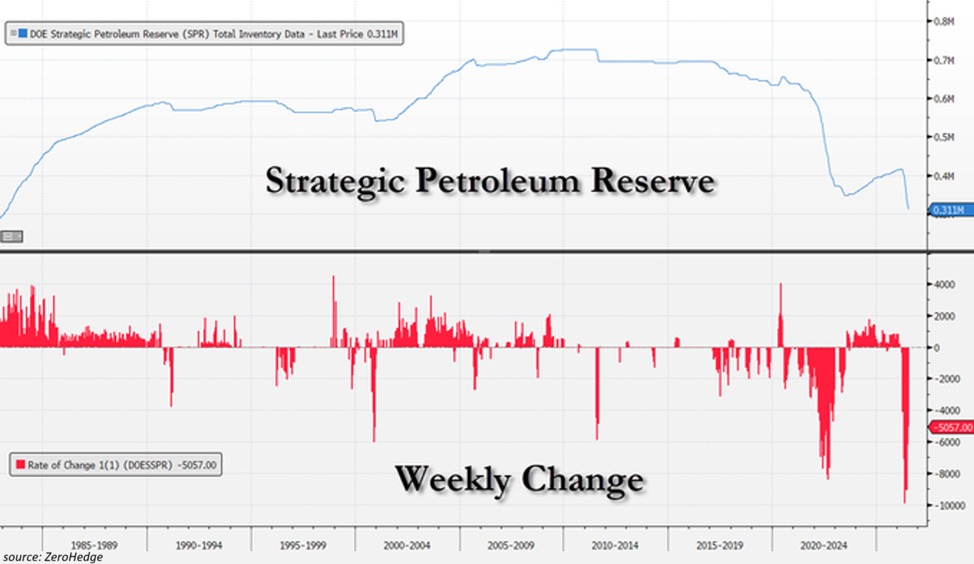
BREAKING: The Strategic Petroleum Reserve (SPR) fell -3.8 million barrels last week, to 308 million barrels, the lowest since March 1983.
This marks the 18th consecutive weekly decline, the longest since 2023, per Zerohedge.
During this period, US oil reserves in the SPR have fallen -108 million barrels, or -26%.
Meanwhile, commercial crude oil stocks excluding the SPR dropped -7.2 million barrels, to 405 million barrels, the lowest since October 2018.
This is also ~7% below the 5-year average for this time of the year.
America's oil buffer is evaporating.
🇪🇸 UNBELIEVABLE SCENES out of CEUTA!
Spain’s Civil Guard chief just admitted the border has completely collapsed.
Thousands of military-aged African men flooded across in a matter of hours, immediately after the government offered amnesty to illegals.
Amnesty is a magnet. The message goes out, and the flood begins.
Every country that does this ends up in the same place.
Writer: Oliver
$CL_F #Oil
The Houthis now claim attacks on two Saudi oil tankers in the Red Sea, with one confirmed hit and set ablaze.
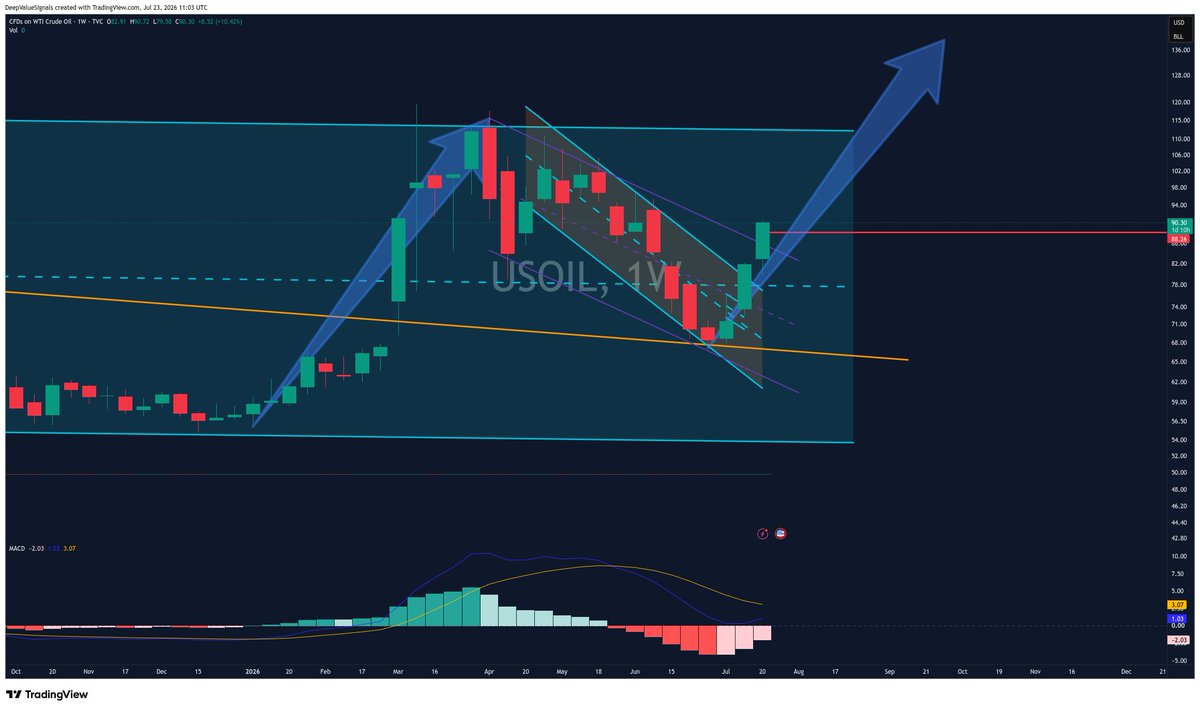
The headlines explain the acceleration. The structure was already forecasting the move.
A confirmed weekly breakout here puts the measured move toward $135–140 oil firmly in play. One step at a time.
@DVSignals I think there is a risk of even more escalation in Iran which would bring down equities and precious metals in the short term. Therefore we would see another leg down.
$USOIL $CL / $XOP
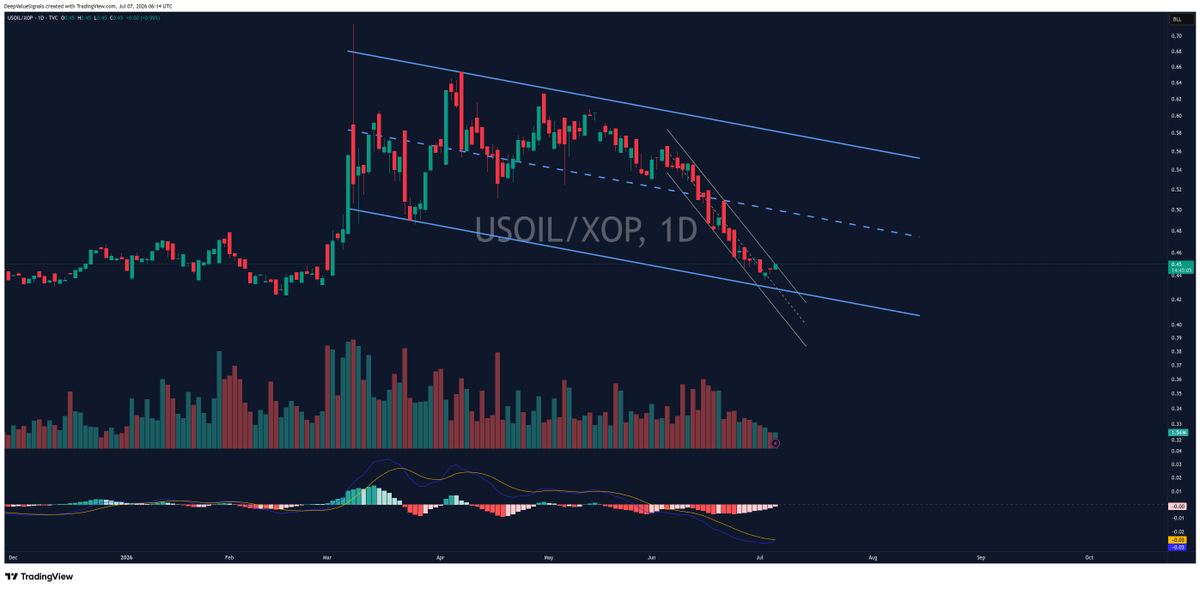
Oil has had a rough couple of weeks versus $XOP. For context: $XOP is the oil & gas producers ETF, so this ratio basically shows crude oil versus the producers...
After that sharp drop, the ratio is now starting to curl up right at the lower part of the structure. A breakout here would be notable. It would suggest oil is starting to outperform producers again after weeks of relative weakness.
Not confirmed yet, but this chart is getting VERY interesting...
$Silver
If you’re a silver bull, this is not the level you want to see break.
The key daily area is roughly 62.50–63.00.
Lose that cleanly, and the dreaded 54–56 zone opens up fast.
Still a long-term bull but tactically this is the line that needs to hold.
@DVSignals What if this is the type of situation where you sell the news in #Oil but buy the facts?
Opposite to stock market where people buy the news and sell the facts.
$CL $BNO $USO
The irony here is that most people are selling #oil right into what may be the bottom.
This is usually where you should be looking to buy, not panic out.
If it breaks down, fine; that’s what stops are for.
But from a risk/reward perspective, this is exactly the kind of zone where the upside can be large and the downside is clearly defined.
$CL #Oil
Oil is testing extremes here...
Messy chart, but the multi-month channel is still holding for now.
The key zone for me is 82–83.
A wick into that area is fine.
A clean loss of 81–82 and the bullish read gets much harder to defend...
For now: support is being tested, not broken.
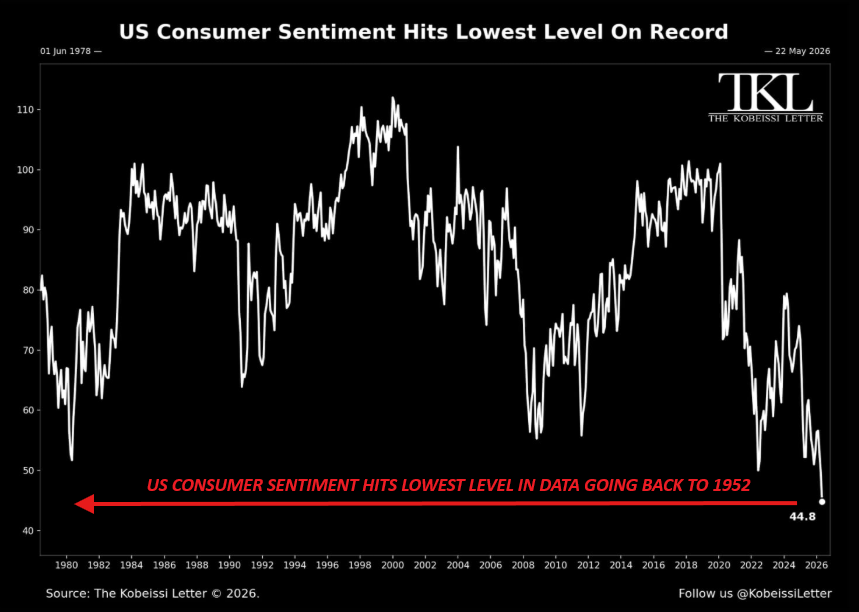
BREAKING: US Consumer Sentiment officially falls to its lowest level on record in data going back to 1952, down another -10% last month.
Consumers now see inflation rising to 4.8% over the next 12 months.
This puts the Consumer Sentiment index down -21% since February 2026, before the Iran War.
Not even the 1980s saw Consumer Sentiment this low.
@NorthstarCharts If the upper rail work as resistance then 32k for Nasdaq is possible top. But for now it is difficult to predict, because blow-oof tops are difficult to catch.
$SILVER: probably the single most important chart analysis to read this weekend.
If you want a balanced read, keep reading...
This is exactly why I push back on the simplistic “trendline break = fresh breakout” view
On silver, I see many drawing a very straightforward line across the highs on a linear/log chart, pointing to the recent move through it, and calling it confirmation. That is far too simplistic. A break of one line, by itself, does not imply a fresh impulsive breakout. It needs far more rigorous analysis, cross-checking structure, momentum, Fibonacci, relative strength, miner confirmation, and broader context.
For those who have followed me for a while: you know I am generally NOT an Elliott Wave guy. But on this specific chart, I do think it offers a useful framework to explain both the structure and the psychology. Not because it is some perfect science, but because it can help simplify what the market may be doing here.
The basic idea is straightforward: wave 1 down, wave 2 bounce, wave 3 down, wave 4 bounce, wave 5 down.
And right now, what silver appears to be doing is behaving much more like a wave 4 than the start of some powerful new leg higher.
That matters, because wave 3 is usually the brutal recognition phase. That is when the market starts to accept that the prior uptrend is damaged. The move gets sharper, confidence gets hit, and price starts doing real technical damage. We saw that.
Then comes wave 4, the false-hope phase.. It tends to be choppy, overlapping, frustrating, and just constructive enough to pull people back in. It often looks better on surface-level analysis than it really is. That fits very well with what I think we are seeing now: a recovery that looks encouraging to many, but structurally still carries bear-flag / corrective bounce characteristics.
That is also very similar to the earlier phase (wave 2) where I said: be careful. Same near 89. That got pushback too. Yet those caution calls mattered. And this broader framework is also part of how I was able to lean constructive again closer to 61...
Now look at where we are: this bounce has pushed into the 0.618 Fibonacci retrace, and we are now bear flagging. On the more zoomed-in charts, silver actually looks vulnerable, not strong, contrary to popular belief. Miners are not really confirming in the way I would want to see for a genuine breakout. And the recent move in GSR still looks more like a fake move than a resolved shift.
So my primary view, until proven otherwise, remains that this is still a corrective advance inside a damaged structure.
For that to change, I would want to see a clean push above 80, with the current bear-pattern break sitting closer to 81.50, and real acceptance there not just a wick through it. Friday’s breakdown was severe enough that one brief poke higher does not suddenly repair the chart..
So, long story short: I am not dismissing the possibility that silver can recover further. But I am also not going to pretend that a simple line break on a basic chart suddenly means the all-clear has been given. Right now, the wave 4 psychology fits: enough bounce to create hope, not enough evidence yet to prove that the broader bearish structure is gone.
And if this really is wave 4, then wave 5; the final flush, the final disappointment, the move that catches late bulls leaning the wrong way, may still be missing.
RT and share if this gave you value. These free posts take enormous amounts of time to produce...
$SILVER
This is exactly how people get trapped: bullish narrative, lagging indicators, and a chart that still has unresolved bearish structure written all over it...