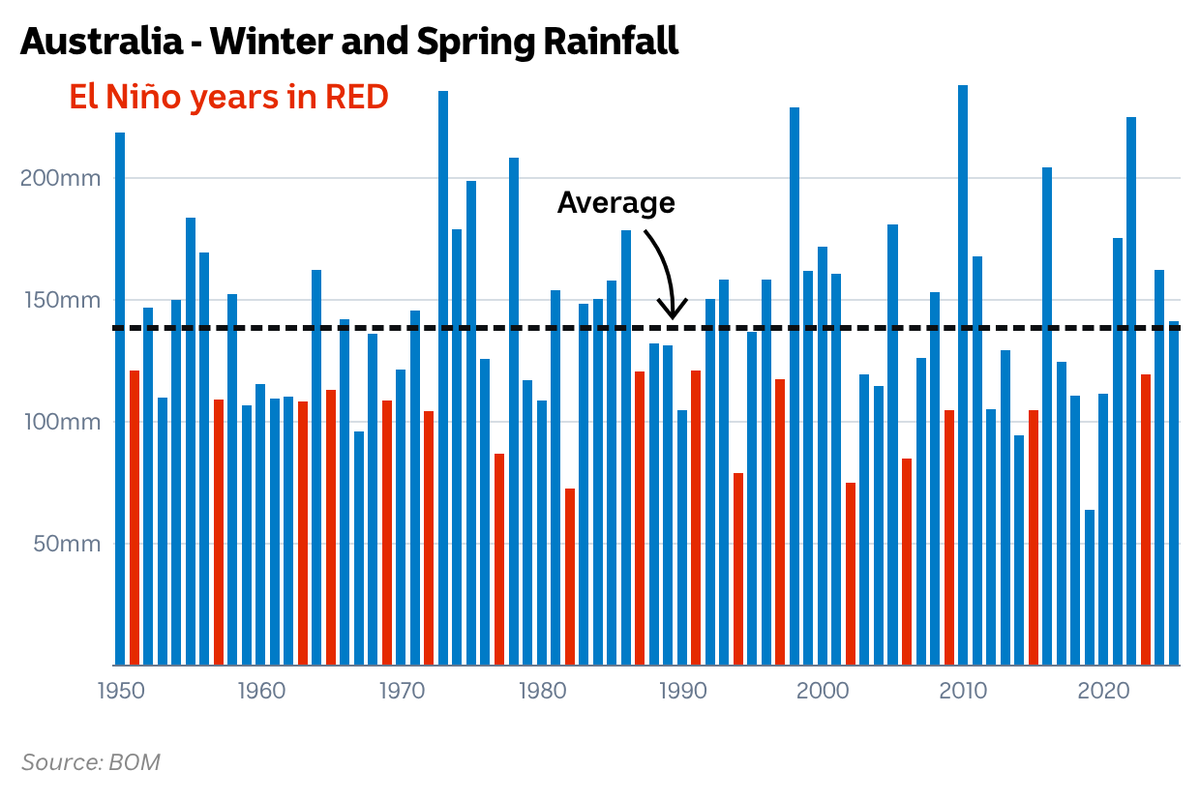
Here's an illuminating way to view #ElNiño's impact on Australia's winter-spring rain. Not one single El Niño since 1950 has been wetter than average on a national scale. Locally though there is a much greater variability.
@GraemeStoneham Im not understanding. That chart is factual, using the BOMs rainfall data. It's not trying to diminish or even comment on previous droughts.
@gsandral Hi Graeme
1) Yes it has an impact. early developing El Nino's like 1957 and 1972 had a dry autumn in southern states. You don't get them forming in summer though.
2) Nationwide its nearly 100% no matter when it forms - but locally a wet El Nino is possible
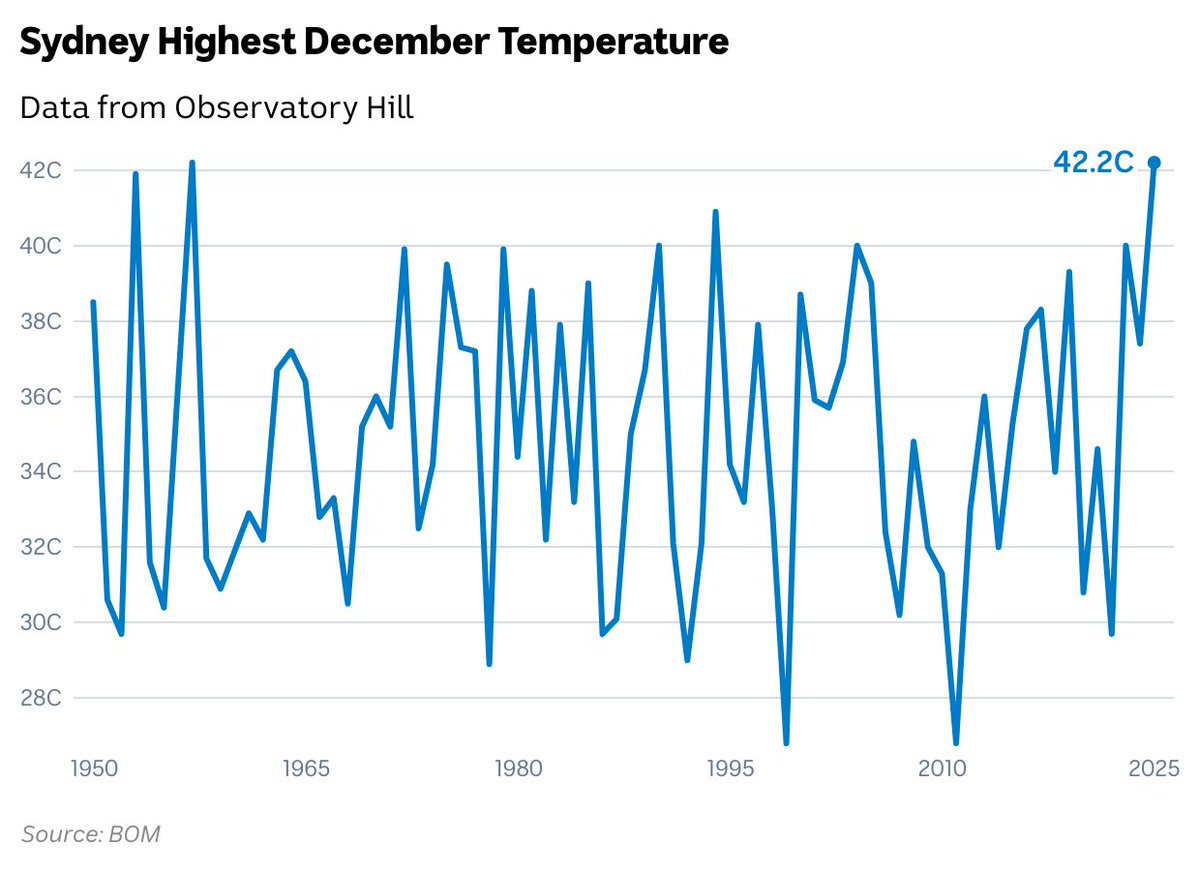
Graph I showed on ABC News last night to put last week's record cold March temperatures in perspective. From January 2025 to February 2026, 446 hot records were set in NSW, compared to 80 cold records.
#CycloneNarelle's near 2 week journey is almost over. It will become the first Australian cyclone in 21 years to make landfalls in QLD, the NT and WA. Please excuse the slight error in category over the Top End and Kimberley.
Mesovortex is visible within the eye of #CycloneNarelle. Only the strongest storms exhibit this feature. Image from the JMA target satellite. #Queensland#Narelle
@bowtiedstocks How weather impacts people is significantly influenced by acclimatisation. This is well researched and its why the BOM's heatwave forecasts (even without factoring in humidity) are so complex. Eg Hobart reaches heatwave thresholds at much lower temperatures than Tennant Creek.
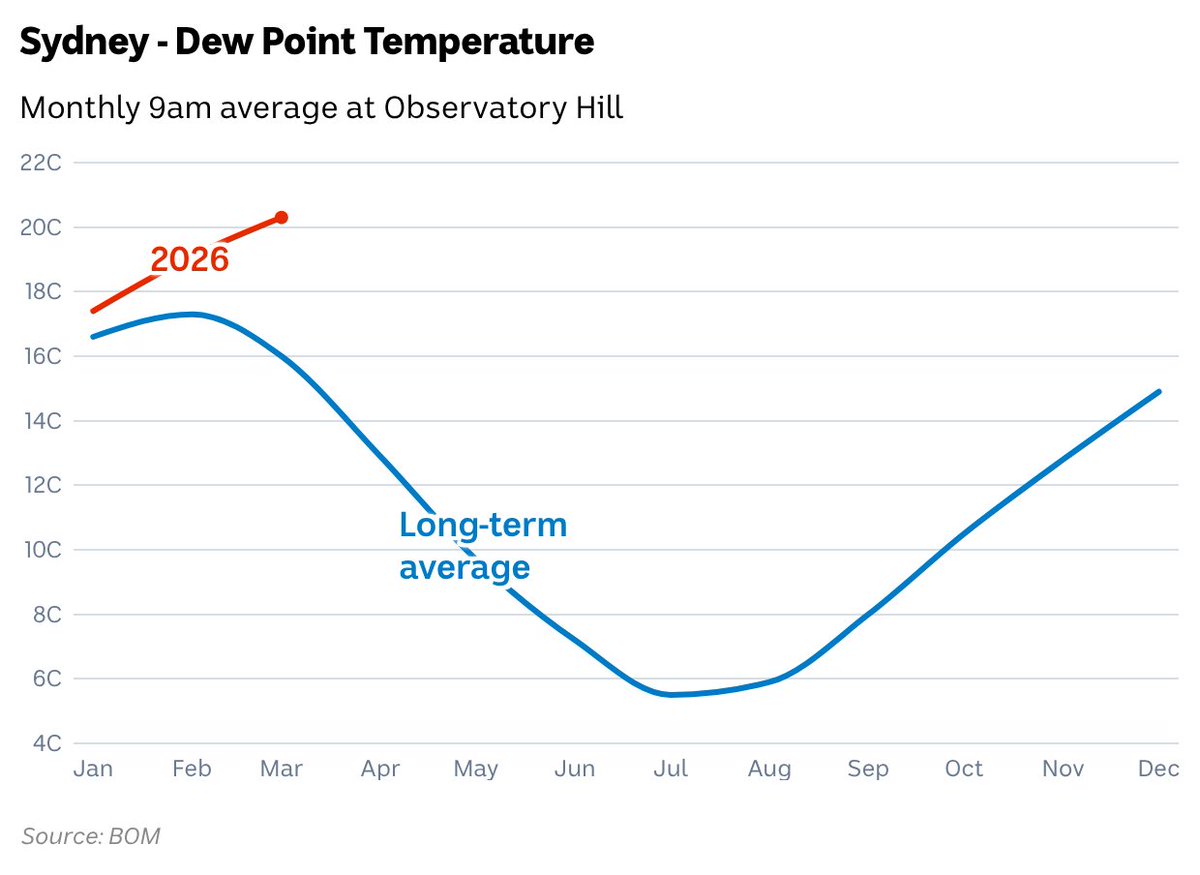
The humidity the past few weeks has been oppressive in #Sydney. And I have the proof ... but using dew point which is a far more direct and accurate measure of atmospheric moisture than RH%.
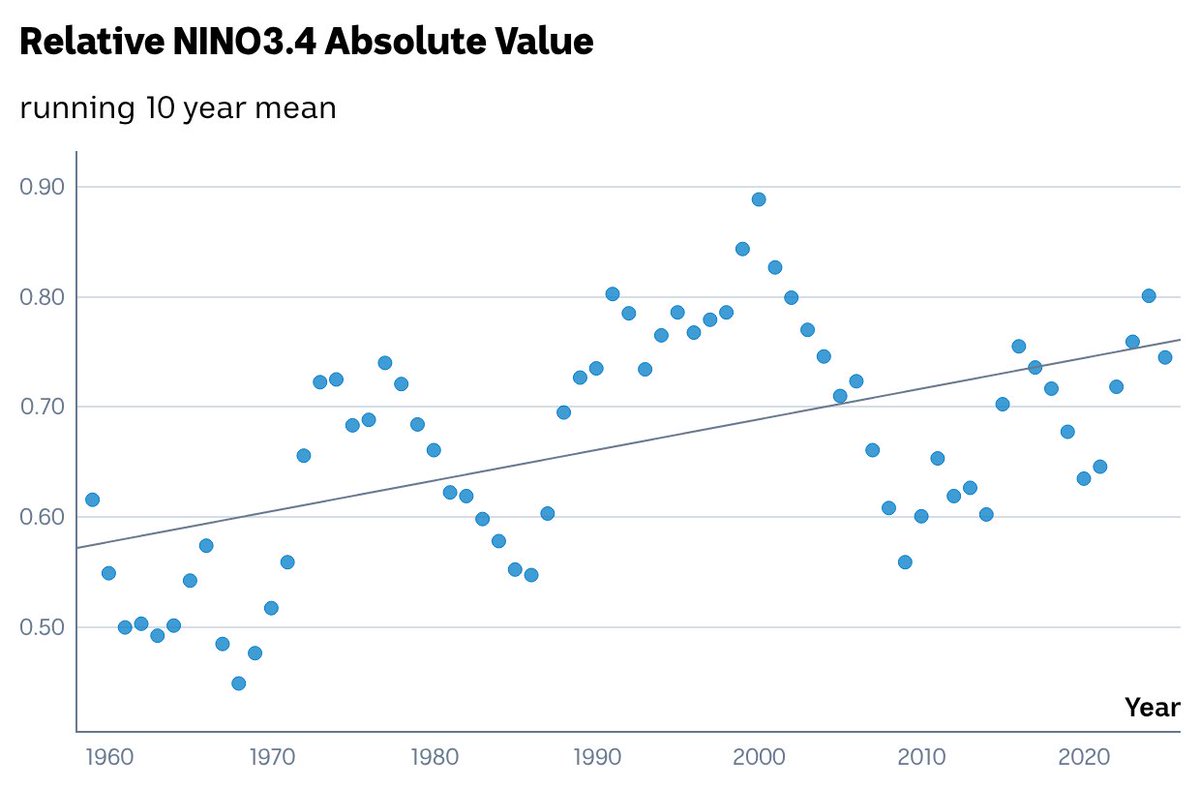
ENSO becoming more volatile? I have calculated the running 10 year mean of absolute relative NINO3.4 values (ERSST.v5). Seems to be trend here which concurs with some of the research. #ElNino#ENSO#LaNino
If El Niño develops this year as predicted by modelling (which are least accurate in Jan-Feb) lets see if we can finally avoid the misinformation about a dry summer.
https://t.co/1c0xEaxjc3
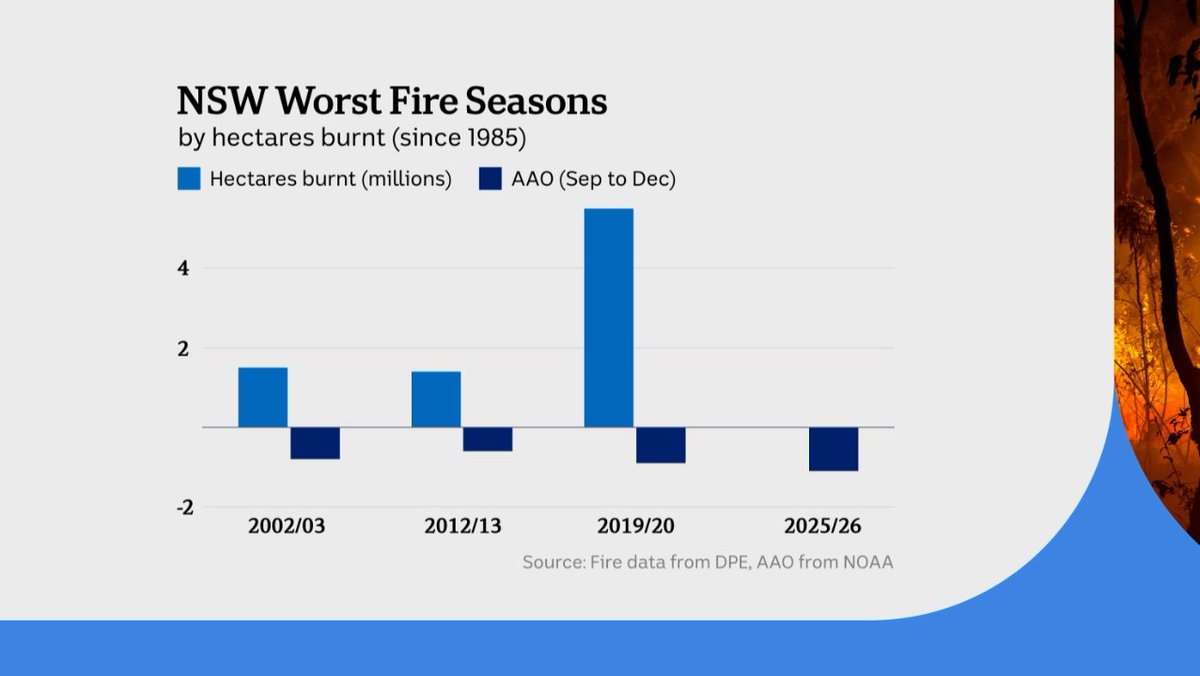
Graph I showed on ABC news last night. The 3 worst fire seasons since 1985 for NSW in terms of hectares burnt all have a negative Antarctic Oscillation from Sep to Dec (proxy from SAM). Some negative SAM years though, like 2000, aren't bad fire seasons - so there is hope.
There is a global misconception the Gulf Stream is the main reason western Europe has mild winters. I would argue the key is the presence of any major body of water to the west, regardless of currents. Eg Vancouver is only slightly cooler than London at a similar latitude.