$BTC HTF Update
As much as I’m a HTF bull, I must admit that the move from the February 6 low to the high 70s appears corrective. Therefore, it looks like the max pain scenario from here—for both bulls and bears—is more chop.
A month ago I flagged a possible expanding leading diagonal (see this post: https://t.co/8ZUTFM74sS), and then we got a correction down to the March 29 low. Normally, this 1-2 is followed by a strong wave 3, but the move from March 29 to now has been too slow, too overlapping, too easy to get into, and has left far too much stops/liquidity behind. There are LTF impulses, but they feel forced, the corrections between them are excessively long, and when you zoom out the structure simply doesn’t look like a true impulse. It could very well be an inverted ABC.
If this read is correct, it becomes more probable that the C wave of this HTF expanded flat contains an extended wave 1, the advance from the February 6 low to the present is wave 4, and we still have a final downward wave 5 to complete (as shown in the attached chart and the right-hand chart in the quoted post). It remains to be seen whether wave 5 will sweep the $60k low (full impulse) or truncate. Either way, what follows should mark the true start of the next impulsive uptrend.
I have to admit this scenario would be perfect from both a sentiment and technical perspective:
1) Price first pumps above the February high to test/fill the 1D inefficiency (see this post: https://t.co/hnWhlBEsXv). Bulls celebrate, call the correction over and new ATHs are coming… only to get rejected hard.
2) Price then delivers the final downward wave 5 of the expanded flat. Big players take all the liquidity below and shakes out retail.
3) At the lows, bears cheer and declare the “bear market” is back… only for price to find strong support and immediately begin the next uptrend.
4) Neither bulls nor bears get the outcome they want. The whole process can easily take considerably longer than expected, leaving both sides impatient, chopped out, and/or forced to exit positions.
The invalidation of this scenario is a clear impulsive HTF market structure break (from mid-air) above the previous HTF lower high: the $97.9k high of January 14.
#Bitcoin
There's no doubt that this $BTC correction from the all-time high has been impulsive on the higher timeframes. In my view, it likely represents the C wave of an expanded flat (as you already know). However, the internal wave structure hasn't been easy to read. Looking at how the price action has developed, I see two main scenarios:
1. My base case (left wave count): we have already completed the HTF downward impulse. In this case, we formed a leading diagonal that peaked at $76k, and we are currently in a wave 2 correction (see quoted post).
2. The HTF downward impulse is not yet complete (right wave count). In this case, one more downward leg is still missing. The worst-case outcome would be a sweep of the $60k low to finish wave 5 (in my opinion), followed by a strong and powerful upward move.
Just to be clear: this post is not suggesting I expect a $60k sweep or that I want it to happen. I’m simply pointing out that the possibility still exists but it’s not a reason to panic given the potential for a sharp reversal afterward.
#Bitcoin
@Lucaas2199 Don't get discouraged, keep your spirits up. The worst is almost over. Use isolated mode on futures, low leverage and wide stops depending on the setup, especially for altcoins with low market caps. If you can do spot trades it'd be even better.
$BTC HTF Update
As much as I’m a HTF bull, I must admit that the move from the February 6 low to the high 70s appears corrective. Therefore, it looks like the max pain scenario from here—for both bulls and bears—is more chop.
A month ago I flagged a possible expanding leading diagonal (see this post: https://t.co/8ZUTFM74sS), and then we got a correction down to the March 29 low. Normally, this 1-2 is followed by a strong wave 3, but the move from March 29 to now has been too slow, too overlapping, too easy to get into, and has left far too much stops/liquidity behind. There are LTF impulses, but they feel forced, the corrections between them are excessively long, and when you zoom out the structure simply doesn’t look like a true impulse. It could very well be an inverted ABC.
If this read is correct, it becomes more probable that the C wave of this HTF expanded flat contains an extended wave 1, the advance from the February 6 low to the present is wave 4, and we still have a final downward wave 5 to complete (as shown in the attached chart and the right-hand chart in the quoted post). It remains to be seen whether wave 5 will sweep the $60k low (full impulse) or truncate. Either way, what follows should mark the true start of the next impulsive uptrend.
I have to admit this scenario would be perfect from both a sentiment and technical perspective:
1) Price first pumps above the February high to test/fill the 1D inefficiency (see this post: https://t.co/hnWhlBEsXv). Bulls celebrate, call the correction over and new ATHs are coming… only to get rejected hard.
2) Price then delivers the final downward wave 5 of the expanded flat. Big players take all the liquidity below and shakes out retail.
3) At the lows, bears cheer and declare the “bear market” is back… only for price to find strong support and immediately begin the next uptrend.
4) Neither bulls nor bears get the outcome they want. The whole process can easily take considerably longer than expected, leaving both sides impatient, chopped out, and/or forced to exit positions.
The invalidation of this scenario is a clear impulsive HTF market structure break (from mid-air) above the previous HTF lower high: the $97.9k high of January 14.
#Bitcoin
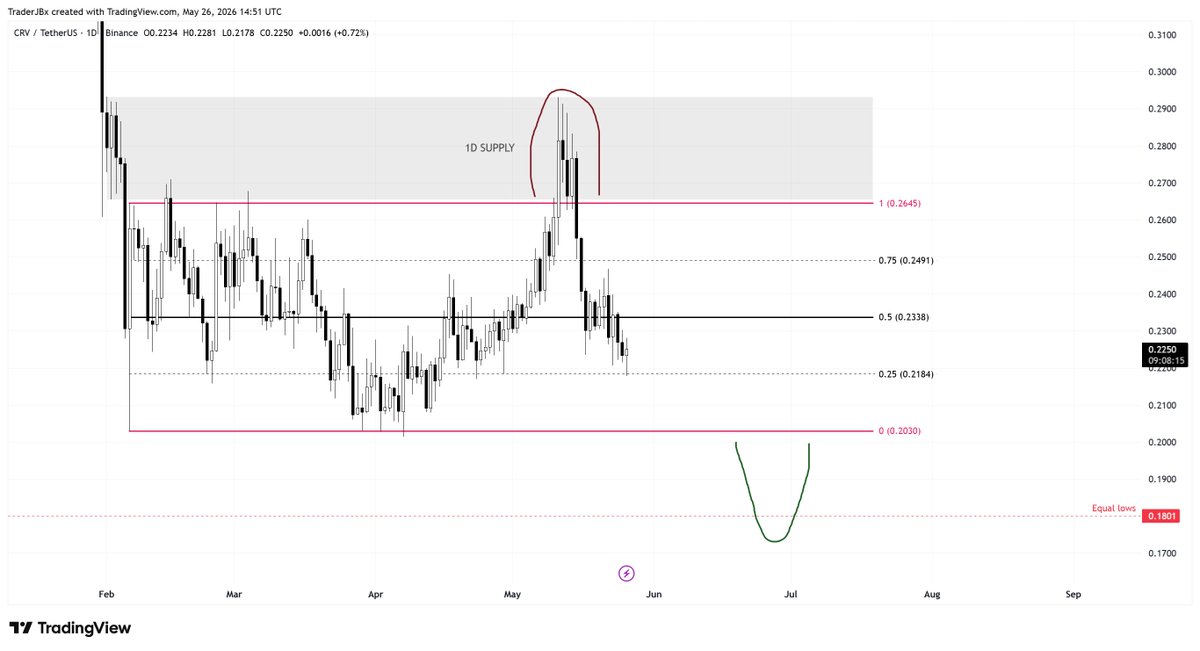
$CRV
At this point, it’s clear the mid-May pump was nothing more than a fakeout above the range into daily supply designed to take out shorts, which means the equal lows are back on the table.
Currently on a do-nothing zone for me until we get at least a proper retest of the range lows — ideally with a deviation below them.
#CurveFinance
@CredibleCrypto I was thinking exactly the same today brother, and if the cycle top isn’t in yet, then the rise in altcoins’ market cap could be even more powerful than expected.
@a710245 Could be weeks or months too, nobody knows, but the point is that downside from here is limited imo and, if my thesis is correct, those pumps will come.
bitcoin:native
Nature is healing. Most of the liquidity (blue dashed lines) and nPOCs (red lines) left behind during the March–May pump have now been swept. I’m not sure if that was it because there are still 3 liquidity pools and 1 nPOC sitting below current price, but even if those remaining levels are taken out, I believe the February 6 wick is likely to hold as support and prevent new lows (I’ll break this down in a separate post).
When the bounce arrives, we need to see clean, impulsive bullish price action—no more choppy, indecisive grinds higher.
#Bitcoin
I’ve been busy testing a scalping strategy (which requires a lot of screen time), but I took the time to put together a HTF analysis on $BTC. Here are my thoughts and potential trade ideas:
The left chart shows that #Bitcoin formed a monthly inefficiency or fair value gap (1M FVG, gray box) between October and December 2025. This gap was tested in January 2026, where price was rejected (white circle). A second monthly inefficiency then developed between December 2025 and February 2026, but it remains untested.
The right chart shows significant liquidity resting below current price levels. This is the primary reason I’ve been leaning LTF bearish at these range highs. That said, price continues to show strength, and no clear breakdown has occurred yet.
The quoted post from @CastilloTrading displays the Naked Points of Control (nPOCs) on the Bitcoin chart. In addition to the liquidity pool I mentioned below current price, there are multiple untested nPOCs in that same area. Notably, one sits at approximately $78.1k, very close to the February high and the lower boundary of the 1M FVG. While it’s not mandatory for nPOCs to be revisited, the more they cluster in a specific region or range, the higher the probability that at least some will be tested.
If price continues to show strength, trades above the February high (and the $78.1k nPOC), and then rejects, that would be my preferred trigger for a HTF short targeting the liquidity left behind below. This is why I’ve been saying recently: you don’t want the pump without first sweeping that liquidity.
If price rejects from current levels, sweeps some (or all) of the liquidity below—including the cluster of nPOCs—and bounces strongly, that would serve as a solid trigger for a HTF long targeting the $78.1k nPOC, the February high, and the 1M FVG. In this case, a subsequent short from that region (if it develops) wouldn’t have such low targets.
Let’s see how it develops.
If my analyses and wave counts for $BTC, altcoins, and crypto as a whole—the compasses that have guided me to where I stand today—are correct, we’re close to some of the wildest pumps we’ve ever seen, if not the wildest.
I’m locked in, fully aware, focused, motivated. I’m ready.
$CVX
Just to be prepared: the latest drop from the range highs was impulsive and the latest rise from the range lows has been corrective, lacking meaningful momentum and getting rejected at the mid-range level. This leaves open the possibility of another impulsive leg lower to complete a zigzag (and maybe sweeping the $1.44 low), especially considering this coin could win the prize for the highest number of consecutive zigzags.
This downside would align with an impulsive move in BTC back toward its own range lows.
#ConvexFinance
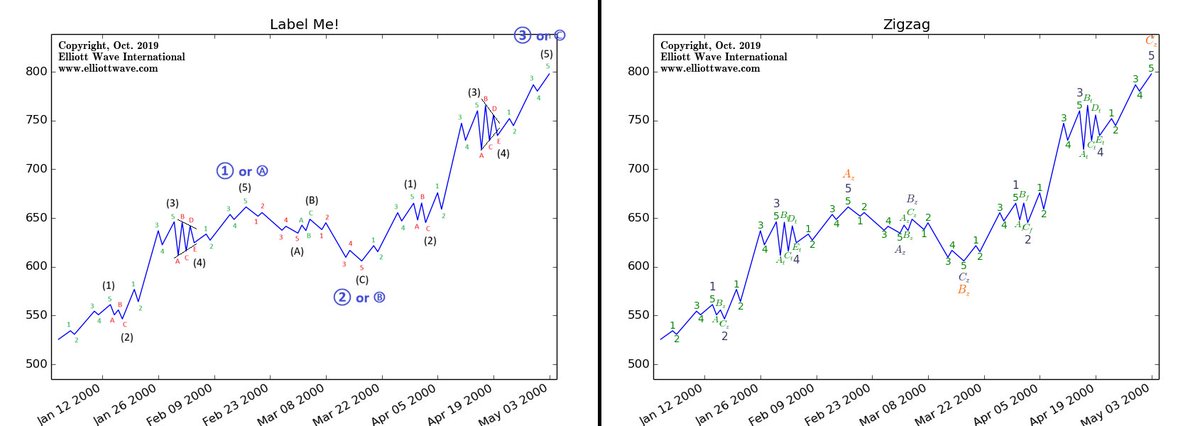
Yesterday’s Elliott Wave Challenge by EWI. Every single wave labeled correctly ✅
Left chart – My labeling posted yesterday here: https://t.co/0wTjX6IFq5.
Right chart – EWI’s official correct labeling posted today (quoted post).
I would add that, without the previous or subsequent price history (as presented in the original challenge), this could also be interpreted as a 1-2-3.
Did you label a zigzag?
Here's the answer to the Elliott wave challenge.
Checkout Waveopedia for helpful tips on learning Elliott waves. https://t.co/d5vN573Jru