🚨 NOUVELLE VIDÉO HEBDO 🚨
👉 https://t.co/3GPakWsIuN👈
🔥 L'EUPHORIE est (presque) partout !
Les indices américains enchaînent les records.
L'IA continue de porter Wall Street 🚀
Et pourtant...
Depuis quelques séances, certains signaux commencent à changer.
👉 Plusieurs leaders montrent des signes d'essoufflement
👉 Les sanctions après résultats deviennent plus violentes
👉 Les divergences se multiplient sous la surface
Simple respiration à acheter ou début d'un mouvement plus important ⁉️
Je vous partage ma lecture du marché et les niveaux que je surveille de très près.
💙 Merci pour vos soutiens et partages 🙏
#Bourse #Nasdaq #IA
Pour résumer chers crypto bro', arrêtez de vous casser la tête avec des niveaux de prix et des niveaux techniques, la seule chose qui a toujours marché sur les cryptos sont les cycles. Bottom = 05 octobre 2026 / sommet = 03 septembre 2029. 100% d'efficacité jusqu'à présent!
A quand le bottom du $BTC et à quel prix?
Pour répondre à cela, j'utilise 2 méthodes : le temps et les maths.
Bitcoin a toujours bottom 364 jours après son sommet, ce qui donnerait une date au 05 octobre.
Les draw down diminuent de 7%, ce qui ferait -69%, soit 39K 👇
Since mid-April, the S&P 500 has been rising, while the percentages of stocks above their 50-day and 200-day moving averages have been declining from below 60% and trending down toward 50%.
Not a healthy market. Vulnerable.
Copper now diverging from gold in a meaningful way.
Yes, AI, industrial demand, and onshoring are part of the story.
But the real driver is a tightening supply-demand imbalance that the market is only beginning to price in.
That said:
Metals rarely stay disconnected for long.
This gap is setting the stage for gold to become the next catch-up trade, in my view.
https://t.co/sJjIAEqwqb
@gsmferrari Certes.... Mais pour émettre un avis, j'attendrais davantage de certitudes pour agir qu'un mouvement sur un time frame d'1H... Ceci dit, bon courage à vous !
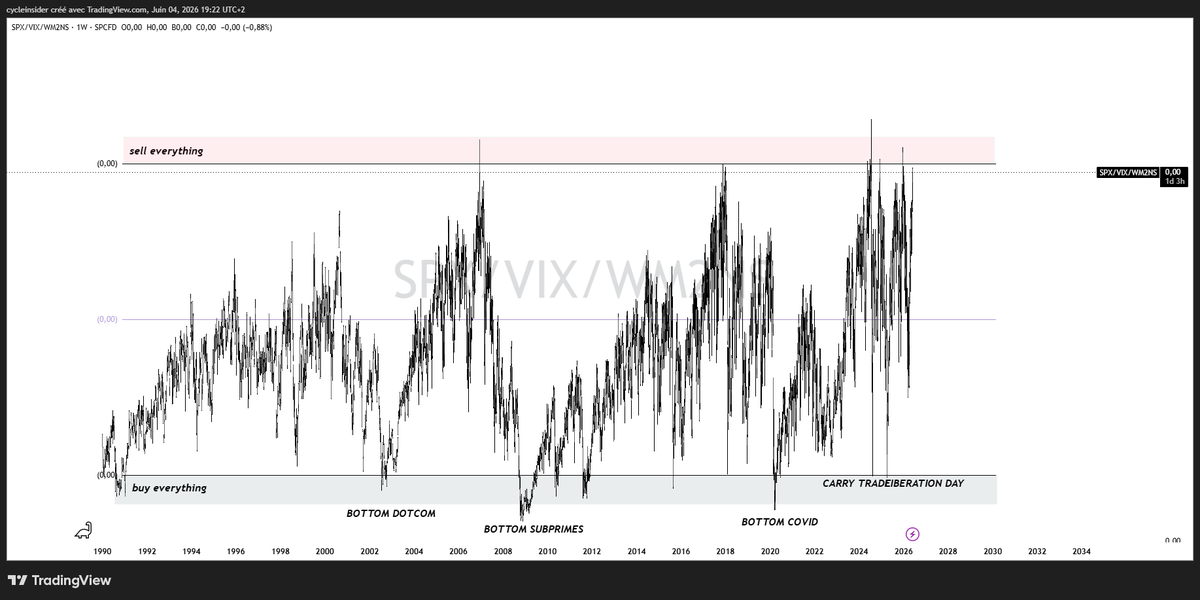
La paire SPX / indice de volatilité / masse monétaire américaine est à un poil de fesse de la zone ultime de sommet de marché. Je suis sûr de moi, le top est à 7640$ à 30$ près
🇺🇸 S&P 500
The bulls have history on their side. Since 1950, a May rally of more than 5% in the S&P 500, like this year, has been followed by gains over the next year every single time, averaging 21%
👉 https://t.co/yIk7SZYp6p
h/t @RyanDetrick $spx #spx
🚨 STOP AND LOOK AT THIS CHART NOW!!
S&P 500 is literally repeating the DOT-COM crash.
This is the same pattern from 1999-2000:
WEAK VOLUME. NO REAL BUYERS. LOW LIQUIDITY.
But the price is grinding higher every day.
Remember, every crash starts at the top...
97% probability $SPY crashes at least 10% after June 15.
There's 4 massive reasons $SPY can't avoid it:
1. Large IPOs like $SPCX will trigger sell off.
Major IPOs drain liquidity. The 1999–2000 dot-com IPO wave pulled $100B+ from markets before $SPY crashed 78%.
2. Kevin Warsh hawkish FOMC on June 17
Hawkish Fed surprises trigger immediate selloffs. In June 2022, a surprise 75bps hike sent SPY down 8.4% in 5 days.
3. $MU $ORCL earnings is the peak of market
Semis and enterprise software peak earnings historically signal cycle tops. $MU peaked in June 2018 $SPY followed with a 20% correction by December.
4. Midterm elections for Trump is this year
Midterm years average a 17% $SPY drawdown before Q4 recovery. 2022 saw $SPY drop 25% into October before reversing Trump's 2026 midterms follow the same cycle.
♻️ RESHARE this post and write 1 comment, I'll share with you my $SPY target for the crash.
SAP je vous avez indiqué pourquoi une prise de position suivi.. construction retournement H (159.67) en cours/
test tunnel baissier + fibonnacci (166.90)
si franchissement on visera 180/mm200
Le RSI14 /MACD rupture haussière ligne de régression