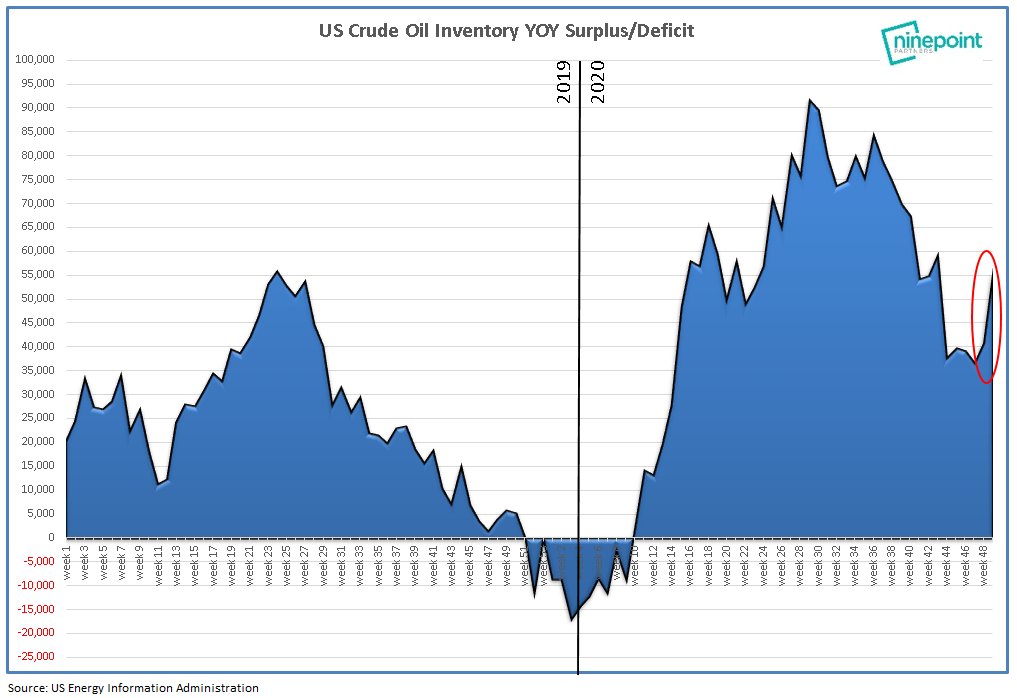
Before we all freak out with oil inventories growing by 15MM week-over-week, imports were up 1MM Bbl/d and exports were down 1.6MM Bbl/d...2.6 x 7 = 18.2MM Bbl swing. Real-time satellite data shows global inventory surplus still falling. Let's see what next week brings...
@MagnusMacro If you are using windows, install it via Anaconda. Look into popular libaries like pandas, numpy, matplotlib, sci-kit learn, statsmodels, keras, beatiful soup etc. Kaggle is a fun learning resource.
Stop all the discussion on inflationary risks after the NFP report.
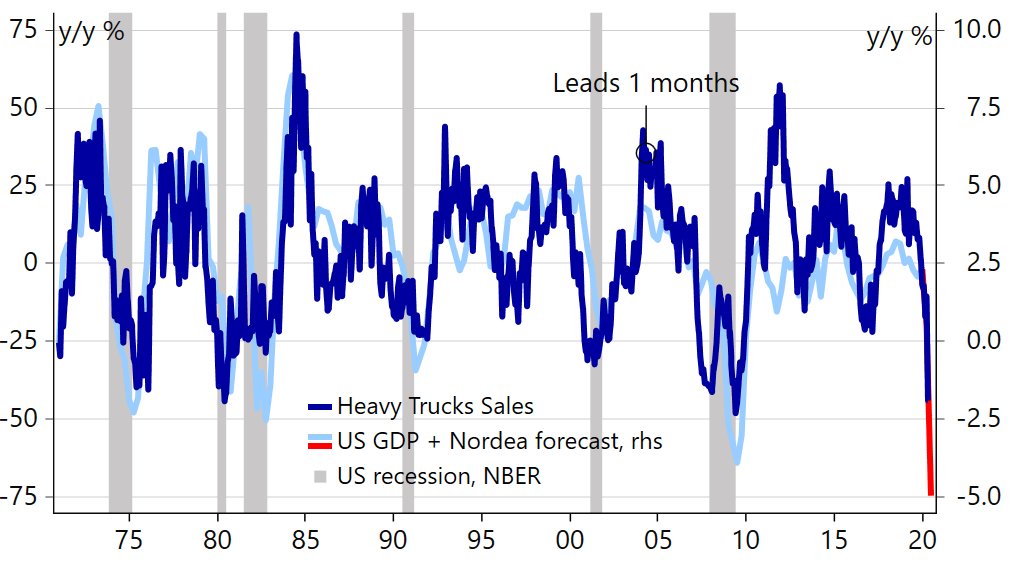
We still need a MASSIVE rebound in employment before it even makes sense to discuss upside risks to core inflation.
How to trade inflation -> https://t.co/BX9fgfyh9B
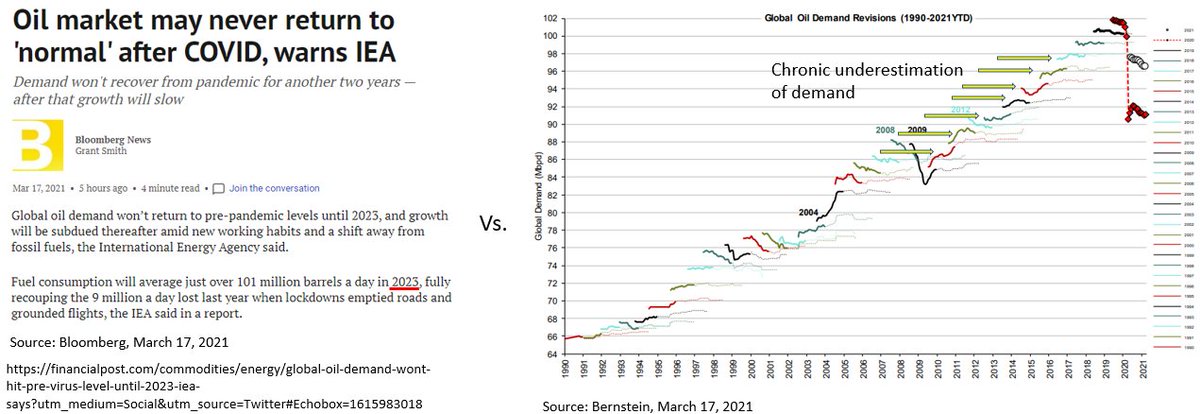
Anyone still saying that it will take years for oil demand to (largely) recover simply isn't looking at the data. Time for the perma-bears to throw in the towel...this too is passing
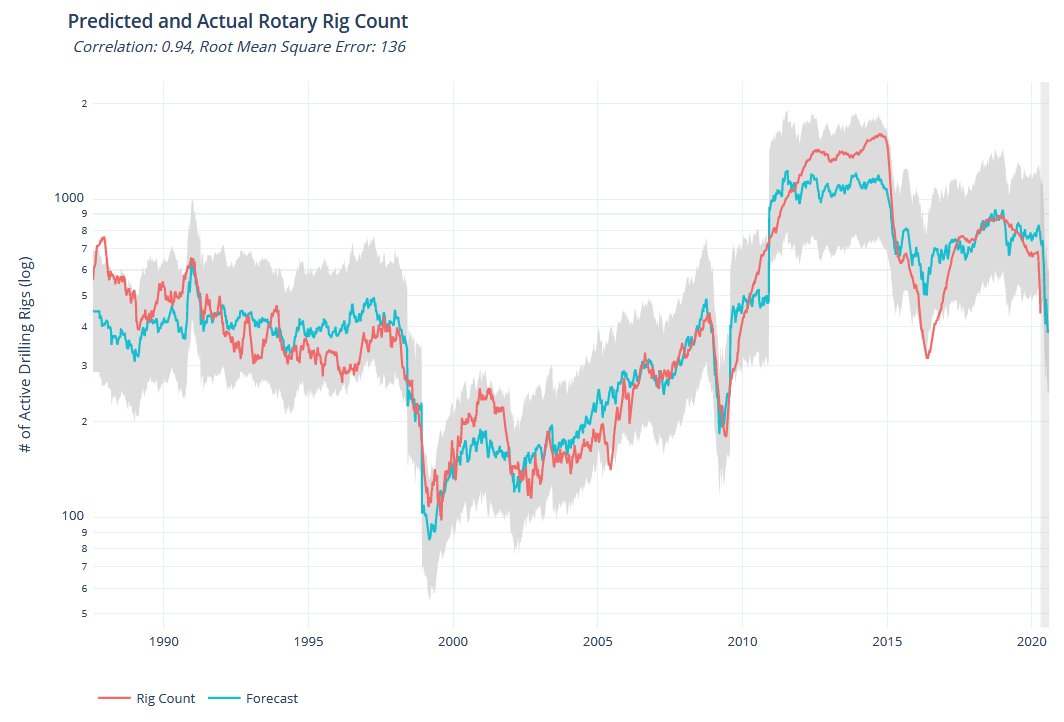
@EnergyCredit1 I have a model forecasting the rig count (no lagged dependent variable). My current forecast for 8 weeks out is 384. Statistics aside, I think we are going lower than that.
Apple is now releasing mobility trend data from its Maps app. It tracks the #COVID19 impact on walking, driving and transit activities. Below graph shows Denmark https://t.co/raUP4Qk656
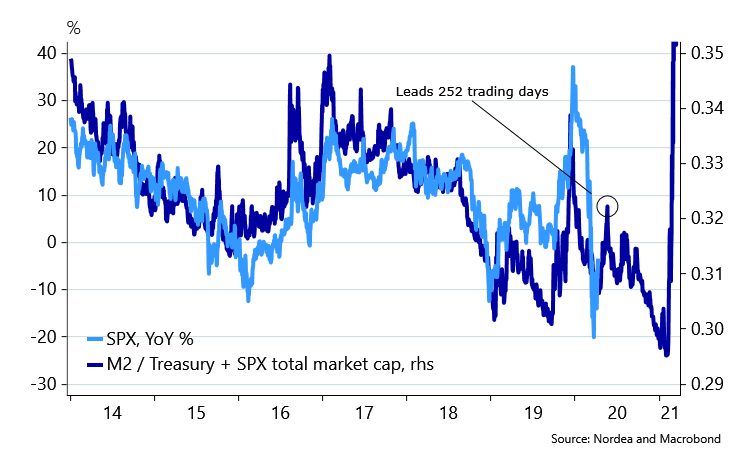
Too much money chasing too few assets should lead to a bizarre positive ketchup effect in to 2021... But I think we will head lower before then..
https://t.co/wnEnl8KBAt
🇯🇵👺 #USDJPY currently buoyed by quarter-end & fiscal year-end, but watch out below come April! Plunging US real rates likely to start weighing on the pair very soon. $JPY