@JeanPeugeot1@HighlyCitedX I think population A represents Homo Heidelbergensis or some type of them, and B is probably some sort of Erectus type (again naming is controversial but I will just say Erectus for sake of easyness) TMRCA between pop a and B is around 1.3-1.5MYA so timing matches up
@JeanPeugeot1@HighlyCitedX Oh sick, yes at least we got this, although comparing protein sequences I don’t think is as robust a method as genomic sequences comparisons, but better than nothing, I hope they get more dna but we can only hope
@JeanPeugeot1@HighlyCitedX The climate also makes it unlikely for preservation, so it could js be sapiens fossils have been somewhat lost, but they were probably chilling around in west Africa doing there thing for a while
@JeanPeugeot1@HighlyCitedX Sorry is this diagram based on proteins or on physiology? I haven’t seen it before so if you could elaborate I would appreciate it
@JeanPeugeot1@HighlyCitedX IMO I think east Africa makes the most sense, but I mean anything is possible, and also it could have been that pop A and B overlapped over Africa and had continuous admixing events over northern and wherever in Africa, but until more genetic or archeological evidence comes idk
@heinrich44865@Zeke_Darwin There is a lot of weird stuff with hominid history but this is just because we are intelligent so we are always moving around and mixing with other groups and stuff which can make stuff difficult but I appreciate the conversation, I’m free to talk about anything else aswell
@heinrich44865@Zeke_Darwin That 2-19% paper is actually flawed because the methodology was detecting a more Archaic sapiens group admixing with a more modern one, with the super archaic lineage being embedded within the archaic sapiens one.
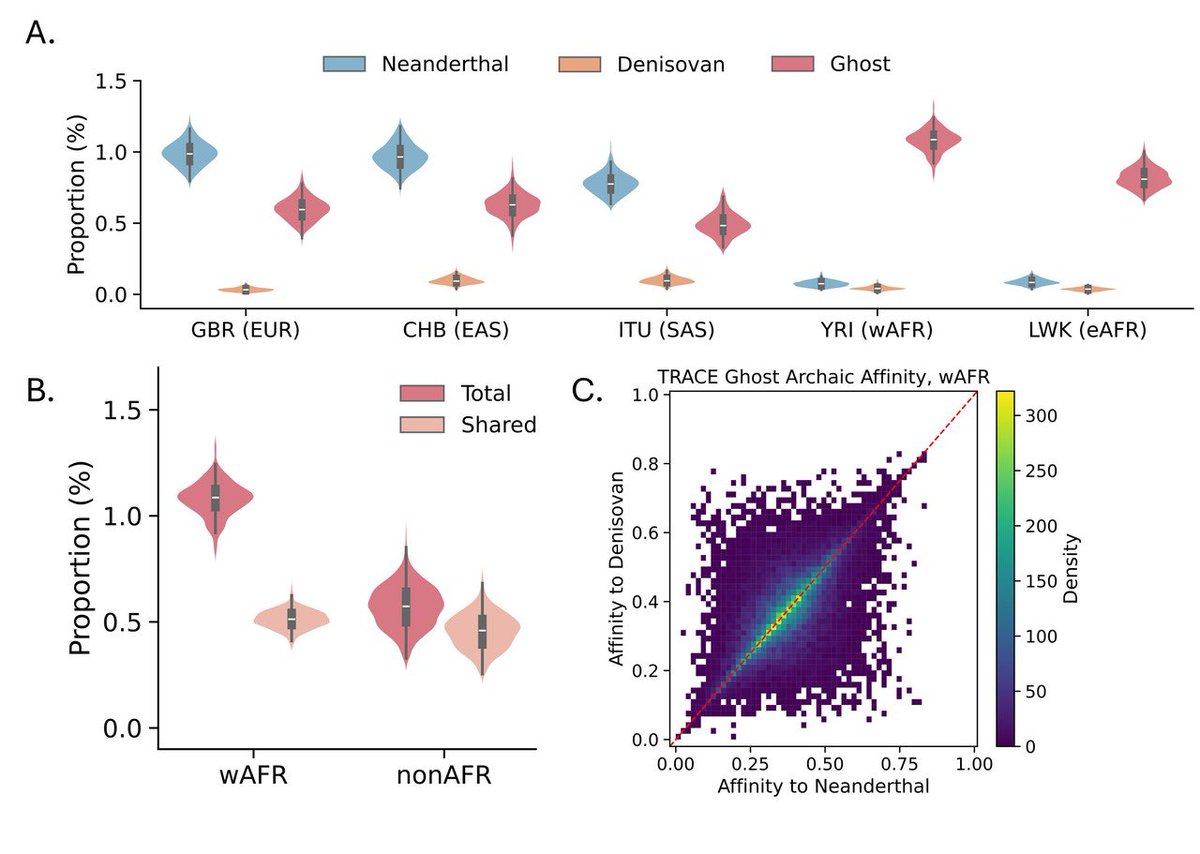
@heinrich44865@Zeke_Darwin And also the actual ghost admixture is pretty minimal (few%) with some of this ghost being found in OOA groups, here’s a image from the new TRACE study, which has the ghost be found in around 0.5-1.3%, although it does under report Neanderthal aswell so actual % probably higher
@heinrich44865@Zeke_Darwin If Eurasia were the matrix, Eurasians would have unique ancient DNA lines. But, Eurasian genomes are a strict subset of African diversity(+yandmtdna) Eurasians also mixed with Neanderthals/Denisovans,yet their raw diversity remains drastically lower due to the recent bottleneck
@heinrich44865@Zeke_Darwin Yes, it is like colorless mathematical graph. The colors are just labels added afterward, not geographic boundaries or perimeters. The axes map mathematical variance in genetic mutations, completely independent of physical geography or distance.
@heinrich44865@Zeke_Darwin I replied to the other comment regarding my issue with PCA as a measurement of genetic diversity, but It is about mathematical variance, not physical volume. Each axis represents a specific percentage of genetic variance explained.
@heinrich44865@Zeke_Darwin PCA has to compress millions of SNPs into just 2 or 3 axes, losing tons of data. If you look at actual raw genomic data (more specifically) nucleotide diversity (π)African populations have the highest raw genetic diversity on the planet.
@heinrich44865@Zeke_Darwin Phenotype (looks) can be misleading, but this diversity is measured directly at the base pair level of DNA (SNPs). Two Africans can share less DNA with each other than an Englishman shares with a Han Chinese person. Africa holds the most genetic diversity
@heinrich44865@Zeke_Darwin You are reading the plot backwards. Tight clusters (Eurasia) mean low genetic diversity. The long African trail shows immense internal genetic distance.Two Africans are often more genetically different than a European is from an East Asian (when comparing actual genome sequences)