Asi está la superficie y la subsuperficie del Pacífico. Para destacar los +9ºC que hay alrededor de los 100 mts de profundidad, llegando a las costas suramericanas. Por eso se considera un meganiño, entre otras cosas
The deadly storms that hit Chile during July were fueled by a record-breaking subtropical jet stream powered by El Niño.
Later this year, a mirror-image pattern is expected in the Northern Hemisphere, with an intense subtropical jet stretching across the southern United States.
🥶 The cold air behind NZ's record August chill at 13 locations has now reached the Pacific!🌏
🌡️ Nadi, Fiji dropped to just 13°C on Friday night. El Niño is helping cold southerlies reach deeper into the Pacific 🌀❄️
🧥 Heading to the islands? Pack a jacket! 🌴
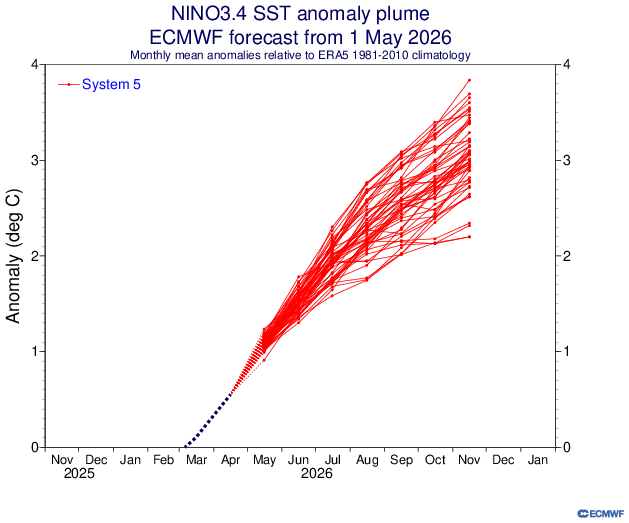
Here's what a record-breaking +3.94°C El Niño could look like at its peak later this year, according to the new NMME — which trended 0.37°C stronger compared to its previous model run.
Daily El Niño monitoring in the Central Pacific by @Senamhiperu shows sea surface temperature anomalies well ahead of the forecasted peak in November.
WMO & Members closely monitor this major climate event with far reaching impacts on lives & livelihoods. https://t.co/qXWyiuhEvC
El Niño was sparked by a Kelvin wave that shifted huge amounts of warm water from west to east across the undersea Pacific since April.
And now, a new Kelvin wave is forming.
Yet more warm water will move toward the eastern Pacific and El Niño forecasts may trend even stronger.
Tropical Storm Arthur is a big ball of moisture.
Thursday and Friday look rough for parts of Louisiana, Mississippi, Alabama, the Florida Panhandle, Georgia and South Carolina.
Arthur is similar to other weak, waterlogged and deadly storms such as Barry and Chantal in 2025.
06/17: The first tropical storm of the 2026 Atlantic Hurricane Season has developed near the middle Texas coast. For more information visit https://t.co/glR6tuklIo
In a world of warming oceans, the cold blob really stands out — and it could linger for the rest of the year.
But models stop well short of signaling widespread cooling across western Europe, Iceland or Greenland.
🔵 There's no question that the North Atlantic cold blob, linked to AMOC, has become more persistent in recent decades 🔵
The current cold blob has remained for about a year, coinciding with a negative AMO, which is associated with less northward heat transport in the Atlantic.
Atmospheric moisture levels will be *prolific* across the South this week, with the potential for flooding rain spreading across a corridor from Texas to the Carolinas.
In some areas, record-breaking precipitable water of 4 inches is forecast, signaling a waterlogged atmosphere.
How does heat-wave-free weather sound?
🔵 That's what much of the central and eastern U.S. will be getting during mid-to-late June — as high heat bubbles in the West and Europe 🔴
El Niño development is firing on all cylinders.
Sea temperatures in the central equatorial Pacific have now broken records for five days in a row.
A locally record-breaking westerly wind burst is currently causing yet more warming there.
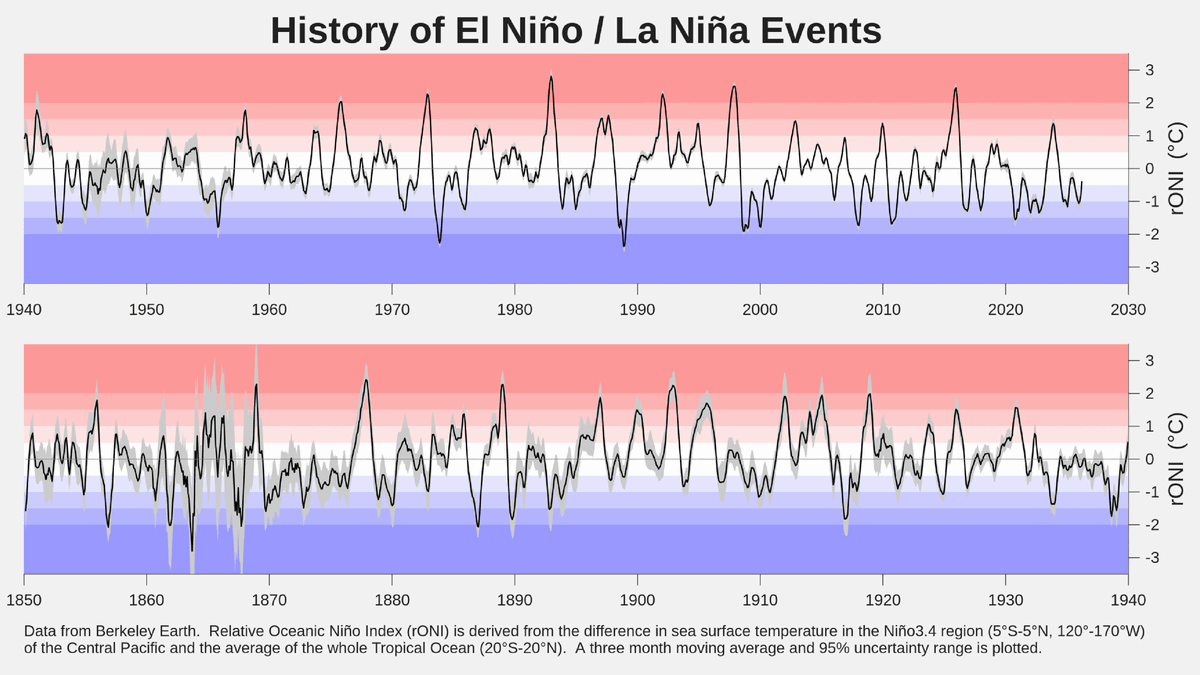
History of El Niño and La Niña events since 1850 by applying the Relative Oceanic Niño Index to Berkeley Earth data.
The strongest El Niños on this index are 1982/83, 1997/98, 2015/16 and 1877/78.
Forecasts suggest an El Niño at the end of 2026 could challenge the record.
A large Saharan dust plume has stretched across the Atlantic from the west coast of Africa towards the Americas. CAMS data shows that large parts of the Caribbean are most impacted.
Genesis of a Super El Niño! Why do we expect this El Niño to be one of the strongest on record? - A main reason: Huge subsurface heat - exceeding most anything we’ve observed in spring - motoring eastward from the deep Western Tropical Pacific Ocean to the East Pacific and emerging at the surface. This is rapidly warming the El Niño region. This is how El Niño forms - it’s not new, it’s just supercharged. This matches most computer model forecasts for a historic El Niño pattern, throwing Earth’s climate patterns off-kilter. Expect robust effects of El Niño to begin this summer and maximize this fall and winter. The aim of the visual is to help people orient to subsurface views, tough to do without a frame of reference. Credit to @cyclonicwx for the animating map inlay. #elnino #science #stem #climate
Why is there a high chance for a super El Niño?
One key factor is an expectation for more westerly wind bursts and weaker trade winds in the months ahead, highlighted by red shades in this animation.
Warm water will keep sloshing across the Pacific, adding to ongoing warming.
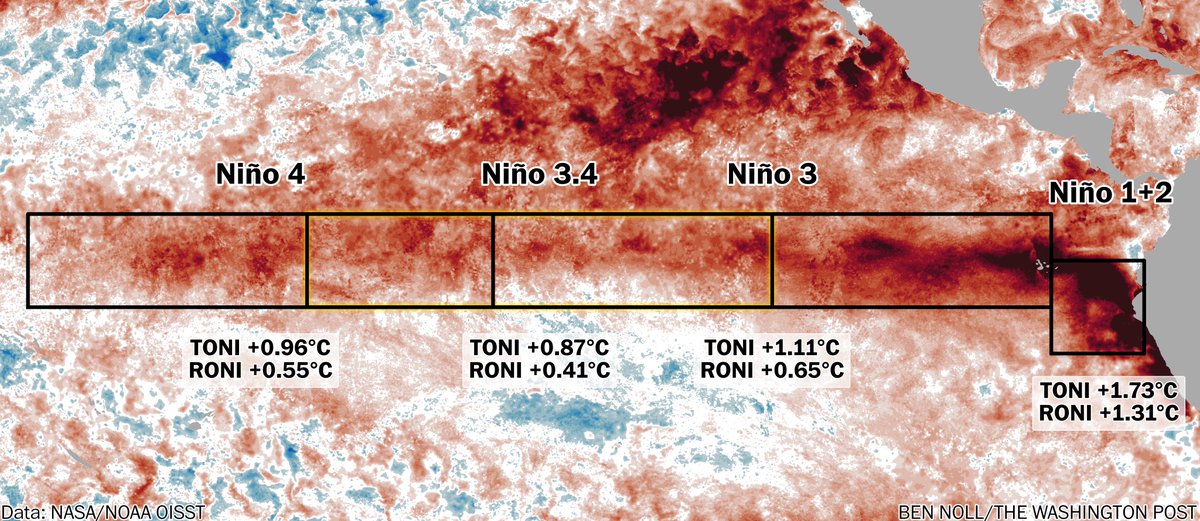
An El Niño signature is emerging.
The developmental pace has been quicker than at this time in 1982, 1997 and 2015, considering traditional indices over the past week.
But, based on new relative indices, the 1997 and 2015 events were slightly further advanced than 2026 is now.