Most trading tools show you the chart. Risk Lab shows you the statistics.
We built the lab around one idea: every decision you make as a trader should come with a number attached.
📈 CHARTING
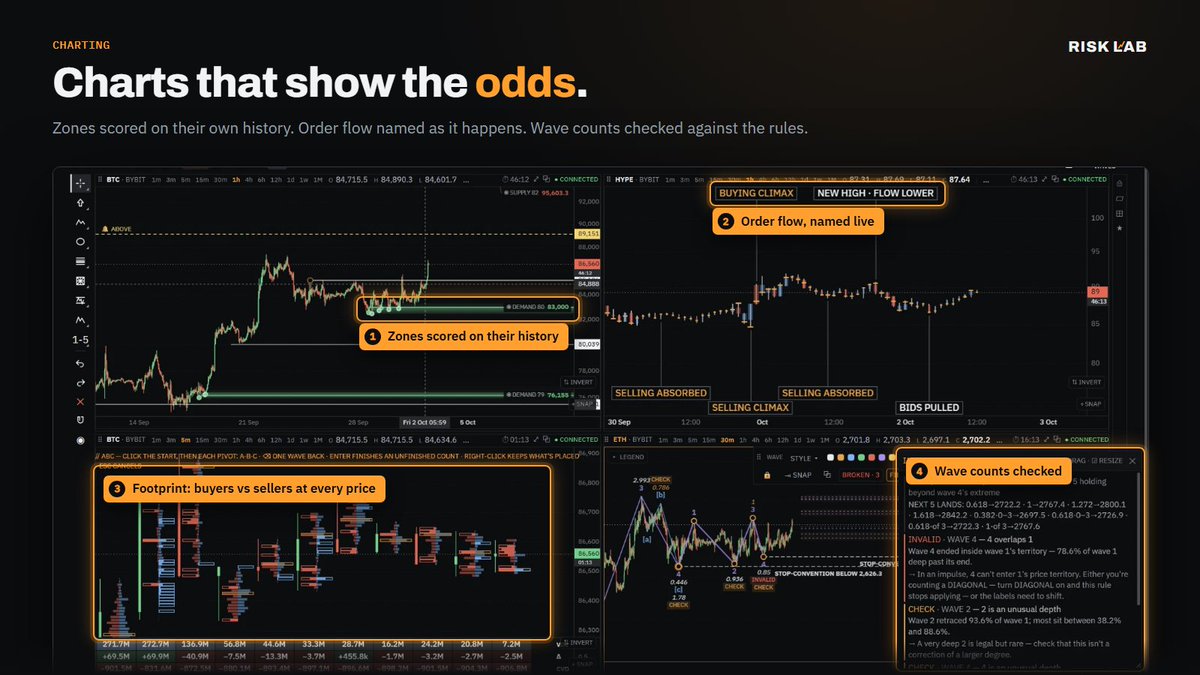
Every supply and demand zone is scored on its own history. Click one and the lab tells you how often zones like it held, how far price ran after each test, and how often price came back from this distance, with the confidence interval right next to the number.
Order flow is named as it happens: buying climax, selling absorbed, bids pulled. The footprint shows buyers vs sellers at every price inside every candle. Draw a wave count and the lab checks it against the rules, and tells you when wave 4 just broke your impulse.
👥 COMMUNITY
The Floor is where traders show their work. Plans are filed before the entry and scored after it. Every playbook carries its live record: win rate, average winner in R, how often it trades, and every win and loss on a dot strip you can't hide. Rank them by sample size or expectancy, not by who has the most followers. Watch members trade live, ask questions, copy a plan.
📓 JOURNAL (free)
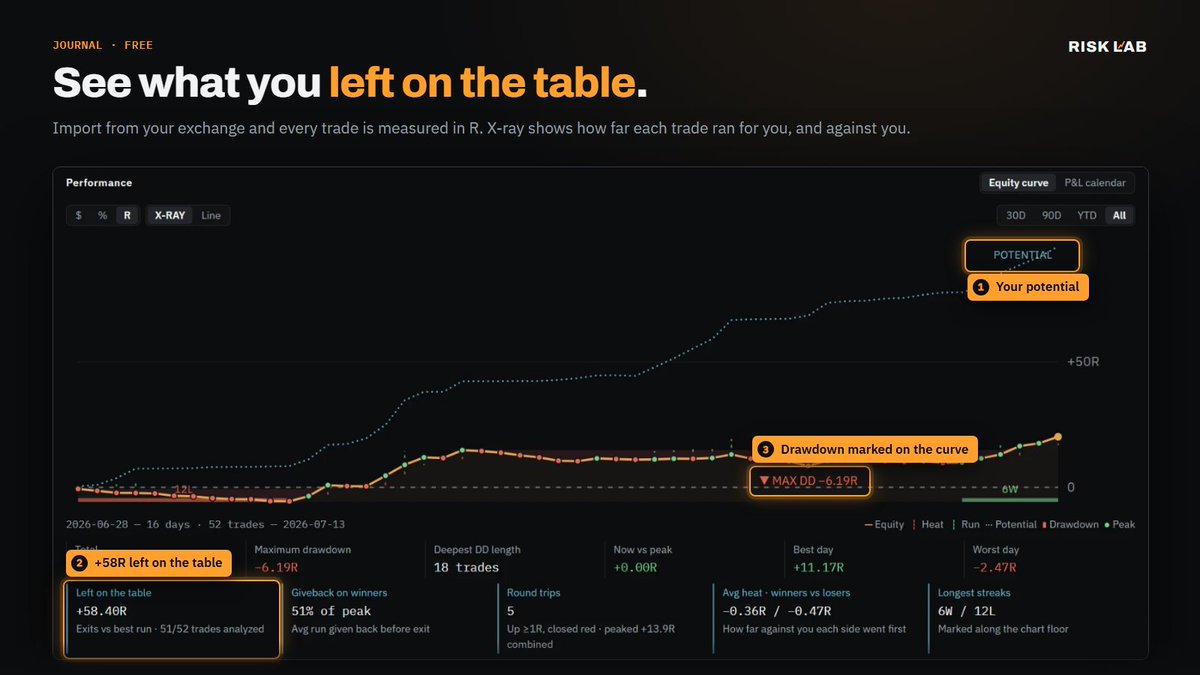
Import from your exchange and every trade is measured in R. The X-ray view shows how far each trade ran for you and against you, plots your potential next to what you actually took, and puts a number on it. Most traders don't have an entry problem. They have an exit problem, and now they can see it.
Charts with the odds. A community with receipts. A journal that tells the truth.
Start free → https://t.co/bhnoopTcsF
URGENT!!!
🚨 🚨🚨🚨🚨
Moneytaur account got hacked!!! Do not engage and trust any links or calls!!
Make sure you share this for awareness!!!
He is working hard on regaining his access and control!!!