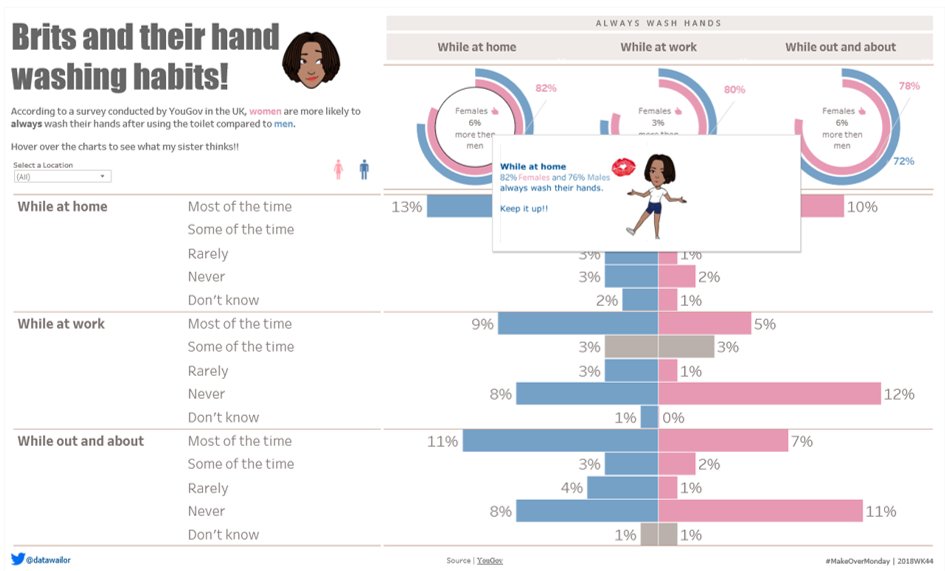
Is a #MakeoverMonday submitted on a Tuesday still a make over monday? (This is my first one ever, even though i've been using tableau for a while now 🙈 but it was a good opportunity to try whatever we call these kind of maps🤔)
https://t.co/HQPv95P7qC
Apparently us Brits can be pretty gross... Around 10% never wash their hands after they use a toilet away from home!
#MakeoverMonday
https://t.co/nO2hmMYomQ
#MakeoverMonday 2018WK44 - Brits and their hand washing habits. Having fun with tooltips in this viz examining Brits hand washing habits. Tooltips could be more refined but here's my initial attempt.
https://t.co/by7DdDALW9
@VizWizBI@TriMyData
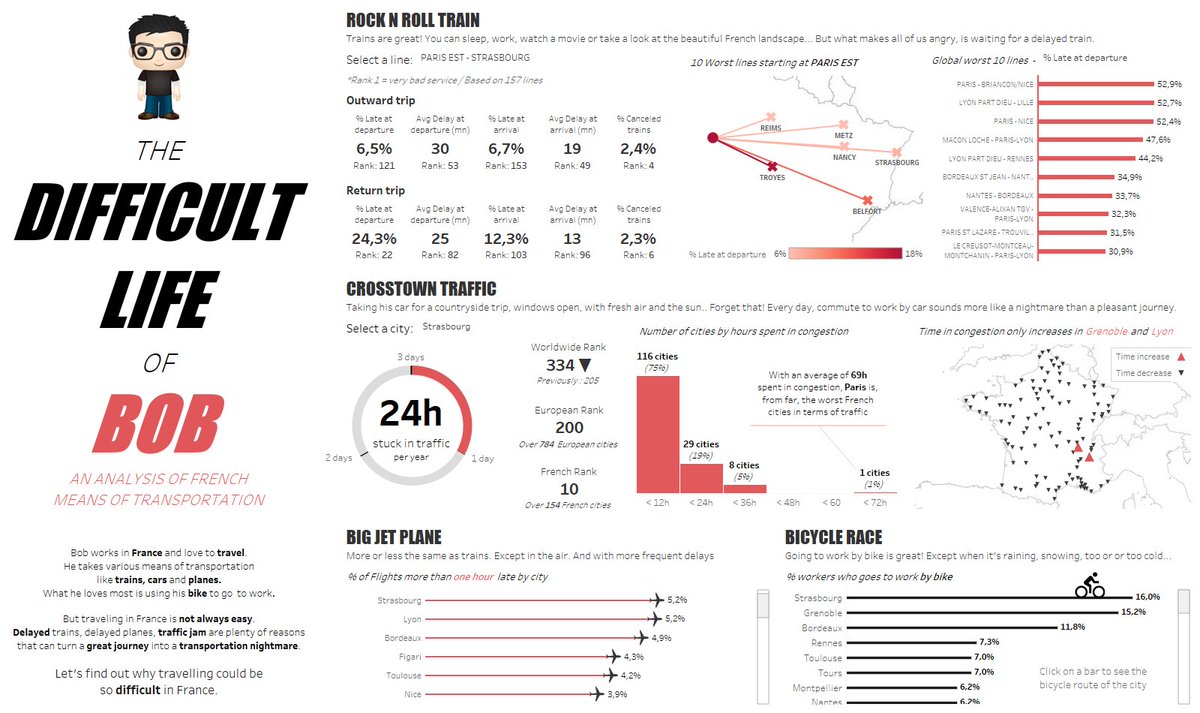
You spend, in average, 69h in congestion per year in Paris. It's the 12th cities with the most traffic. Strasbourg airport is the second worst by delayed flight but it's also the best bike-friendly city. Learn more facts with Bob's life: https://t.co/46B4JpQ475
Happy #PiDay!
Here are 3 new Pi centric creations on @tableaupublic
- Pi in different bases
- Pi's randomness compared to e
- Exploring other interesting patterns
https://t.co/OjzifzmzJE
https://t.co/rFeWbyuLYG
https://t.co/ixE8kBqBVm
https://t.co/5CWscphRjZ
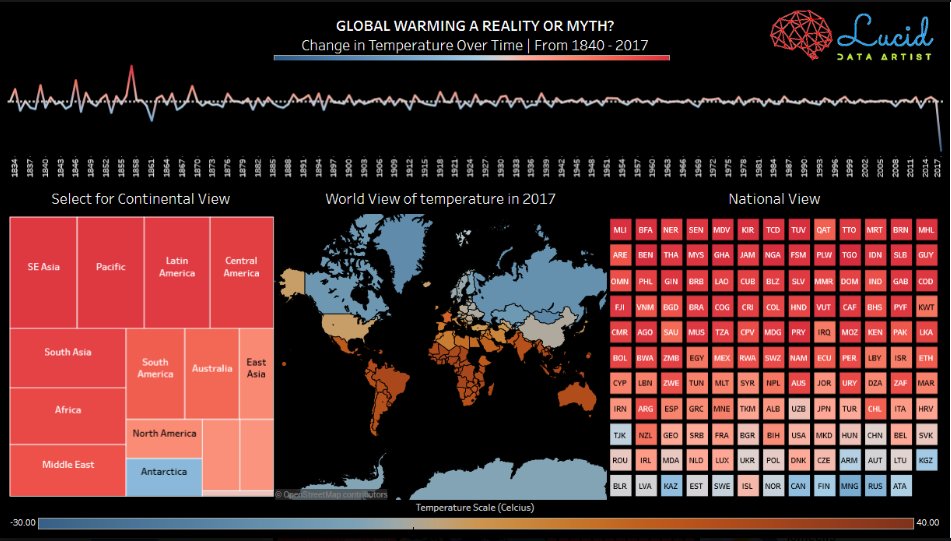
is Global warming a myth or reality? Check out visualization created by our founder Mesum Raza Hemani :)
175 Million records points visualized in this visual from 1840 - 2017 <3
Link: https://t.co/m5ATyxfHHn
@tableaupublic#makeovermonday#WorldEconomicForum#environment
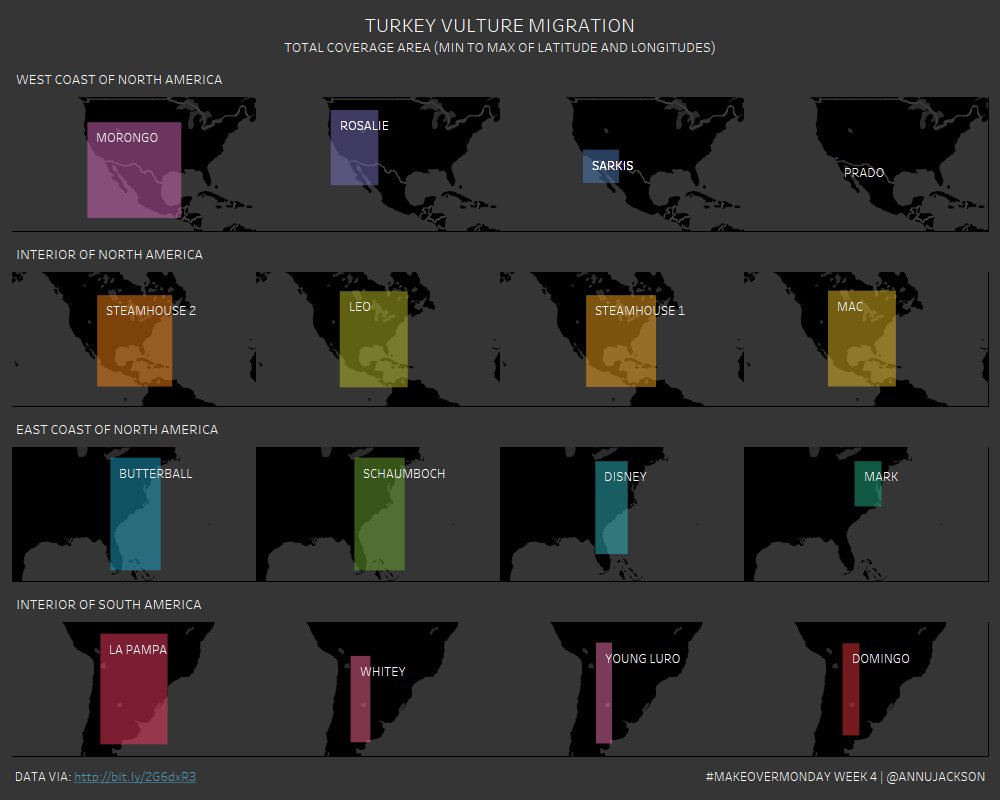
#MakeoverMonday Week 4 | Turkey Vulture Migration | showing coverage area if abstracted to min/max lat/lons | fun with #VIT | @VizWizBI@TriMyData | full viz: https://t.co/AxHi60e0ba