BTC & ETH have had a great move higher - not like previous impulses, this is a great sign of momentum in the crypto market.
Continuation levels for longs are marked in green below. This is where you want to look for longs into the range highs.
The range highs are the ultimate barrier to this turning into a multi-month trend shift.
A weekly or monthly close above on BTC & ETH signal a real shift with clear strength from buyers on a longer time horizon.
Now is the time to prepare and look for longs. Chasing right here is not a good idea.
Looking ahead in crypto, the bigger picture still leans more bullish from here. For the longer-term read, I’m watching the weekly close more than any single intraday move, that’s what matters for the bulls to officially beat the bears.
Nearer term, the path I want to see is pretty straightforward. First a flip of 83k, then a push into the high 80s / 90s. After that kind of run, a pullback is normal - and that’s the area I’d rather look to position from with size, instead of chasing the move up here - also gives time to establish clear leaders (other than the current ones).
If 83k never flips cleanly we are back into the range where more sideways action is the likely outcome.
@TechCharts Aksel - How do you decide which charts to use? Why not use HG1! on Comex, but instead a broker CFD chart?
Would love to know how you choose your tradingview tickers to chart.
We are reaching a point where it makes sense to purchase some BTC.
The downtrend is showing clear signs of slowing - Saylor's Bitcoin sells are getting bought up and the market is ignoring it - onstructive signs for BTCs future.
The 45k to 65k region is a solid area to buy with a time horizon of 12-18 months. Smart investing, not FOMO buys.
A strong loss of 50k may send us to 28k-30k but positions should be cut if this occurs and patience until we reclaim or hit 30k.
I give a greater probability to the current zone being our macro low and have started to deploy.
80k-85k zone did its job.
Did I short it? No - There was no clear trigger for me in line with my rules.
Now we have two choices:
1. Move back into the 70k region (mid-point) before further rejection - or breakdown and run to the 50k-45k demand pocket.
A waiting game for high probability setups.
Silver is setting up to outperform, prepare for what might come next.
The multi-month downtrend from the January peaks is losing momentum.
Price is stabilizing and holding the key range lows at 55-58 instead of printing fresh lower lows.
Here's the shift.
Relative strength versus gold is turning.
Silver is holding stronger than gold in recent sessions, signaling real demand.
To put this into perspective: this is a clean long from the range lows, targeting the range highs at 62-64.
The backdrop is powerful.
A SIXTH consecutive year of structural supply deficit, industrial offtake from solar, EVs and AI data-center buildouts, and rising physical investment demand all tightening the market.
The read: as capital rotates toward real, dual-purpose metals over speculative finance, silver is positioned to lead.
80k-85k zone did its job.
Did I short it? No - There was no clear trigger for me in line with my rules.
Now we have two choices:
1. Move back into the 70k region (mid-point) before further rejection - or breakdown and run to the 50k-45k demand pocket.
A waiting game for high probability setups.
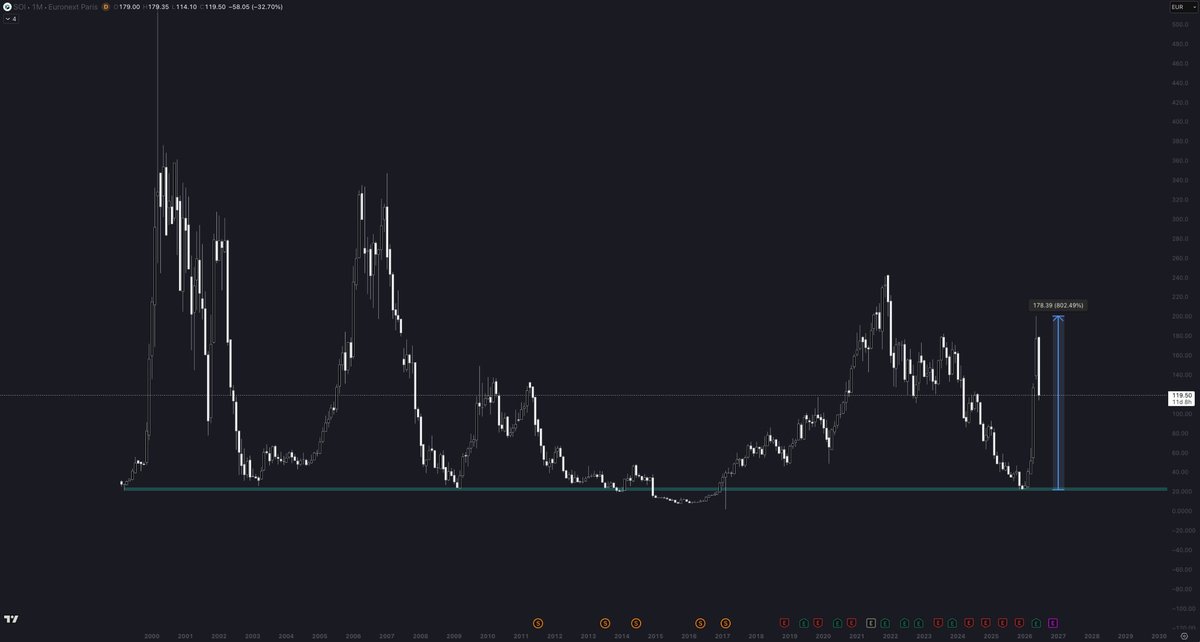
The Soitec thesis has now played out as anticipated.
Strong AI-driven demand for specialized semiconductor materials paired with key technical levels, provides precise high risk to reward setups.
Only at MacroInsight.
BREAKING: Global bond yields are CRASHING across the US and Japan simultaneously.
The US 10-year yield has dropped from 4.68% to 4.44% in just 27 days. The US 20-year has fallen from 5.21% to 4.94%.
Japan is moving even harder. The 10-year yield is down -8.8% and the 20-year is down -9.58% over the same period.
Money is flowing into bonds across BOTH economies at the same time. This is NOT a common market condition.
The BOJ is expected to hike rates tomorrow to 1% – the HIGHEST level in 30 years. Bond yields are supposed to rise ahead of a rate hike. They are falling instead.
The bond market is moving in the OPPOSITE direction of what the BOJ is about to do.
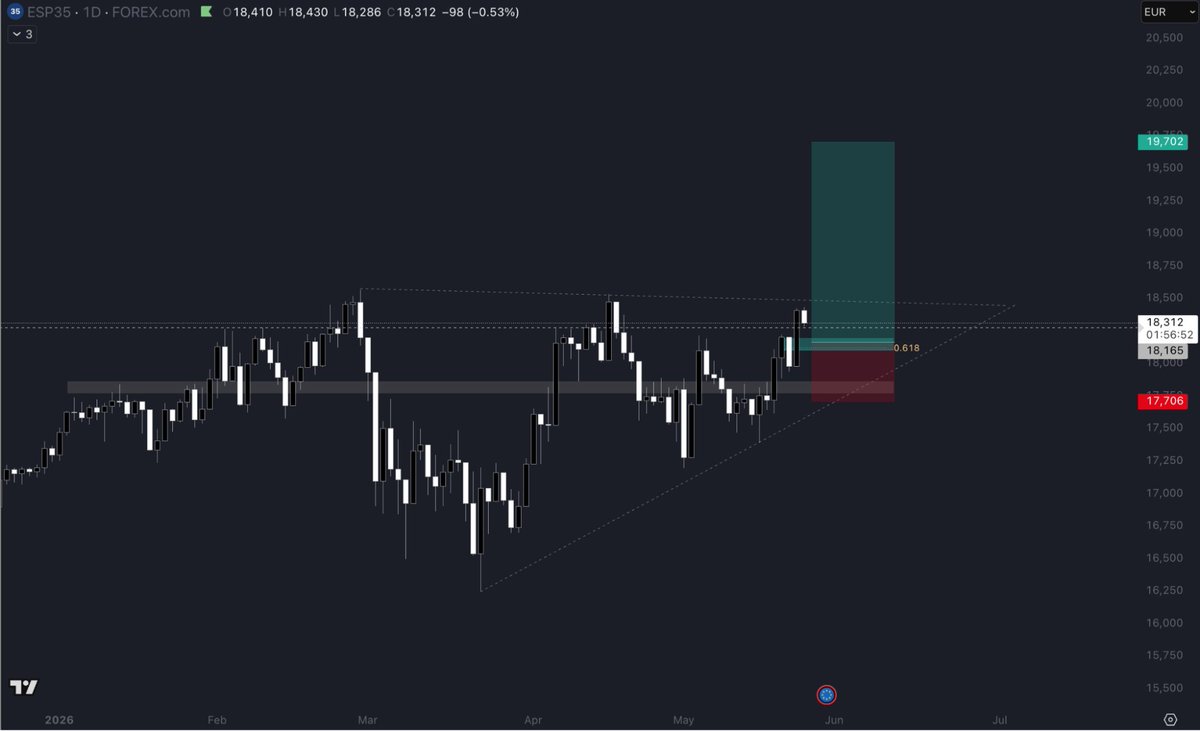
The Spain 35 Situation: Emerging markets are demonstrating robust accumulation on their macro higher-timeframe structure while major indices consolidate after their post-ceasefire rallies.
Spain 35 is compressing into an inverse head and shoulders that can break aggressively.
Tariffs are raising import and export costs for the largest economies.
This is creating a tailwind for domestic trade and niche agricultural exporters.
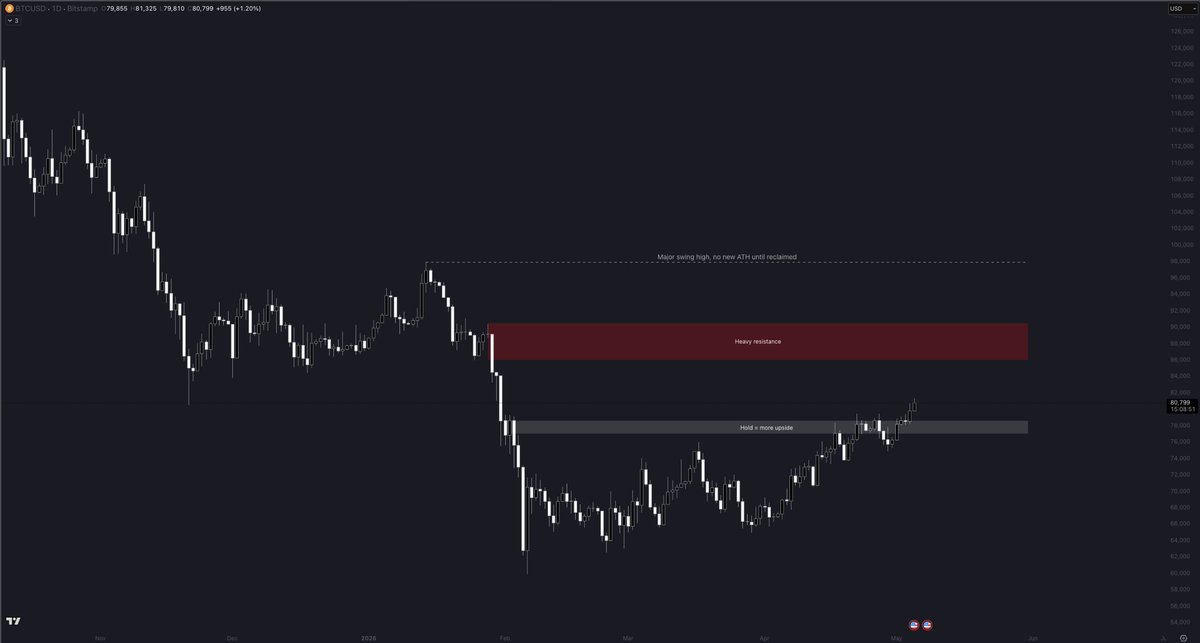
Early may is here, the low is likely in and earlier than expected.
Now 78k-79k needs to hold and a push into the overhead supply is on the cards.
No discussion of new all time highs until we reclaim the 98k swing high with a weekly close.
Bitcoin dominance is at a key level here, altcoins look good to run on this next leg higher.
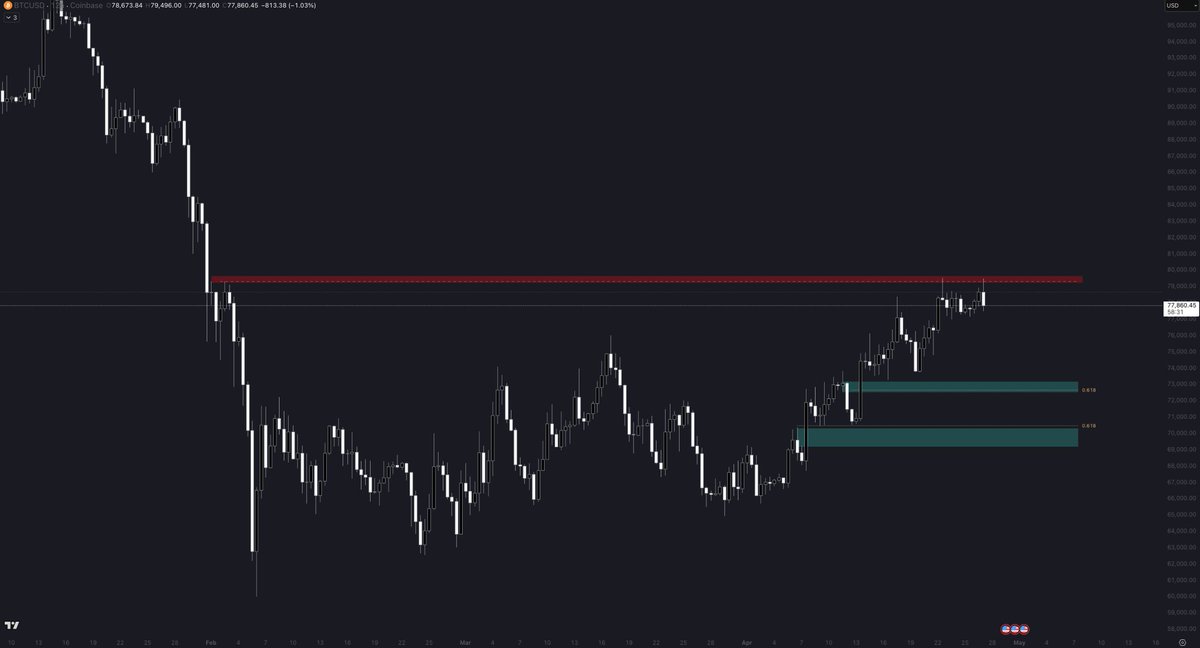
20% since the call and I think we are due for a pullback here. The highlighted zones are your best opportunity to get long for another leg higher.
Demand hitting in the first week of May is what you're looking for.
85k-90k we face our next hurdle.
Lose 70k and re-evaluate.
At MacroInsight, our mission goes beyond sharing research - we turn the same ideas into high-conviction alpha.
Our community doesn’t just anticipate major shifts. They understand them and act decisively - capitalizing on opportunities while others hesitate.
The edge is in the execution, not the thesis.
20% since the call and I think we are due for a pullback here. The highlighted zones are your best opportunity to get long for another leg higher.
Demand hitting in the first week of May is what you're looking for.
85k-90k we face our next hurdle.
Lose 70k and re-evaluate.
BTC showing it wants to go higher, targets are still the same.
Don't really need to think much here, bid what's moving or already showing some momentum.
Small caps are gaining confidence this is not another range high sweep.
Losing 70k would be bad.
BTC showing it wants to go higher, targets are still the same.
Don't really need to think much here, bid what's moving or already showing some momentum.
Small caps are gaining confidence this is not another range high sweep.
Losing 70k would be bad.
Not a bad spot to purchase some crypto.
Timeline is a few weeks of relief.
Don't get lured into the "we're going to all time highs" calls in the near future.
Enjoy the green candles on your favourite altcoins, for now.
The US Just Quietly Locked Down the World's Most Important Waterway...
While traders watched the Hormuz blockade, the real move happened 6,000 km east.
On Monday, the US announced a Major Defense Cooperation Partnership with Indonesia.
Media barely flinched. Most traders didn't notice.
But the United States just positioned itself to influence every major oil chokepoint on the planet. Simultaneously.
If you're not reading the board, you're going to get caught on the wrong side.
Everyone's Watching Hormuz. The Real Move Is Malacca.
Hormuz has been effectively closed since late February. Oil ripped from $61 to ~$98 Brent. The IEA called it the worst energy disruption in history.
On Sunday, Trump ordered a naval blockade of Iranian ports. That's the story the market is trading.
It's not the whole story.
The Strait of Malacca — a 2.8-kilometre-wide passage between Indonesia, Malaysia, and Singapore — carries a quarter of all global trade. 23 million barrels of oil per day. A record 94,000 vessels in 2024.
Here's the number that matters: 80% of China's oil imports transit through Malacca.
Yesterday, the US expanded its military footprint over that strait.
Reports indicate Indonesia agreed to grant blanket overflight access for US military aircraft — across an archipelago that physically sits between the Pacific, South China Sea, Indian Ocean, and Malacca approaches.
Joint naval exercises. Autonomous systems development. Special forces training.
This isn't a handshake photo op. It's strategic positioning.
Read the Board
Hormuz — US Navy blockading Iranian ports.
Bab el-Mandeb — Houthi disruption cut throughput from 9M to 4M barrels/day. Iran now threatening to close it again via proxies.
Suez — Revenues collapsed ~60% from Red Sea disruptions.
Malacca — Monday's defence partnership with Indonesia.
The US now has active military positioning or operational influence over every major oil transit chokepoint in the world.
If you're Beijing, this is a nightmare.
Not because the US will blockade Malacca tomorrow — but because the capability just became credible. In geopolitics, capability is leverage whether you use it or not.
What This Means for Markets
Oil stays structurally bid. The risk premium isn't going away even if Hormuz reopens. The world just learned 20% of global supply can vanish overnight. Now imagine two straits. Or three.
China is the most exposed major economy on Earth. US military influence now brackets both ends of China's energy supply chain — Hormuz where the oil originates, Malacca where it arrives. That prices into the yuan, copper, and shipping rates.
The tail risk nobody wants to write about. Saudi Arabia's East-West Pipeline — the main Hormuz bypass — terminates on the Red Sea. That crude still transits Bab el-Mandeb to reach Asia. If both close, the only route is around the Cape of Good Hope. Add 10-14 days and $1M+ per voyage. Oil at $150 becomes the floor, not the ceiling.
Everything else reprices too. Hormuz didn't just block oil. It blocked 20% of global LNG, 30% of traded fertilisers, and a wall of petrochemicals. A Malacca disruption compounds that across the entire Asia-Pacific manufacturing base.
Follow MacroInsight
This is one thread.
There are dozens running — energy shocks, credit stress, currency regimes cracking, supply chains reconfiguring over years not weeks.
MacroInsight is independent research and media for investors and traders. No fund talking our book. No bank to protect. No agenda except getting the macro picture right.
Geopolitics. Energy. Credit. Currencies. The forces that actually move markets.
Follow @MacroInsight on X.