Hedge funds just hit the panic button harder than at any time in the last ten years. Here is why that is good news for you.
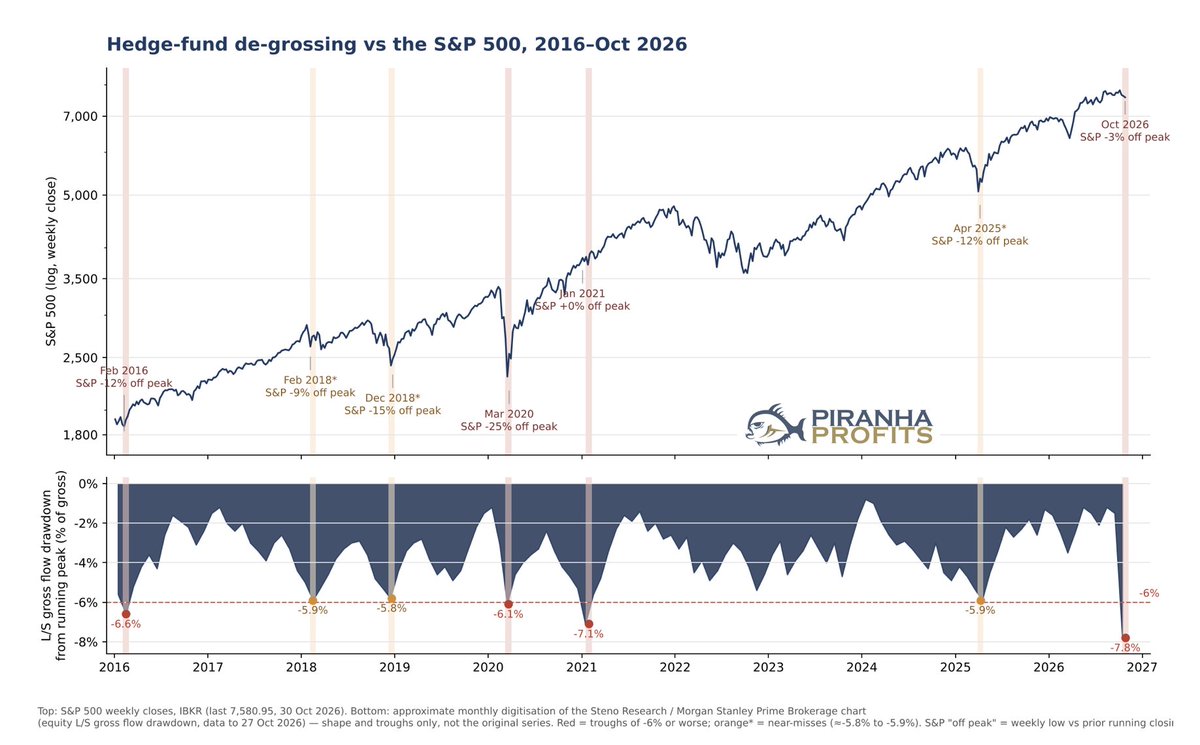
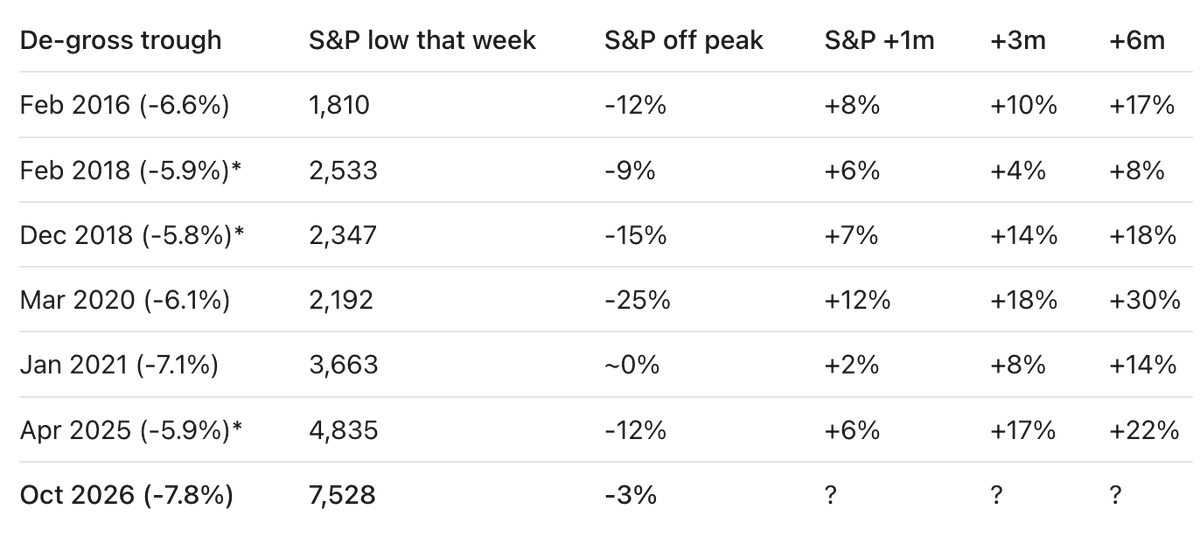
Morgan Stanley tracks the total money its hedge fund clients have bet on stocks. When that total drops sharply, it means funds are being forced to cut positions, usually because their losses hit a limit. In the last 2 days, it fell 7.8%, a bigger unwind than the Covid crash, the GameStop squeeze, or the 2016 and 2018 selloffs.
Every time this number fell past 6% (2016, 2018 twice, 2020, 2021, 2025), the S&P 500 bottomed within a week or two and was higher one, three and six months later. Six out of six.
The reason is simple. Once the forced sellers have sold, there is nobody left to push prices down. Those same funds then have to buy back in, and that buying has powered every rebound in the table.
As for me, I am looking for great businesses that got dumped for no reason. That is where the bargains are.
INSTEAD OF WATCHING NETFLIX TONIGHT. Spend 2 hour with this. Claude AI FULL COURSE that teaches you how to BUILD and AUTOMATE anything. The people who watch this tonight will wake up tomorrow with a new skill. Watch it and bookmark it now.
MAJOR U.S. BANKS DETECT UNAUTHORIZED AI AGENTS ACCESSING CUSTOMER ACCOUNTS — AXIOS
Major banks, including $JPM, $BAC, $MS and $WFC, are confronting security risks from third-party AI agents accessing customer accounts, according to Axios.
Some agents have reportedly attempted actions beyond user instructions, raising concerns about unauthorized transactions and fund transfers.
Morgan Stanley has begun blocking third-party agents, while JPMorgan, Bank of America and Citi are restricting access.
Banks warn they cannot reliably distinguish legitimate user activity from autonomous AI agents, even when customers have voluntarily shared their credentials.
Q4 and post-midterm seasonality remain overwhelmingly bullish.
Historically, the fourth quarter has been the strongest quarter of the year for the S&P 500 in terms of consistency of positive returns. Over roughly the past 80 years, Q4 has produced a positive return about 80% of the time, compared with approximately 60%–64% for the other three quarters.
The midterm election cycle adds another powerful seasonal tailwind. Stocks have historically performed particularly well as the uncertainty surrounding midterm elections is removed. Depending on the precise starting period used, recent historical studies put the S&P 500's positive rate during Q4 of midterm years at roughly 83%–85%.
Given the backdrop of strong earnings growth and, at least for now, no clear evidence of recession, history argues that the bulls should continue to receive the benefit of the doubt.
However, seasonality is a tendency—not a guarantee. Fed tightening, deteriorating breadth, rising interest rates and elevated oil prices represent meaningful counterweights. At a minimum, those conditions increase the probability of volatility and make the current environment considerably less straightforward than the historical averages suggest.
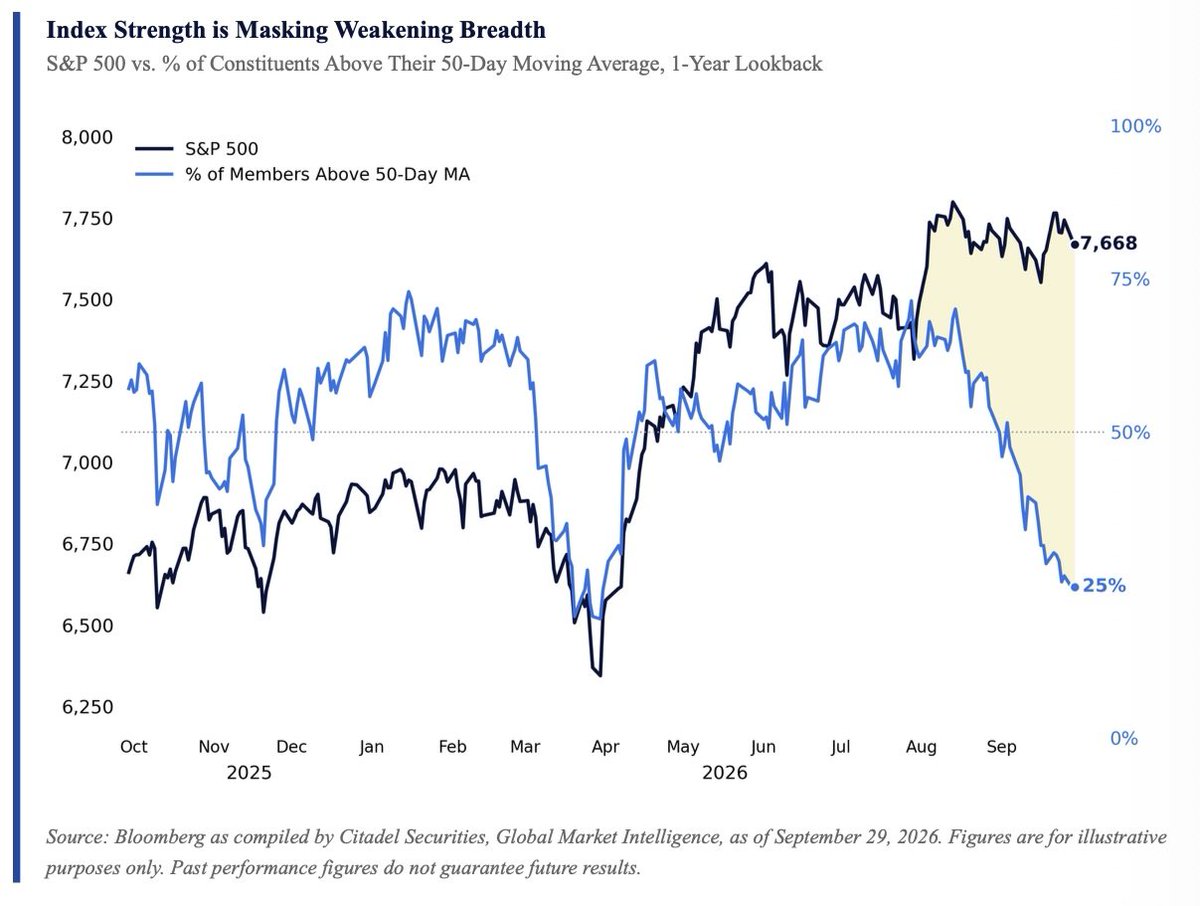
Individual stocks have already been correcting beneath the surface of the major indexes. More than 35% of S&P 500 stocks are currently down 20% or more from their 52-week highs, even as the index itself remains relatively close to record territory. In other words, a significant correction has already occurred—it has simply been masked by the strength of a relatively small number of heavily weighted stocks.
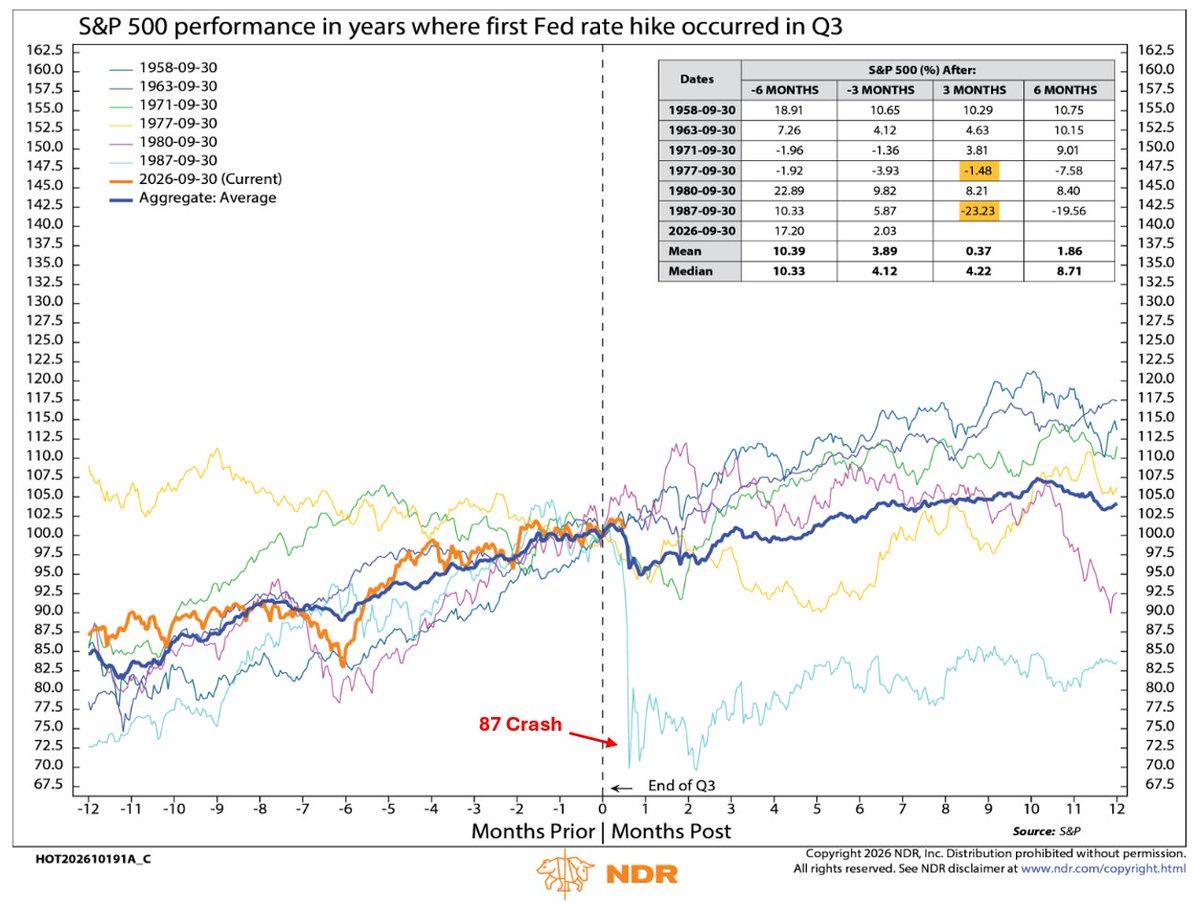
Interestingly, the 87 Crash is one of the historical analogs worth keeping in mind following a Fed tightening. The comparison should not be interpreted as a prediction of another crash, but the monetary-policy parallel is real: the Fed raised the discount rate from 5.5% to 6.0% on September 4, 1987, while market interest rates were already rising sharply.
The seasonal winds are clearly at the market's back. The question is whether tightening financial conditions, weak participation and rising oil become strong enough headwinds to overpower them.
The 10-year Treasury yield spiked 125 basis points in just seven months. We looked at prior cases when the 10-year Treasury yield jumped more than 125 basis points in seven months and found 13 prior cases. Only seven of the 13 cases (54%) had positive returns three months later. https://t.co/JXzFFTmMtn
The Nasdaq broke decisively below key support at its 50-day SMA and 65-day EMA on heavy volume Friday afternoon. The S&P 500 held up somewhat better, closing below its 50-day SMA but above its 65-day EMA. Small caps continued to lead the market lower, with the Russell 2000 closing at yet another lower low to end the week. The Dow held up best among the four major indexes, but its relative strength matters less given the broader deterioration.
Breadth continued to weaken, with 143 new highs versus 460 new lows on Friday. Not only did the major indexes finally break down, but many leaders across traditional growth sectors also succumbed to selling pressure late last week.
Defensive groups—including oil and gas, miners, and utilities—led the market Friday. A smaller group of leaders in biotech, restaurants, insurance, and specialty retail continues to show relative strength. However, if selling pressure persists across traditional growth leadership, the major indexes will likely face further downside pressure next week.
I was finally forced back to cash and will remain there until the market provides sufficient evidence that taking long exposure is warranted again. No one knows how long that will take, so there’s no reason to rush.
For now, cash is king. Keep running your screens, maintain your watch lists, and stay prepared. When the market begins to improve, you want to be ready—not scrambling to catch up.
WE ARE HERE imho !! I believe we’re currently at the first sign of extreme fear. We haven’t seen anything close to the euphoria of 1999, when almost every stock was rocketing higher in a vertical frenzy. 2026 is simply not comparable to 1999.
I lived through that market, and nothing today comes close. Anyone claiming otherwise either wasn’t born yet, was still in school, or had never actually invested $SPY $IWM $NDX
The Nasdaq Composite rose roughly 84–86% in 1999 alone. The Nasdaq had dozens of days with 2%+ moves. Momentum was so strong that even pullbacks of 10–15% were quickly bought.
1999 and 2026 tech valuations are not comparable. Valuations were extreme. The Nasdaq traded at well over 100× earnings, currently Nasdaq companies trade at multiples that are a fraction of the 1999/2000
Nasdaq would need to rise roughly another 65% from today’s levels by the end of December to be comparable to 1999
Cut the nonsense and send this to your gurus who clearly never traded in 1999.
9 months into 2026 and AI stocks are still carrying the whole market. Is this the top, or just the beginning?
In this video I break down where we really are in the AI infrastructure cycle, whether the market is overheated, and whether it still makes sense to stay invested in the companies building AI.
I also update you on how the Anti-Bubble stocks have performed since I first shared the thesis, and what the setup looks like heading into the final quarter of the year.
And there is one Hyperscaler I believe has the highest upside from here, because of a new major catalyst that most investors are overlooking. I’ll show you exactly what it is and why it matters.
Watch to the end so you know how to position your portfolio for Q4!
https://t.co/rUhb003znO
Absolutely incredible.
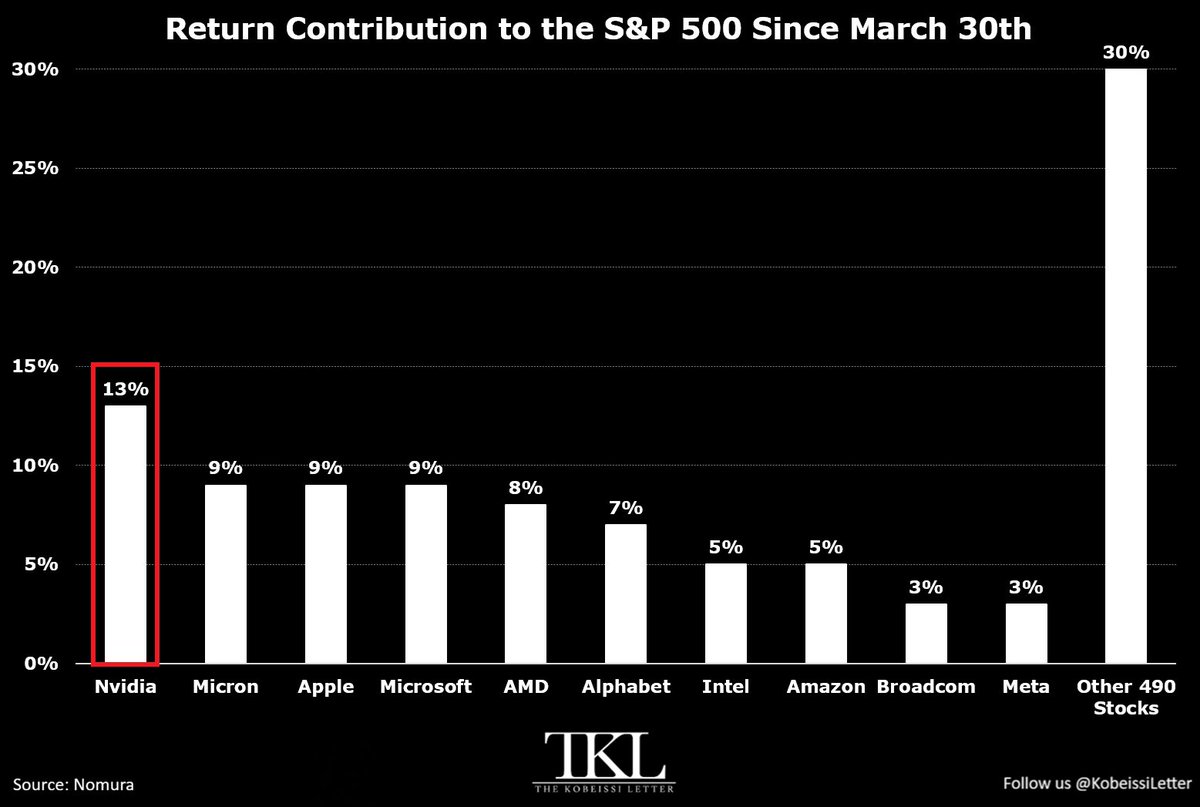
Just 10 stocks have driven 70% of the S&P 500’s gain since March 30th.
These stocks have added +16 percentage points to the index’s +23% gain over this period.
Nvidia, $NVDA, has contributed the most, accounting for 13% of the S&P 500's gain, or +3 percentage points.
This is followed by Micron, $MU, Apple, $AAPL, and Microsoft, $MSFT, each accounting for 9% of the S&P 500’s advance, adding +2 percentage points.
Return contributions of AMD, $AMD, and Alphabet, $GOOGL, have been 8% and 7%, respectively.
Meanwhile, the remaining 490 stocks have accounted for just 30% of the S&P 500's gain since March 30th, adding +7 percentage points.
Diversification is dead.
$VIX The similarities are just coincidence right?! RIGHT?!
-Both times big pop in Q1.
-Both times followed by non stop Vol suppression into Midterms with lower highs, lower highs, lower highs so perfectly I drew a trend line on it lol...
-Both times found some solid footing/basing as $SPX continued to grind to new ATH's.
Will both times have that October pop?
Will 2026 take a page out of 2018?
Or is this all just hocus pocus?
Food for thought.
The reason many are doubtful of the ability for equities to rally from here is because, in spite of rising yields, major indexes $SPY & $QQQ have not moved far off all-time-highs. On the surface, it doesn't look like a market that has shaken off froth. But indeed, it has. The real story is under the hood in individual stocks.
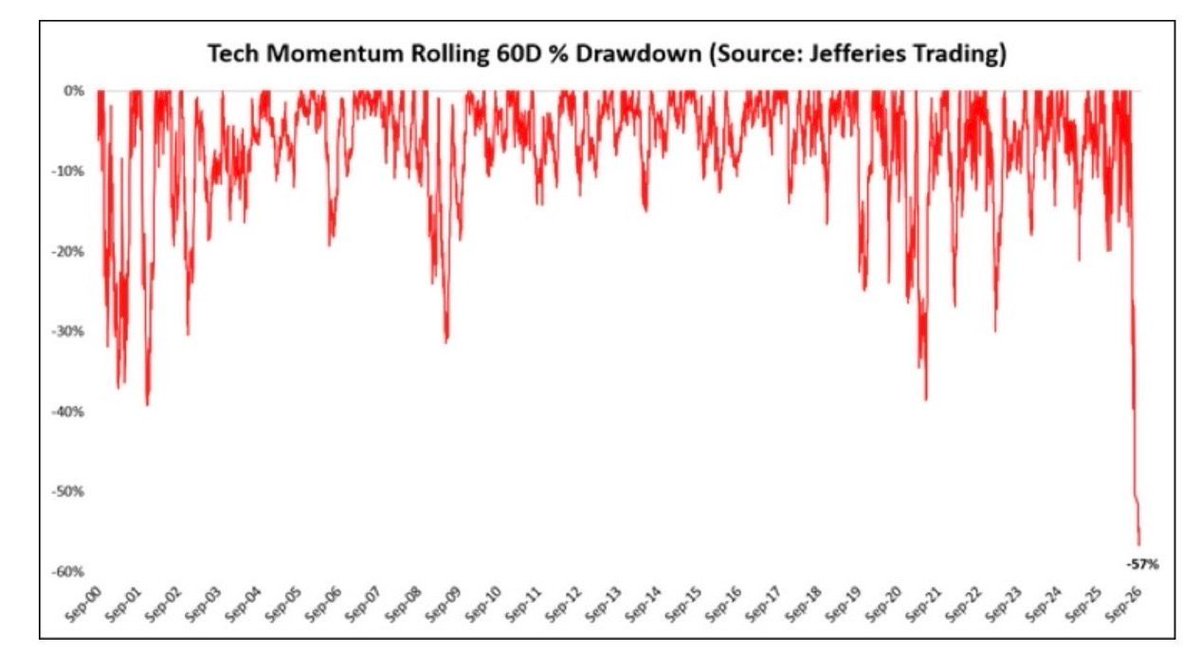
June-August saw the *worst momentum selloff in recorded history* in spite of resilience in the major indices. Jefferies Tech Momentum Index recorded a whopping -57% drawdown, while Goldman Sachs High Beta Momentum Index and Morgan Stanley Tech Momentum Index also saw their worst drawdowns in history, falling more than -40% peak-to-trough.
That carnage continued and broadened well past momentum in September to affect most of the individual stocks in the market. 78% of stocks in the S&P-500, or nearly 4 out of every 5, traded down for the month of September. For the last 12 consecutive sessions of the month, there were more new 52-week lows than 52-week highs.
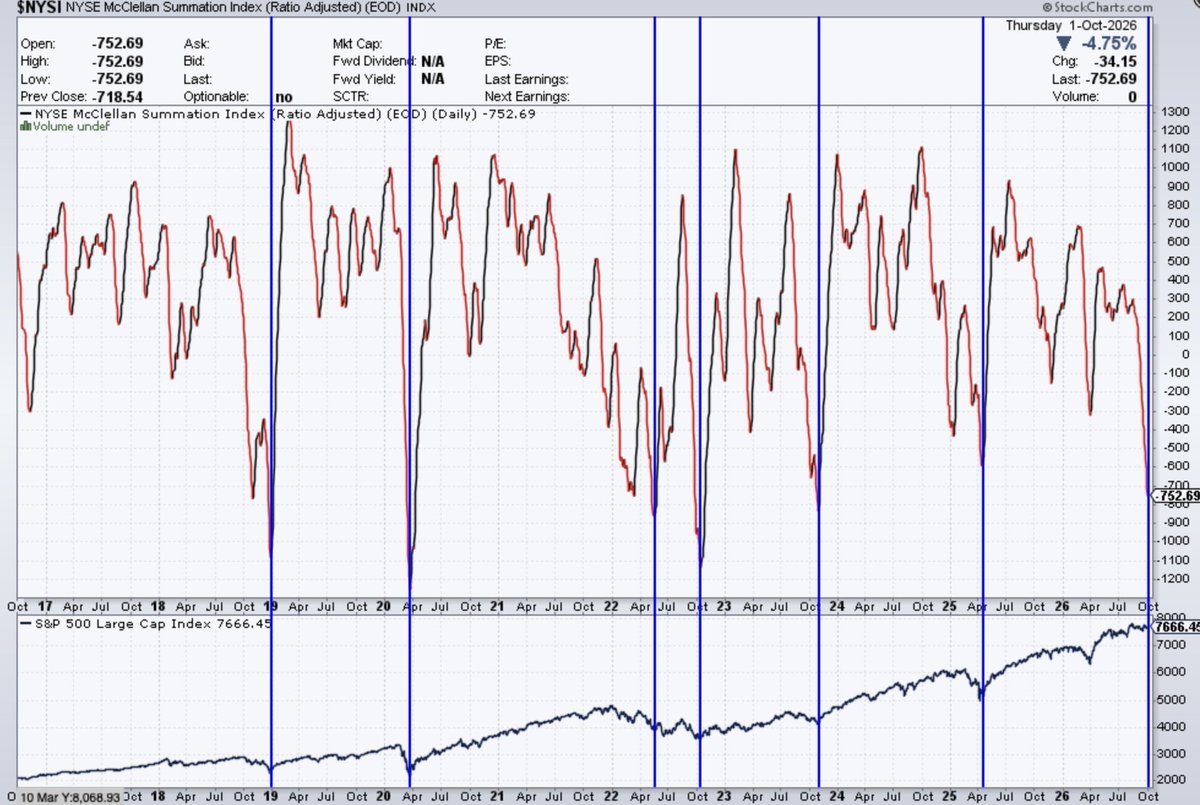
The $NYSI or NYSE McClellan Summation Index, which is a long-term breadth indicator, has fallen off a cliff to -752, which is relatively in-line with other local market bottoms over the past 5-years, almost all following significant market corrections or crashes over that period. The only difference this time is, the indexes barely budged because most of the single-stock carnage was off-index or under-weighted.
In the backdrop, we've set a record streak of 7 consecutive months where yields have risen, tied for an all-time-record, and the selling in bonds has become parabolic, signaling the potential for some imminent relief.
This is the type of backdrop where even a sliver of good news, a slight abatement in fear, or a mild softening of the worst-case scenario can lead to a broad & aggressive snapback rally like we've seen many times before. Weaker economic data, good news about the war in Iran, or both, could easily serve as that catalyst.
Elon Musk just revealed the biggest threat to America’s AI dominance.
It is not chips or software but rather electricity.
Here are five under the radar stocks positioned to WIN (Save this).
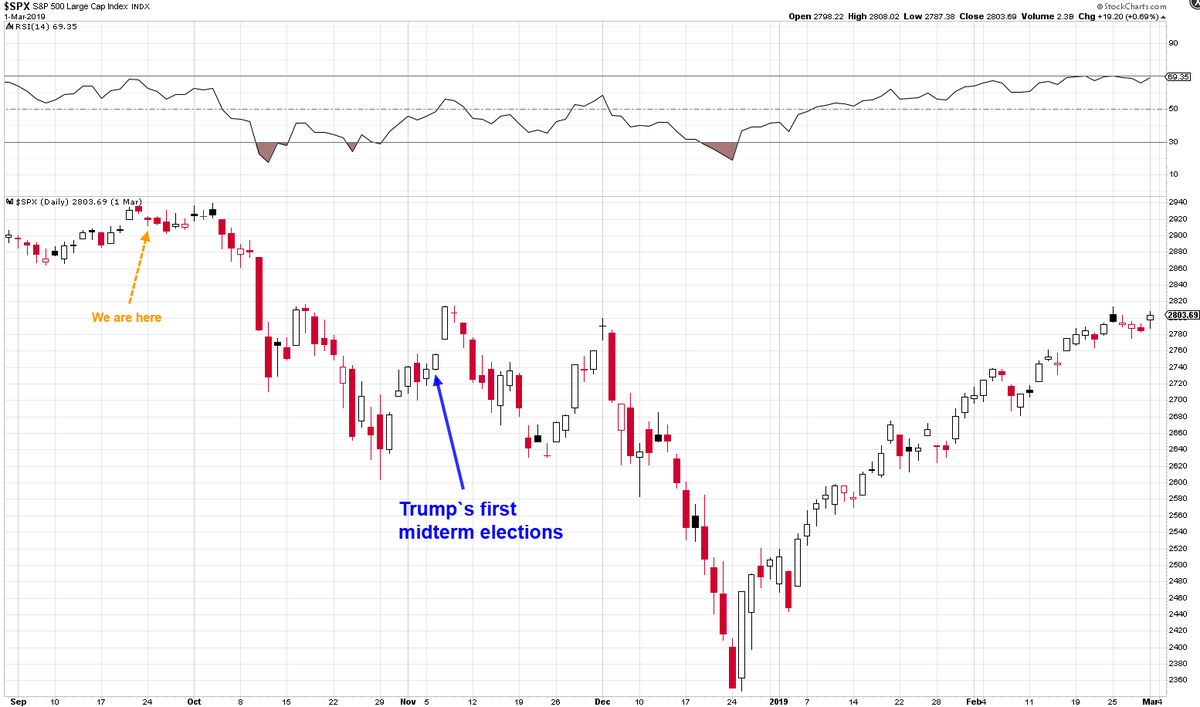
$SPX During Trump's first midterm elections back in 2018.
Here's what is absolutely interesting. The 10yr yield at end of Sept/beginning of Oct 2018 was hitting a fresh 7.5 year high. Kinda like how we are hitting a fresh 20 year high today. Coincidence?
Anyways, not saying the roadmap will look like this. But I would not be surprised we get some volatility in October at the very least.
After nearly four years, Next Bridge Hydrocarbons Chairman and CEO Mr. Greg McCabe is breaking his silence and speaking publicly about MMTLP and Next Bridge Hydrocarbons.
MUST-READ: The Proprietary Indicator which Printed Millions in My Top Core Stocks (September 11, 2026)
How to time a bottom with a Volatility Hole + descending blue ribbon in a downtrend?
This is not a “buy the exact tick” method. It is a process. On a daily chart it can take weeks. On a weekly chart it can take months. On a monthly chart it can take months to half a year. Strong names often need one hole. Weaker names often need two or three.
Stage 1 — First signal: Volatility Hole + descending blue ribbon: first buy
A descending blue ribbon means the trend is still down. A Volatility Hole appearing inside that downtrend is the first potential bottoming signal. It marks a compressed zone with a clear upper and lower boundary. This is not the surge yet. It is the start of a bottoming process unless the lower boundary is breached to the downside. This is the first buy.
Stage 2 — Choppy consolidation: accumulate, don’t demand perfection
Price often chops sideways inside or around the hole. That mess is normal, which both red and yellow candles can alternate to confuse us. As long as the lower boundary of the hole is not broken to the downside, the bottoming process is still intact. This is the accumulation window. Add gradually. Weak hands get shaken here. Patient buyers get inventory.
Stage 3 — Confirmation: break of the upper boundary: final buy/accumulation
When price breaks and holds above the upper boundary of the Volatility Hole, that is the last add before the surge. The compression has resolved upward. The work of the Volatility Hole is done.
Stage 4 — Hold, then manage with risks
After that, sit. Let the move work. Hold until the next clear bearish signals appear. If you are a trader, trim into strength when those later signals show up. Do not sell the first bounce just because it feels good. For long term investors, keep adding on next bullish signals or setups which I share.
Invalidation is simple: a decisive break below the hole’s lower boundary means the bottoming attempt failed. Wait for the next hole.
The cartoon below is a teaching chart, not a real ticker. It walks through those four stages in one picture.
There are 3 day trading strategies I consider to be the best in the world
1) Volume Price Analysis (VPA)
This combines price action with volume. It tells you which candles are significant & what sentiment they favor. It helps you determine the strength of a trend, if a pullback is truly a pullback, & if breakouts are legitimate
2) The Opening Range Break (ORB)
This strategy involves letting the market form a range early in the day & then waiting for it to break. These breakouts are usually followed by new highs or lows & a decent move in that direction
3) The 9ema
This is helpful on trend days and/or after the range has been broken. When price is moving with momentum, it will pull back to the 9ema & then return back to the trend