Can we talk about Jalen Brunson and how ludicrous it is that he is not THE American sports media superstar? He is American born. Dad played professionally. Was an ELITE college basketball hooper. Now he’s leading the Knicks to maybe their first title since 1973?????
According to advanced GDP data, looks like we spent $80B/yr more on fuel in March vs. Jan and Feb. This was during a price rise of 34%, which took about half the month to stabilize at new level. April is flat, so estimate about $120B/yr, or 0.4% of GDP at these prices (0.08% GDP realized or $20B).
Seems significant, no?
This is equivalent to 0.54% of total personal consumption expenditures (PCE).
The PCE annual rate only increased about 0.11% in the month of march. So if consumers bear all of the brunt and there is no demand destruction from higher prices, we should expect PCE to go up 0.4% YoY just from fuel costs for April.
Consumers only use 8.9M barrels out of 21M barrels per day, so commercial use is larger. They are in the hole $163B/yr or $27B realized. Corporate profits for 25Q4 were $4352B/yr, so the current cost of fuel has already had a 0.62% impact on corporate earnings. Every month this grows by 0.3%.
Now this is where it gets fun. If this pricing were to last for a year, this would drop earnings growth by 3.7%. Historically, S&P500 earnings grow about 12% a year during good times, so a nearly 4% drop would be quite divergent from the current rocketing estimate (due to AI capex).
If they pass this onto the consumer completely, it would lower the personal yearly savings from $913B in February to $630B, or a rate of 2.64% down from the current 3.6%. This is pretty close to where things broke during the GFC and the bottom of Covid shutdowns.
But we were already headed down before the oil shock, as savings rates dropped from 5% down to just under 4%. Without the oil shock, we were on track to get to 2.6% savings rate around January 2027. If you add in the higher cost of fuel, this moves the timeline up to about September of 2026.
By this point, consumers will have to start marking things to market, which will put strain on credit markets that are very much relying on not doing that. Banks in particular are already looking to try and offload their AI datacenter loans to keep their books in order, and most of the GSIBs are already pushing up against the SLR leverage limits (one has exceeded them).
Meanwhile, primary season will be ongoing throughout the Summer, and I suspect Trump is keeping an eye on anti-Trump challengers within his own party, turnout, etc as people look for bellwethers for the fall.
If I wanted to game this out further, I think the AI labs will have trouble raising enough capital to thrive into September as well, which will crush the current earnings narrative based mainly on the imaginary valuations of holdings in AI labs. Add on top of this the fact that the housing market is really starting to fall over in large parts of the country, as people can no longer afford to pay the increases in insurance and taxes (I have seen a ton of price drops in my area of Texas). Seems like this fall is stacking up to be a wild ride.
Anyway, I just wanted to get a sense myself of what the impact of the oil shock is for us, and game out some of the implications. Hope you found this helpful to you too.
We talk about these topics as well as financial market mechanics on our little podcast we do for fun called Volstars. You can find links to it on the @GammaStr1ke account, if you care to listen. We currently have one listener, so you would be number 2.
In 2017, the government cut the corporate tax rate from 35% to 21%. Corporations promised to raise worker wages with the savings.
Here’s what they actually did. S&P 500 buybacks jumped 55% in one year, from $519 billion in 2017 to $806 billion in 2018. By 2024, buybacks hit a record $942.5 billion. Goldman Sachs projects they’ll cross $1 trillion in 2025. Every dollar of buybacks inflates the stock price. The top 10% of Americans own 87% of all stocks. The bottom 50% own roughly 1%.
So the government cut taxes on corporations. Corporations sent the cash to shareholders. Shareholders were already the wealthiest people in the country. Then the government said “we’re all in this together.”
Run the scoreboard. Workers’ share of GDP hit 53.8% in Q3 2025, the lowest since the Bureau of Labor Statistics started tracking in 1947. It was 70% back then. Fortune 500 profits hit a record $1.87 trillion in 2024. The top 1% now hold $55 trillion in wealth. The bottom 50%, all 66 million households, hold $4.1 trillion.
The gap between corporate profits and worker compensation as a share of GDP is now the widest since World War II. Airlines are building $25,000 first-class suites while McDonald’s sells $5 value meals. Both rational responses to the same economy splitting in half.
The meme is a period drama. The Federal Reserve’s data from last quarter says the ratio is generous.
The country simply doesn’t function anymore. This is Republican rule, economic crashes, tax cuts for the rich, cuts to services, new wars in the Middle East. Every. Single. Time.
The cardinal sin of economics as a field is it is a theory in search of a reality. The Fed dual mandate is based on the data below being a highly correlated straight line (The Phillips Curve). It's an uncorrelated mess.
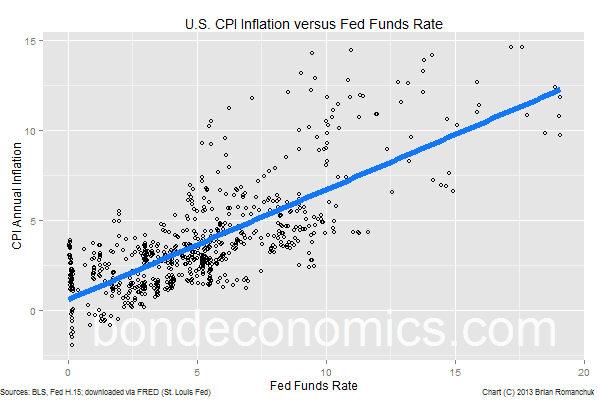
But what about rates vs inflation? Surely that matches? Nope, another mess. Take the data below about 5% and the correlation is literally zero. Worse, take the data above 5% and that correlation is basically zero too. All we know is that if the fed raises rates enough to break something, it will stop inflation.
Then there's the input data to the Fed. It's also noisy and riddled with errors. Survey's that lack accuracy and precision, but perhaps at least showed a trend before Covid radically changed the makeup of who took the surveys.
Consumer sentiment? You want to know why that is even measured? It's a fudge factor that economists crammed into the Phillips curve model to try and salvage the wreckage when it failed in the 70s. Now, even though US consumers spend 95% of their disposable income no matter what, meaning their demand is INDEPENDENT of their views on inflation, we dribble spit onto our shirts with our eyes wide every time the Fed says it's all okay because "inflation expectations are well anchored."
Let's talk about CPI. It claims medical costs dropped in 2023. Dropped! And when housing is high, they discount it arbitrarily with arguments that it is lagged. A fancy way of saying "I will discard outliers until reality fits my bias."
I get it. It's really hard to try and neatly model and predict how centralized decisions affect complicated human systems. My criticism is not that you are not good at it. It's an impossible task. My criticism is that you think you can achieve it, when it's so clear you cannot.
Federal Reserves meddling in markets will never have the effect of stability. The Fed is naturally a destabilizing force. And no amount of data is going to change that because the data is too delayed, and too noisy.
Focus on liquidity in the banking system and abandon this ham-handed fantasy of controlling markets. Even Warsh is probably not skeptical enough.
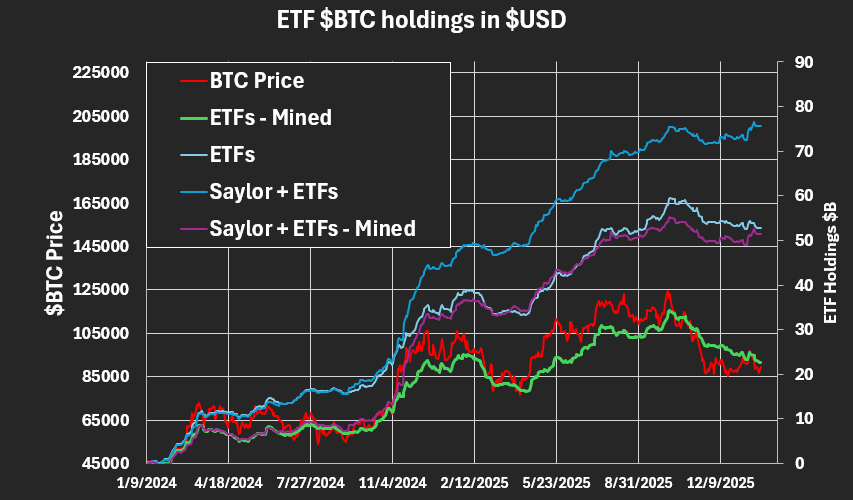
Things are looking more and more grim for $BTC ETF holders. While holdings have been roughly flat at around $53B since June '25, price has dropped around 30%. Even Saylor buying ham-handedly cannot stop the drain. The drain largely comes from mining, which has mined about 60% of all ETF deposits since inception. If investors ever go to collect their $53B, they will find only $23B remaining.
The break even price on ETF holdings is around $81K per coin. Saylor break even is around $76k. As far as an investment goes, the returns have been a flop. If $BTC drops below $80k, I expect investors will start looking for the exit, and find that the money has already been largely mined away.
There are few speculative risk assets you can invest in that will dilute holdings by roughly 30% per year. Unless $BTC can find a use case to justify this maintenance cost, it is all but assured to collapse. Currently, the only durable use case has been greater fool theory. Are they running out of fools?
You can estimate the long run price of $BTC if you assume most of the fund flow now occurs in ETFs, which has largely appeared to be true. Then average flow into ETFs minus the mine rate gives you an equilibrium price. The monthly average equilibrium price has been $0 for about 20 days, signaling that flows are too low to sustain price. Yearly average looks better at $120k per coin, but that's down sharply from $250k per coin a few months ago, signaling how fragile this ecosystem really is.
Yes, Elon. I do lack "any sense of adventure" when that "adventure" will, as you have made clear, force tens of millions of workers out of their jobs.
The goal of AI and robotics must be to improve life for all people, not just to make you and your fellow oligarchs even richer.