British economy snapshot over the last 4 years:
Gas: +94.1%
Electricity: +78%
Fuel: +49.3%
Airfares: +34.4%
Hotels: +37.8%
Groceries: +25.0%
Eating out: +26.5%
Baby food: +26.3%
Dog food: +58.1%
Rent: +25%
Used cars: +30.5%
Public transport: +18.7%
Real average weekly earnings: -2.8%
The UK population is being killed
Source: ONS
Dear Rachel,
You forgot these…
unemployment – UP
Illegal immigration – UP
tax burden – UP
public sector borrowing – UP
nhs waiting lists – UP
inflation – UP
energy cost pressure – UP
council tax – UP
business insolvencies – UP
regulation / quangos – UP
welfare spending – UP
public sector pay bill – UP
net zero cost commitments – UP
asylum claims / backlog – UP
Social housing back log - UP
Shoplifting - UP
Early prisoner releases - UP
You’re welcome.
So the minimum wage just went up and the government is very proud of itself.
Here is what they are not telling you.
Your wage goes up. Your tax goes up. Your National Insurance goes up. HMRC takes its cut before you see a penny of that £1,500.
Now your employer is paying more for every single person on their books. They are not absorbing that. Nobody absorbs that. So prices go up.
The coffee you buy on the way to work costs more. The lunch you grab costs more. The haircut costs more. All of it costs more because the people serving you are now on higher wages too, and their employers did exactly the same thing.
So you got a pay rise, and everything got more expensive at the same time. Almost like it cancelled out.
If they actually wanted workers to keep more money they would cut their tax. That's it. That's the whole idea.
But that would mean the government collecting less. So instead they raise the minimum wage, taking a cut on the way in and benefit from the price rises on the way out through VAT, and call it a historic day for working people.
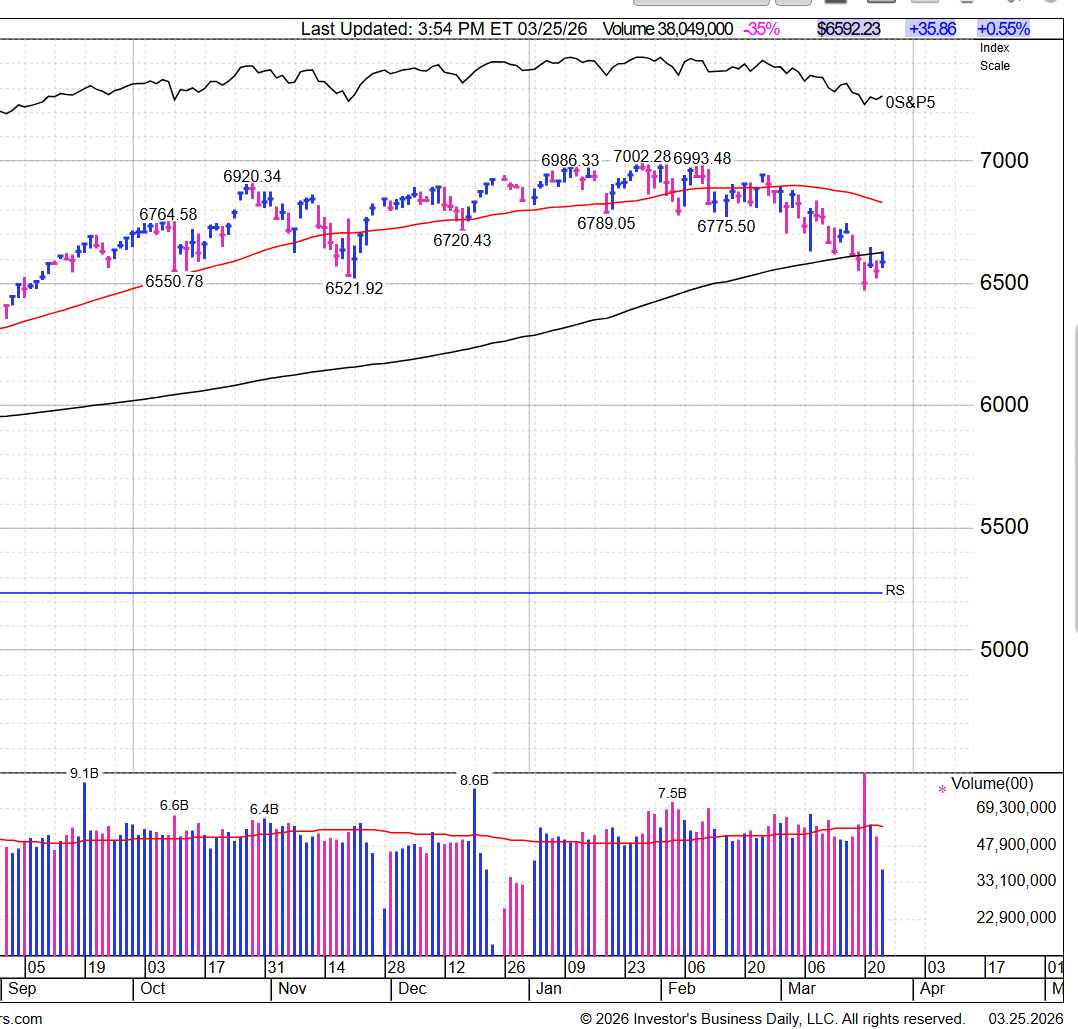
The market's character is still one of a bear market or cyclical correction; strong open, fade into close and major average living below the 200-day line. Before a reliable bottom can be established, we need to see better price and volume action, including better action from breakout names forming bases.
We are clearly NOT out of the woods yet. The market backdrop is one where sentiment has improved with rising pessimism, but not a full capitulation. The VIX has reached bear warning levels, but remains below true washout extremes. A volatility washout is not required for a bottom, but would add conviction.
Bullish Scenario
--The war ends
--Oil prices recede
--Stagflation concerns ease
--Central banks continuing their easing trajectory
Under this scenario, we would expect:
-A broadening market advance
-Emergence of new leadership from sound bases
-A Follow-Through Day (FTD) on the NYSE and/or NASDAQ confirming institutional buying with little in the way of immediate distribution
-Significant drop in volatility
Bearish Scenario
--The war persists or escalates
--The Strait of Hormuz remains disrupted
--Oil prices make new highs
--Stagflation becomes evident in hard economic data
This would likely result in:
-Limited general market rally attempts with most breakout stocks failing
-Lack of follow-through from breakout names
-Further deterioration in breadth and leadership
-Dearth of setups in buyable position
-Continued elevated volatility and distribution
In that case, sentiment would likely need to reach higher levels of pessimism before a durable market bottom could form. In its absence, and end to the factors that are pressuring the market could cause the market to bottom in less dramatic fashion.
This can't be right. Starmer & Reeves promised the biggest growth in the G7 to get into power.
This is the manifesto pledge:
''Secure the highest sustained growth in the G7 – with good jobs and productivity growth in every part of the country''
@StratLaboratory Hi Nigel,
Would you mind sharing what the indicators are in the lower panels? Particularly the coloured dot matrix and the volume-related panel beneath it — they look really useful for Strat-based analysis.
Thanks in advance! 🙏 #TheStrat
3-21-26 The Truth About This Market Selloff
Despite ongoing war in the Middle East, this selloff isn’t a crash but a normal correction after a massive run we had, driven by valuation reset and unwinding of speculative excess.
Markets regularly pull back 5–10%, especially after strong gains.
Fear narratives miss the point—corrections end eventually.
The real edge is staying disciplined, managing risk, and being ready to deploy capital when opportunities emerge as valuations normalize and conditions
stabilize.
If you like this video, please ❤️like and 🔁retweet
Rachel Reeves praises Canada and Norway for increasing their oil and gas production…
…whilst BANNING new production in Britain.
Labour support foreign oil and gas industries more than our own.
One of the worst things you can do as a trader is strategy hop. Every setup has losses. If you keep switching strategies every time you lose, you’ll never master anything. Pick a setup, study it, and execute it over and over .... consistency comes from repetition not constantly changing strategies.
Dropping my newest, clear cut Stratucation course.
The first one I made in 2019. My production and confidence got a lot better over the years so I remade it.
It's short and sweet! Enjoy!
Learn how to trade #TheStrat like we do!
https://t.co/2s72ngjwpY
Twenty FTSE 100 stocks have risen 50% or more in past year propelling index, +1.2% yesterday & 8.6% this year, closer to 11,000. The 'Tasty 20' is led by gold & silver miner Fresnillo, +448%, alongside other diggers, defence groups & banks @thisismoney.
https://t.co/cm5zibVvDz
📈 The SIMPLEST Way to Read a Stock Chart
Most traders overcomplicate chart analysis with lagging indicators that slow down decision‑making.
If you want true clarity, you need a price‑action system that shows you exactly who’s in control.
That system is The Strat. 🎯
---
🧠 What Is The Strat?
Created by Rob Smith, The Strat is a universal framework for reading price action.
Every candle fits into one of three scenarios, and once you understand them, charts become easy to read and even easier to trade.
---
1️⃣ The 3‑Number Candle System
You only need to recognize three candle types:
1 — Inside Bar
Price stays completely inside the previous candle’s range.
This signals consolidation, compression, and indecision.
Think of it as the market taking a breath. 🛑
2 — Directional Bar
Price breaks either the previous candle’s high or low.
This shows momentum and creates actionable trade triggers. 🚀
3 — Outside Bar
Price breaks both the previous candle’s high and low.
This represents volatility, expansion, and broadening formations. 🌪️
Outside bars reveal where the real battle between buyers and sellers happened.
---
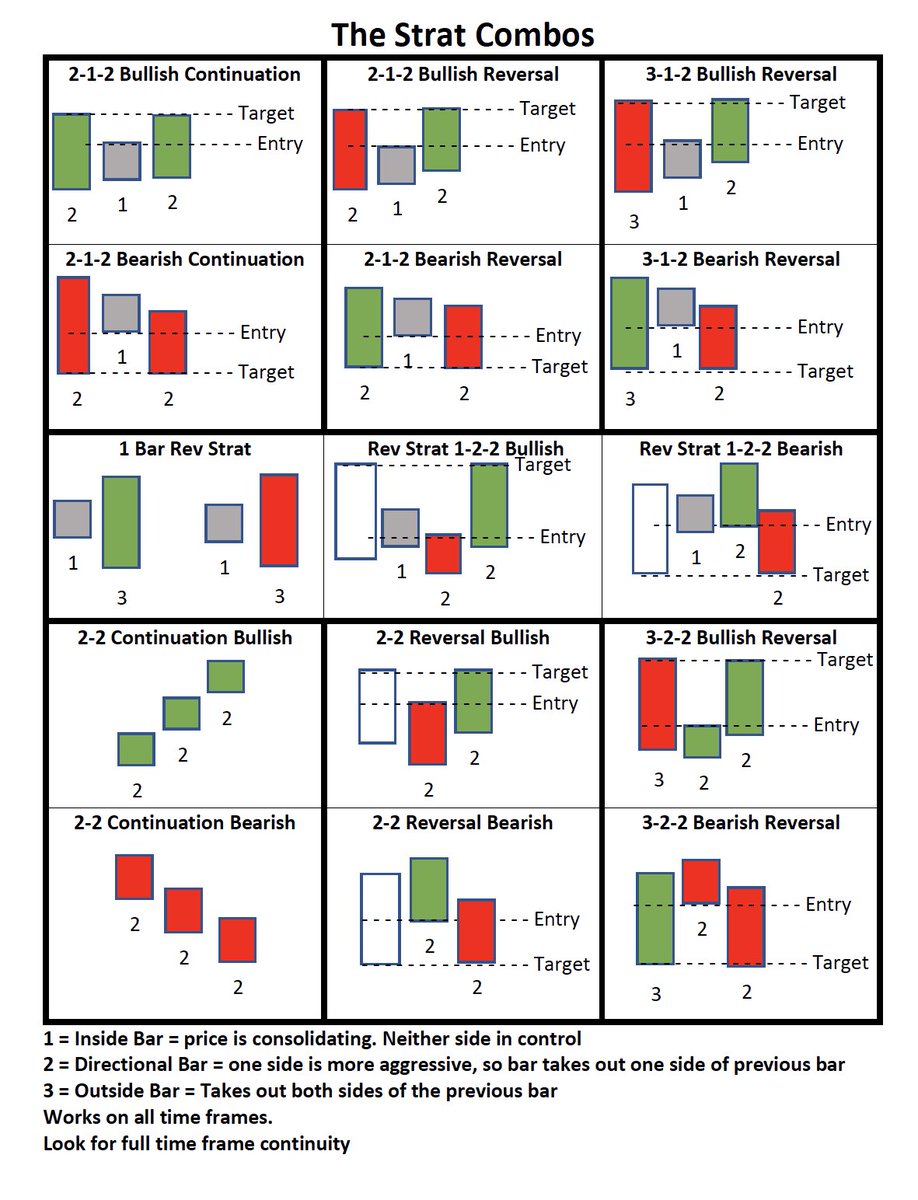
2️⃣ Strat Combos Examples
These candle sequences form the backbone of high‑probability setups:
2‑1‑2 (Continuation or Reversal)
A directional move (2), a pause (1), then a breakout (2).
Clean, reliable, and one of the most traded Strat patterns. 🥪
3‑1‑2 (Reversal)
An outside bar (3) followed by compression (1) often leads to explosive moves once the trigger hits (2).
This is a power pattern. 🧨
2‑2 (Continuation)
Back‑to‑back directional bars.
This confirms the trend is intact and pushing forward. ✅
---
3️⃣ Full Time Frame Continuity (FTFC)
This is where everything comes together. 🌍
The Concept
Analyze multiple timeframes—Monthly, Weekly, Daily, Hourly—to see who’s in control.
The Goal
When several timeframes are pointing the same direction (for example, all “2‑up”), you’re trading with the market instead of against it.
FTFC gives you:
- Higher probability entries
- Cleaner targets
- Fewer fakeouts
- More confidence in your direction
🔁 Retweet for other Traders
🔔 Turn on notifications for more education
#TheStrat @CyberDog2@TradeSniperSara
“Let’s ban new oil and gas drilling in the North Sea but pay Norway £40 billion to import oil and gas from the North Sea. Let’s plaster solar panels on thousands of acres of farmland but have sun dimming experiments in a country that has the fifth least sun hours on the planet.”
Anyone here using TradingView with The Strat — is there an indicator or script that can give a weekly 2U or 2D alert automatically?
Looking for something that triggers as soon as the weekly timeframe goes 2U or 2D.
#TheStrat#TradingView#Failed2Gang