Another indication why this is so similar to 2019-20 mid cycle correction rather than a 2022 bear market.
The MFI has not reset to 20 or below which marks bear bottoms.. But here another big divergence is showing just as it did after the Covid crash..
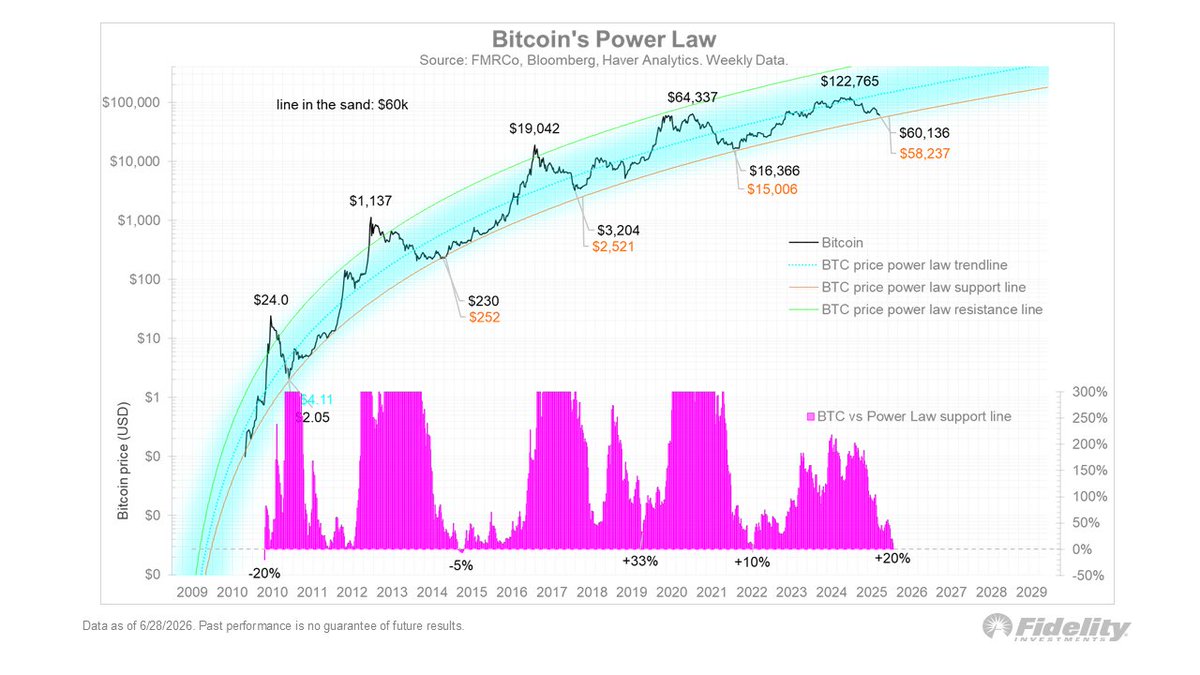
806 days after the halving, $BTC has never been this cheap at this point in the cycle.
At the 57% mark of every prior cycle, price sat at or above the power-law trend:
2013 cycle: +0.06σ
2017 cycle: +0.49σ
2021 cycle: -0.54σ
Now: -1.81σ
The "peak-risk window" arrived and there's no peak.
The 4-year cycle is dead, killed by ETF flows.
This is the cheapest mid-cycle entry ever recorded.
The most bullish Bitcoin chart is the one that keeps grinding higher while everyone stares at the spot price.
The 4-year moving average of realized price is the market's smoothed cost basis.
It is the slow, load-bearing floor under the entire asset, and it is still compounding at nearly 30% a year after a full decade of adoption.
YoY CAGR of the 4Y realized price MA:
2014: $101.47 - baseline
2015: $173.33 - 70.82%
2016: $259.08 - 49.47%
2017: $576.40 - 122.48%
2018: $1,771.46 - 207.33%
2019: $2,954.45 - 66.78%
2020: $4,405.83 - 49.13%
2021: $8,876.68 - 101.48%
2022: $13,246.03 - 49.22%
2023: $17,064.55 - 28.83%
2024: $23,076.40 - 35.23%
2025: $30,521.35 - 32.26%
2026 YTD: $34,345.61 - 29.39%
Read the bottom cluster again.
Four halvings, three "generational" crashes, and roughly 9,000 obituaries later, the smoothed floor still compounds at 30% a year.
The explosive early-cycle numbers cooled off and the metric barely noticed.
Your savings account pays 4%.
The floor under Bitcoin compounds at 30%.
The volatility you keep flinching at is just the entry fee for that seat.
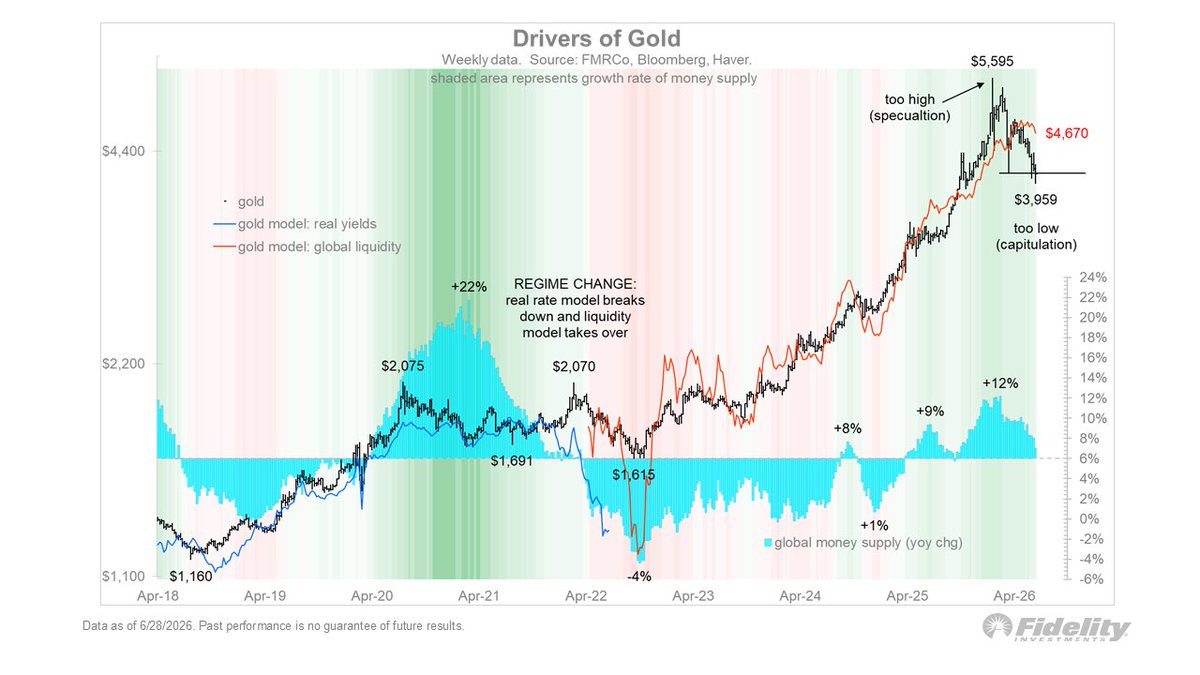
I suspect that gold’s correlated behavior will be temporary as gold has fallen out of favor after it went vertical last year. The fast money used to be in Bitcoin, and then it left for gold, and now it’s chasing semiconductors. The chart below shows how gold’s real rate model fell apart in 2022 when gold became a proxy for global liquidity. With global M2 now slowing from a growth rate of 12% at the peak to 7%, gold is understandably weaker. But it’s too weak considering the modest deceleration in M2.
@BitPaine@ODELLXYZ Remember when "blue check" scolded the less enlightened to "buy the real S*%#, not that fake S*&$"... did he realize that ten31 investing in his perception of a "pure Bitcoin company" with all it's counterparty risk isn't the "Real S*%#"?
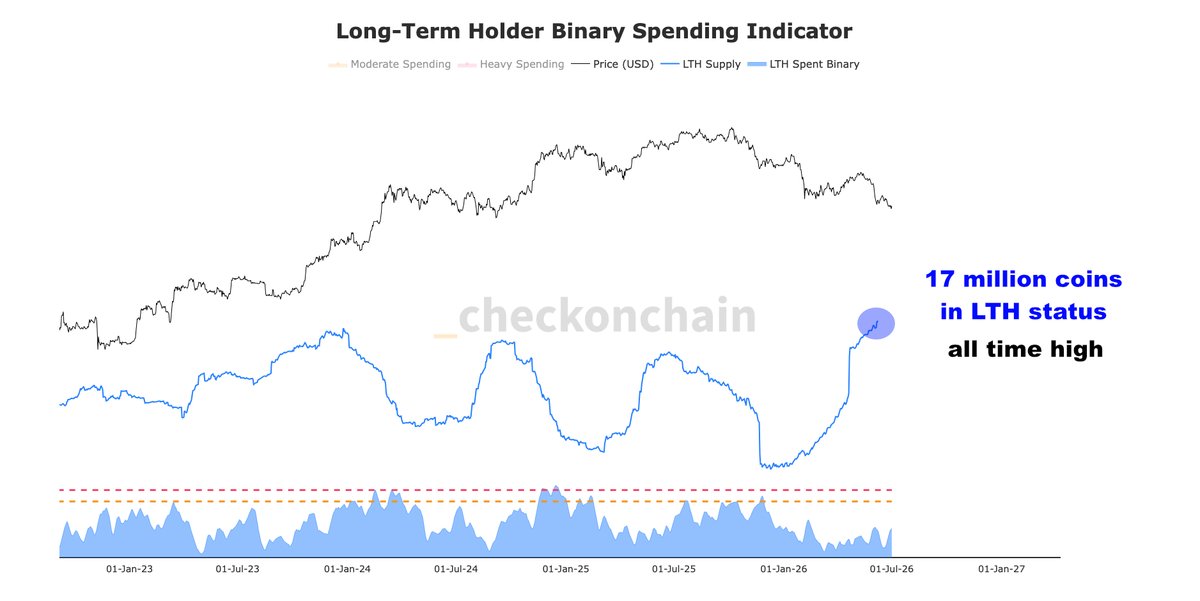
bitcoin is down 50% from its all-time high price, yet the number of long-term holder coins is at an all-time high. this is also with half the supply sitting in loss. bullish.
52% of all Bitcoin supply is now underwater.
That means the majority of $BTC is now priced below its last on-chain transfer price.
This is capitulation.
The same loss-dominant zone appeared near major bottoms:
2015
2018
2020
2022
When the majority of supply is underwater, strong hands typically accumulate.





![david_eng_mba's tweet photo. $BTC: When the P-10 Floor Rises, Cheap Becomes Convex.
$BTC at ~$63.7K:
Spot/P-10floor: ~1.0x
Today’s P-10 floor: ~$63.7K
5-year P-10 floor: ~$267K
Entry ER: 34%/yr
Buy hurdle: 16%/yr
5-year floor calc
Today’s floor: $63,723
5-year P-10 floor: $266,877
Multiple:
Y axis: [266,877/63,723]=4.19x
X Axis: [63K/63.7] = 1x
MT/LT Decision: ACCUMULATE / DEPLOY / CONTINUE](https://pbs.twimg.com/media/HMjq1e2bAAAxZes.jpg)