Although I am attending #AGU virtually this year with a newborn at home, I wanted to share a #climatedataviz web tool I have been working on over the past several months called Climate Data Visualizer. Give it a try at https://t.co/jTc6ZkOShk! A quick 🧵(1/6)
A RECORD HIGH TEMPERATURE OF 86 DEGREES WAS SET AT ST. LOUIS TODAY. THIS BREAKS THE OLD RECORD OF 79 DEGREES SET IN 1981.
THIS ALSO BREAK THE ALL TIME RECORD HIGH FOR THE MONTH OF FEBRUARY AT ST. LOUIS. THE PREVIOUS ALL TIME RECORD HIGH WAS 85 DEGREES SET IN 1972. #stlwx#mowx
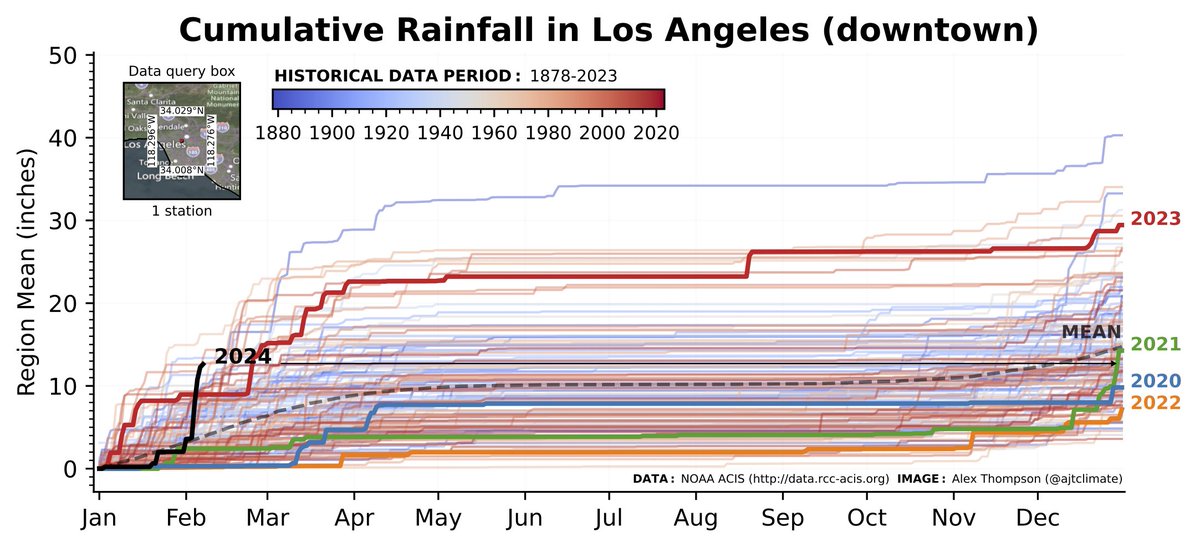
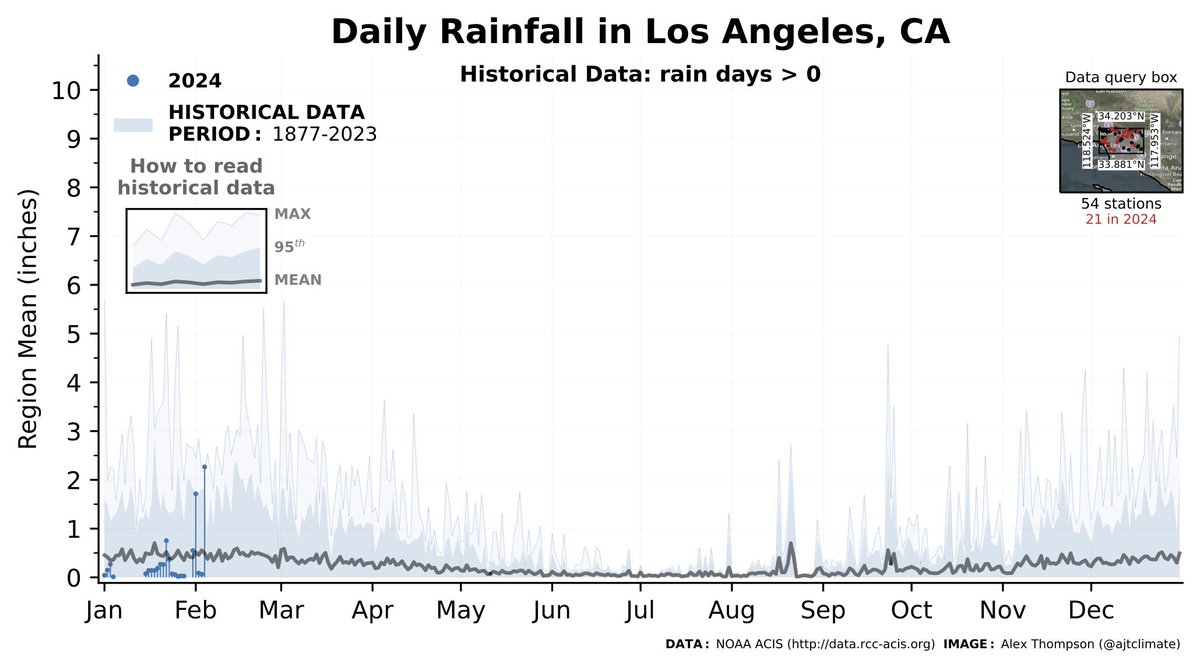
@DrewTumaABC7 From the Los Angeles (downtown) observation station, 2024 only needs ~2.5 inches to exceed the mean annual total. 2024 is several inches ahead of 2023 at this point in the year...
Early estimates show the 24-hr rainfall in downtown Los Angeles (>4 in) as a top-ten daily rainfall event since 1877. See for yourself at https://t.co/jTc6ZkOShk!
#climatedataviz#CAwx
We also see that the region-averaged 24-hr rainfall around Los Angeles was a likely calendar day record, but still well short of an all-time record
#climatedataviz#CAwx
Yesterday (Jan. 22), San Diego recorded a top ten daily rainfall total of all-time. This event led to very intense flash flooding around the city. #climatedataviz
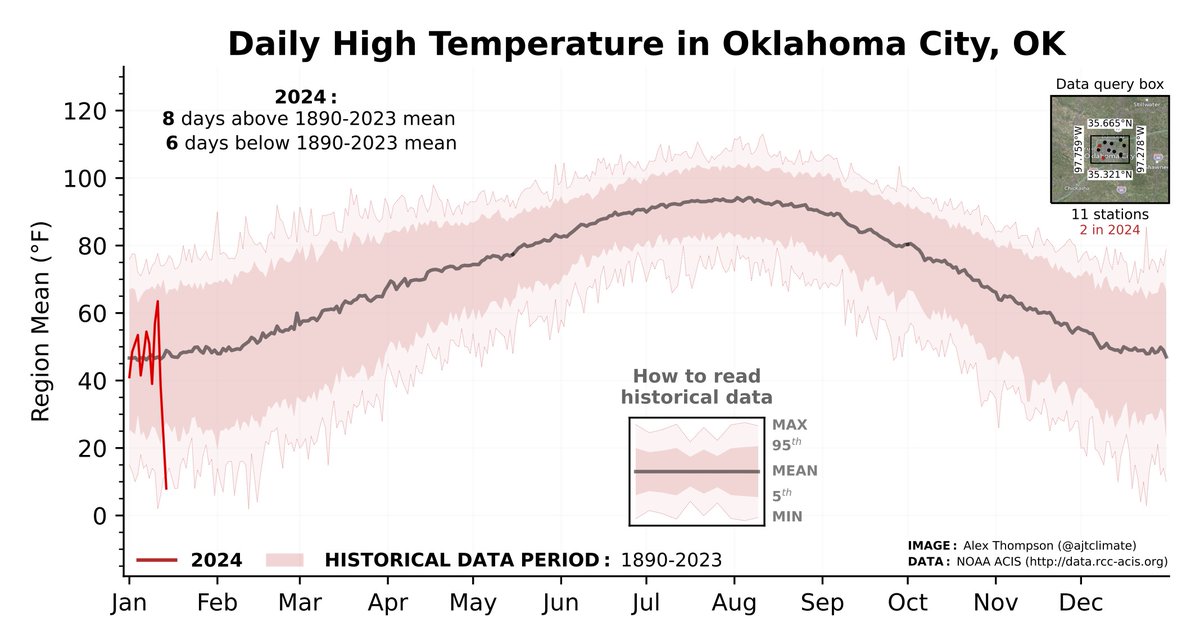
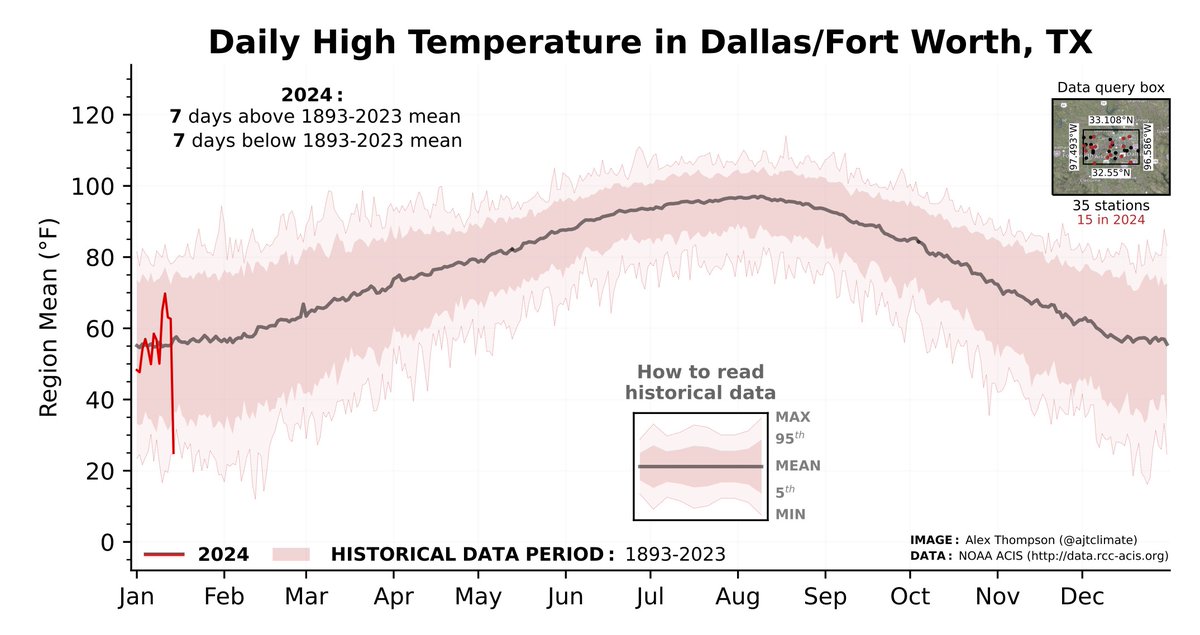
To do so, select “Tmax”, wait for the data to be extracted, and then select “Time Series”. Note, you may need to alter the data quality parameters if your query includes many stations!
With 2023 shaping up to be the hottest year globally in recorded history, explore Climate Data Visualizer (https://t.co/jTc6ZkPq6S) to see for yourself how this record warmth played out where you live!
The last #climatedataviz for #AGU is the August 20, 2023 rainfall event in Death Valley NP from remnants of Hurricane Hilary. This event was the single highest recorded day since 1912 and accounted for an entire year's worth of 🌧️ in a single day
Today’s #climatedataviz example for #AGU is annual rainfall for Western Maui in the years preceding 2023’s devastating wildfire. Some of the lowest annual rainfall totals since 1920 occurred in the last few years, drying out the region and priming it for a severe wildfire.
Alright Geeks, we need your help! ☝️
In your opinion, what was the most memorable weather event of 2023? We may use your answer for a future episode... 👀
Today’s #climatedataviz example for #AGU is the near-record 2023 cumulative rainfall year in Southern Vermont, which includes an extreme rainfall event on July 10-11. The lines are colored by year and show that as the climate warms, total annual rainfall tends to increase.
Today’s #climatedataviz example for #AGU is the 2021 PacNW heat dome as shown in Portland, OR. NOAA ACIS obs show daily high temps on June 26-28, 2021 up to 9°F higher than any previous day since 1874. In fact, the Portland-wide avg from 4 stations topped out at 115°F on June 28!
@mic_grop @raindrop_herder The URL is currently redirecting to a link at WashU. If you see a blank white page at first, please wait a minute for the webpage to load. If it still isn’t working, please let me know
Although I am attending #AGU virtually this year with a newborn at home, I wanted to share a #climatedataviz web tool I have been working on over the past several months called Climate Data Visualizer. Give it a try at https://t.co/jTc6ZkOShk! A quick 🧵(1/6)