This UMAP plot was generated from data simulated without inherent clusters, meaning the observed clusters are artifacts.
It highlights how default Seurat clustering and UMAP settings can sometimes produce misleading patterns in data visualization.
We haven't found sufficiently many use cases for the lab account here, so I'm reverting this (ex lab) account back to my personal one. I'll delete @AGbioDS shortly. If you want to stay connected please use @alexfoldai
💻🦠Join us at the Structural Phylogenetics Symposium at SMBE 2024 in Mexico! Peer into deep evolutionary history through protein structure | ⭐ Submit abstract by March 15: https://t.co/1XJjhwsLeS | ✈️ Apply for travel award: https://t.co/fG3YyMz1fD
AI technology could provide more effective cancer treatments 🩺🏥
UC Associate Prof Alex Gavryushkin has been using AI to analyse biological data to develop better strategies for cancer treatment and save lives.
Read more: https://t.co/CeYnbudpHj
#UCResearch#AITechnology #MedicalTechnology
@AGbioDS @bioDS_lab @UCNZMaths@UCEngineering
I’ve learned from a decade on this app to not accept the superficial way things are presented here, especially when someone’s words are being used against them. And so I watched the whole session for context. And I’m glad I did. Because in context it’s way worse.
When it comes to biosecurity threats, making accurate outbreak predictions is essential so policymakers can speed up decisions. UC’s
@AGbioDS is co-leading #UCresearch to develop algorithms to reduce response times & disease spread: https://t.co/FRYpv2zfjT
Ever wondered what an average of two or more (phylogenetic, gene, species, pathogen transmission, tumor cell, natural language, etc.) trees is? We did two. And we think we have an idea!
Huge congratulations to Lena Collienne @bioDS_lab @UCNZMaths@UCNZ who has scored a postdoctoral fellowship @fredhutch at the brilliant group of @ematsen. Although we're very sad that Lena is departing, we look forward to following your new amazing achievements. Well done, Lena!
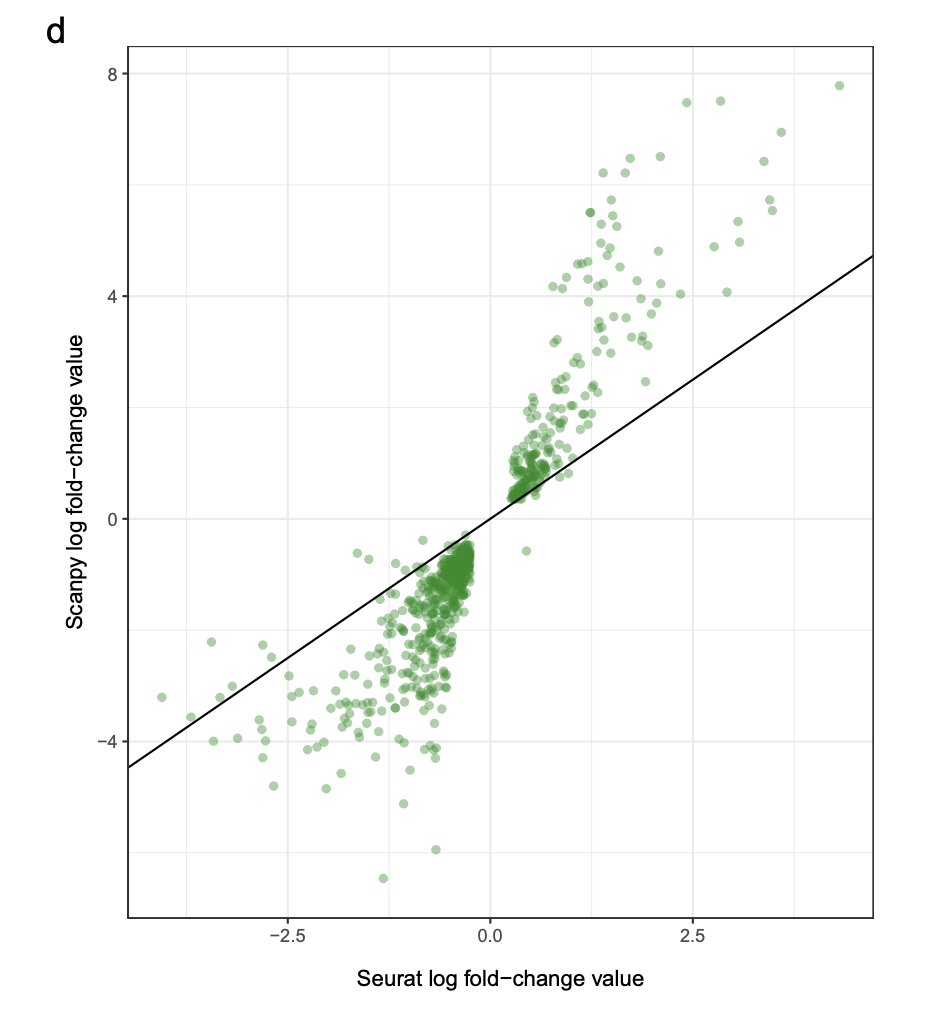
The results of different methods applied to the same scRNA-seq data differ substantially.
This is true even for fold changes, as shown below for Seurat and Scanpy.
The differences between selected transcript "markers" are even larger: https://t.co/pH4Rh3wQZv via @davisjmcc
After soo many years, finally, our beautiful model Tumoroscope is out in BioRxiv! Tumoroscope draws a spatial map of tumor clones in a close to single cell resolution. To do this, it combines H&E, DNA-seq and Spatial Transcriptomics https://t.co/pI5pY6NubL
The rrnni package is on CRAN!
Calculate the distance between ranked or ultrametric trees in the RNNI tree space! https://t.co/l1c9U4MmiZ
#rstats#evolution#phylogenetics