5 models, 80 financial-filing questions each, 400/400.
kimi k3.1 pro (2 days old), minimax m3.1 flash, deepseek v4.1 flash, opus 5.5, gpt-6.1 sol. the two flash models tied opus and gpt.
half sit in ~100k chars of filing. restated columns, tables in thousands, 21 non-english, 10 with no answer (all 50 came back null).
so i went after the test.
no document (opus, gpt, deepseek): 1 of 90 right from memory. another company's filing (opus, gpt): 0 of 60.
all 80 are hand-picked from xbrl-tagged filings, truth read off the tags. the next set runs on the companies' own pdfs.
anthropic made $974M of operating income in Q2 2026 and still lost $80.7B in the half year. $72.4B was the fair value markup on its convertible notes, derivative liabilities and SAFEs as its valuation rose. $8.8B more was other expense, mostly tied to note purchase agreements
@Kalshi employees will get their own class too: Class E, issued to employees excluding the co-founders, votes only on certain limited matters and has no economic rights
@KobeissiLetter $72.4B of the $80.7B loss is the change in fair value of convertible notes, derivative liabilities and SAFEs. the operating loss was $693M on $16.3B of revenue, H1 2026, unaudited
@zerohedge one blank worth watching in the same filing: purchase commitments and leases, "substantially all" compute and infrastructure, total "aggregate committed spend of more than $ ," with no number yet
@AnthropicAI the line i'd watch in the S-1: compute and infrastructure went from 2.0x revenue in H1 2025 ($2.3B on $1.2B) to 0.55x in H1 2026 ($8.9B on $16.3B)
@DeItaone it's billion. the S-1 table is in millions: net loss (80,748) for H1 2026, unaudited. $72.4B of that is the change in fair value of convertible notes, derivative liabilities, and SAFEs. the operating loss was $693M on $16.3B of revenue
@waitingdanger@edinsoncode the sandbox mode matters a lot there. in our run codex exec with the read-only sandbox blocked the write. do you know which mode the 90% was measured in? workspace-write or full access would explain it
@edinsoncode tested it yesterday with a harmless marker, one run per setup: claude code 2.1.310 in auto mode ran the planted setup line in 2 of 3 setups. default mode blocked it, but only because the path was outside cwd. codex exec's read-only sandbox blocked it
method: gs_quant.timeseries.zscores(close, 20). enter next close after z<-2; exit at z>=0 or after 20 trading days, 10bp a side. baseline assumes execution at the same close that triggers the exit: +1.06% across 65,714 trades. next-close exits: +1.11% across 65,592 trades. delayed exits also change later entry opportunities.
excluded 1,021 trades with a daily move over 50% from 19 days before the signal through exit. that can remove genuine crashes as well as bad prints or splits. random entries match stocks and holding lengths, not dates or the exit rule; same extreme-move filter. no capital constraint or extra slippage modeled.
data: financialfilings daily prices. nfa
ran the gs-quant z-score dip rule on 9,561 stocks, jul 2024 to oct 2026: buy the next close after z<-2, exit at z>=0 or after 20 trading days, 10bp a side. avg trade +1.06%. random entries in the same stocks: +0.07%
the 18.5% that time out lose 12.6% on average
https://t.co/Mv7gz3EyW2
april 2025 accounts for 6,072 trades at +5.5%; without it, +0.66% a trade, 21 of 28 months green. the universe needs 300+ trading days, so early delistings are missing. that flatters dip buying. nfa
method: move >=7% vs the same-country equal-weight average. filing flag = that day or the day before. return = next 20 trading days minus that market.
price >=1, volume >=20k; extreme returns filtered, full 20-day outcome required. exact SQL for one company slice below; repeat slices 0 to 3. nfa
this paper is INSANE: stocks that jump 7%+ over their market with no filing behind them lag it by 2.05% over the next 20 trading days
same jump on a filing day: 0.63%
119,480 jumps since mid-2024, gross. the gap holds in 4 separate slices of companies
https://t.co/TdVOLn1Krn
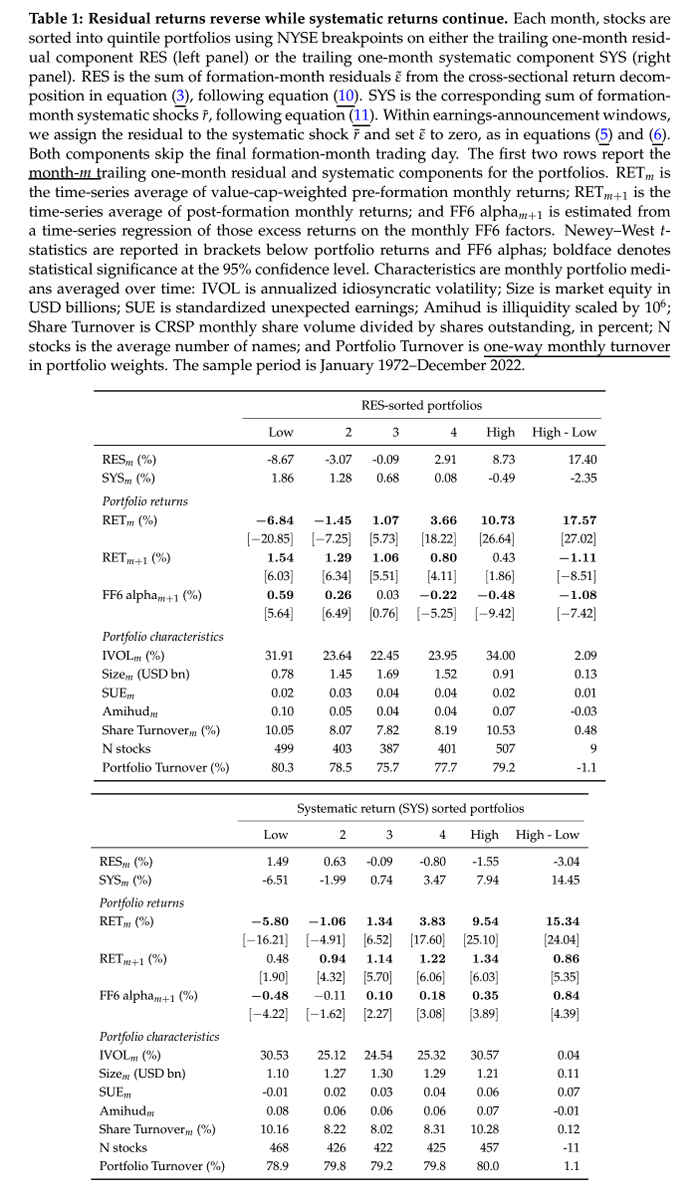
Short-term reversal can coexist with industry momentum, factor momentum, and PEAD. The reason is that residual returns reverse, while systematic returns trend.
BREAKDOWN
Residuals come from a daily cross-sectional regression on industry dummies and 151 characteristics. Returns within one trading day of an earnings announcement are set to zero.
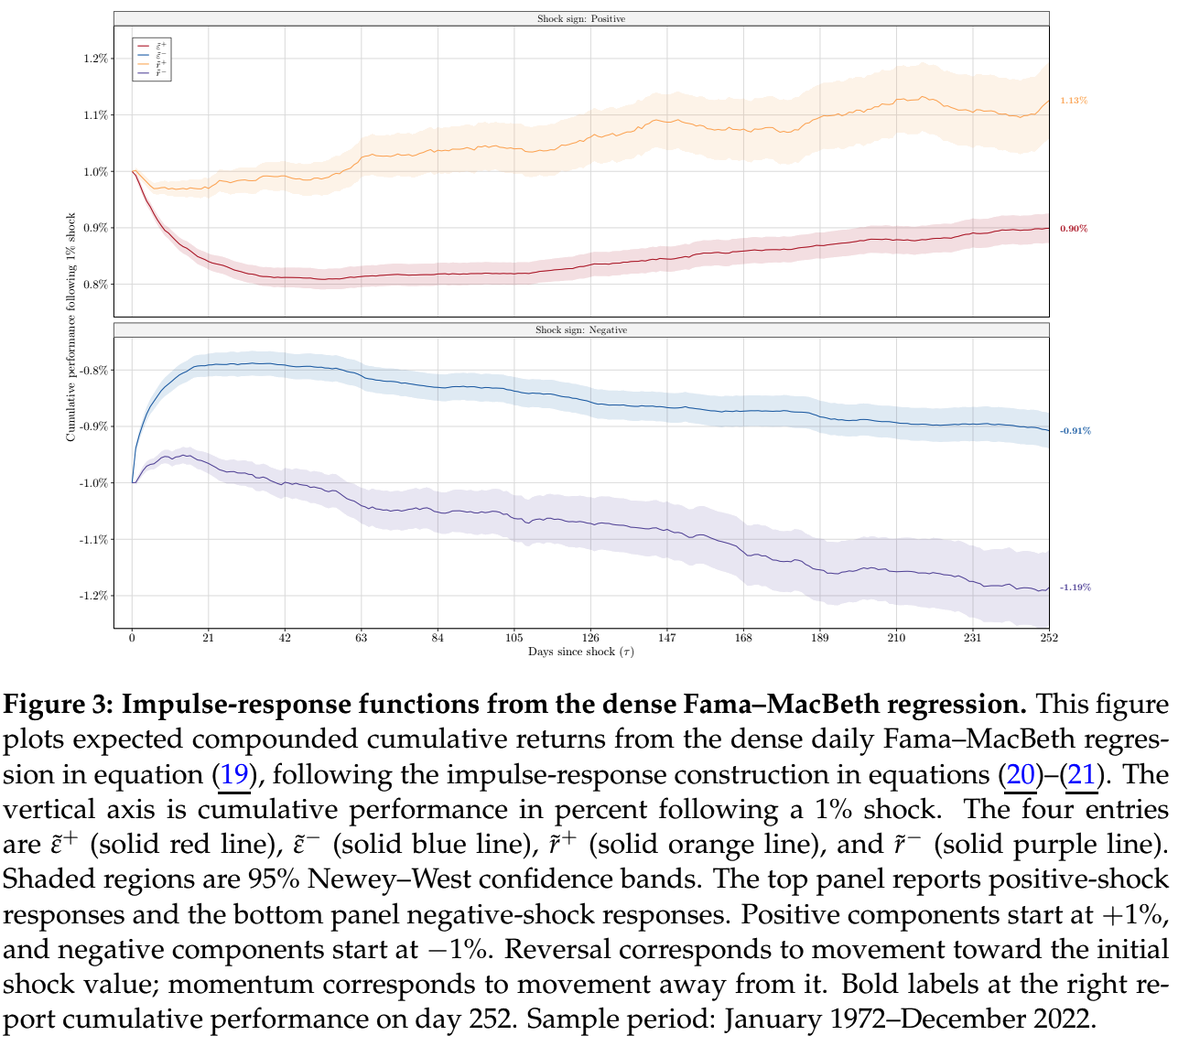
Figure 3, Table 1: After a 1% shock, the residual component reverses (red and blue lines). Negative shocks reverse much faster than positive ones (29% of the reversal on day 1 for negative shocks vs. 4% for positive shocks). The systematic component continues to trend (yellow and purple lines).
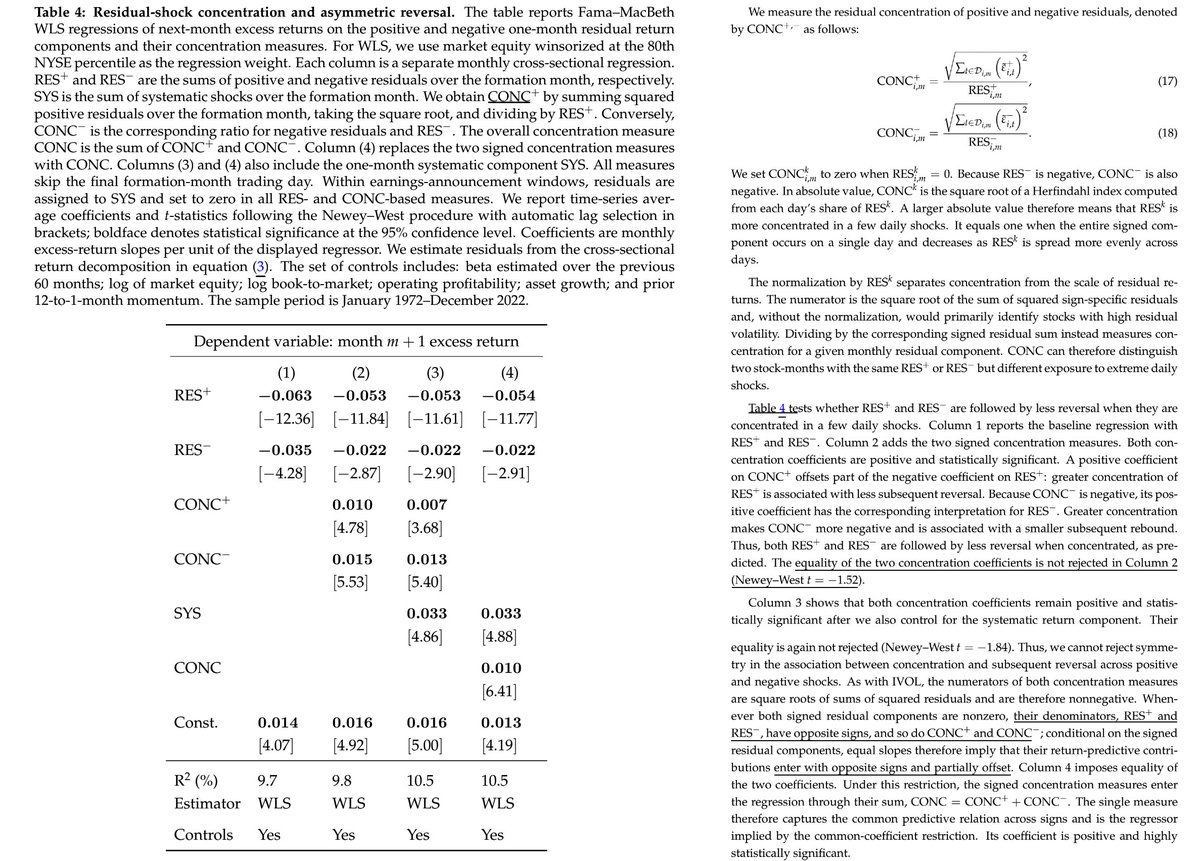
Table 4: When shocks are concentrated (see CONC) into just a few days in the formation month instead of being evenly spread out, reversals are somewhat weaker.
Tables 2 and 6 (see paper): The positive and negative residual factors subsume thirteen previously published short-term characteristics, including idiosyncratic volatility, return volatility, skewness-related predictors, and liquidity-related predictors.
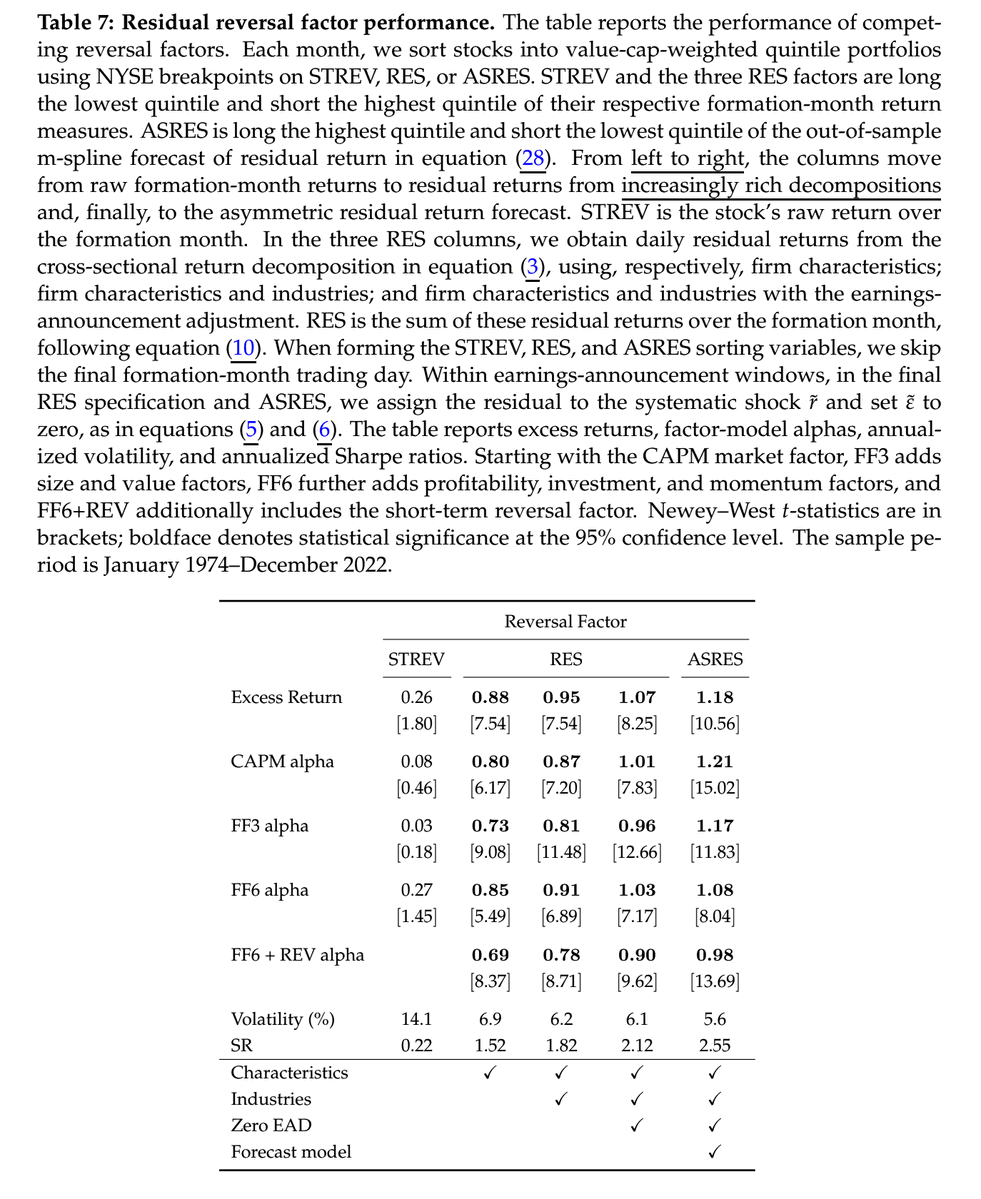
Table 7: The alphas are stronger and more statistically significant than for short-term reversal.
Table 9 (see paper): ASRES, the most complex form of the factor, works across market cap size groups, including in mega-caps, and remains significant (though weaker) post-decimalization.
Asymmetric Reversals (Baldi-Lanfranchi, Collin-Dufresne, Daniel)
filing dates are a proxy for news, not all news. drops don't bounce in this sample: -2.82% without a filing, -3.18% with one. the clean result is the gap on jumps, 1.1 to 1.9 points in every company slice.
jun 2024 to sep 2026, gross returns, no trading costs or factor adjustment. overlapping windows, no clustered significance test. this is a descriptive check, not a replication of the paper's factor model. nfa
paper: https://t.co/AW2zO0vl3M