🥉 Congrats to the Data Heroes team on scoring 3rd at the Building Bridges, Beating Cancer #B3C Hackathon by Novartis. We are proud that EPAMers strive to make the world a better place, and hope that their innovative ideas will help save people’s lives! ❤️ #EUnite @EPAM_Hungary
🏆🎉Congratulations to the @ScanBalt and @NovartisCancer#B3C Top Project winners for their well-deserved wins! We are excited to see how these efforts can be scaled and implemented across Europe. #EUnite https://t.co/zHxfk33uc8
Latest #SaharanDust plume affecting Spain, France, UK & Ireland today/tomorrow before moving east across central Europe through rest of week. @CopernicusECMWF Atmosphere Monitoring Service @ECMWF 5-day aerosol optical depth forecast init. 2 March 00 UTC https://t.co/1seys3HvmF
Latest #SaharanDust plume affecting Spain, France, UK & Ireland today/tomorrow before moving east across central Europe through rest of week. @CopernicusECMWF Atmosphere Monitoring Service @ECMWF 5-day aerosol optical depth forecast init. 2 March 00 UTC https://t.co/1seys3HvmF
#SaharanDust clearing from central/eastern Europe before a new plume crosses Spain, France, UK & Ireland over next few days. @CopernicusECMWF Atmosphere Monitoring Service @ECMWF aerosol optical depth forecast initialized 27 Feb 00 UTC https://t.co/Zcv8RWt2P3
#SaharanDust episode predicted with high surface PM10 #AirPollution across Spain, southern France & Italy over coming days in @CopernicusECMWF Atmosphere Monitoring Service @ECMWF regional ensemble forecast initialized 4 Feb at 00UTC https://t.co/pdxUoWiHx6 #AirQuality
In 2020, we estimate that 45 countries set a new record high for national annual average temperature, indicated on the following chart by circles with dark outlines.
Examples of countries setting new records include France, Japan, Mexico, and Russia. 6/
Saharan dust intrusion over the Mediterranean.
Find more forecast products here: https://t.co/TbIaux5Dhk and https://t.co/2qDUU6GX9T
@WMO@AEMET_Esp@BSC_CNS@UNCCD
New free service in Hungary by @meteorologiahu: support designer to plan urban drainage network with max precipitation in different return period based on 101 AWS data in 1998-2019 period. This dataset provide to plot IDF and calculate standard local intensity of precipitation.
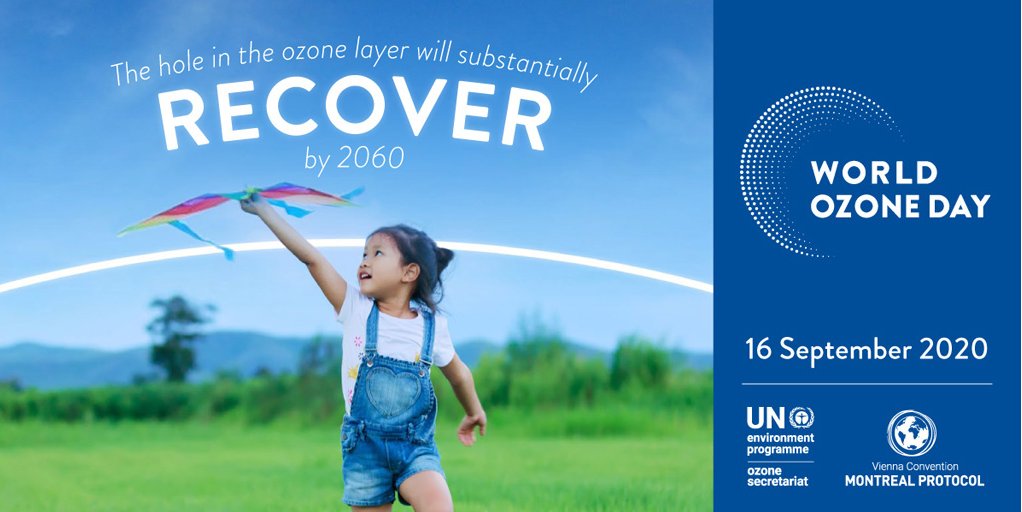
Global action to heal the ozone layer stands out as an example of what we can achieve when we work together.
Let's apply the same level of energy to healing the planet & forging a brighter future for everyone.
https://t.co/4T38V62mzm #OzoneDay
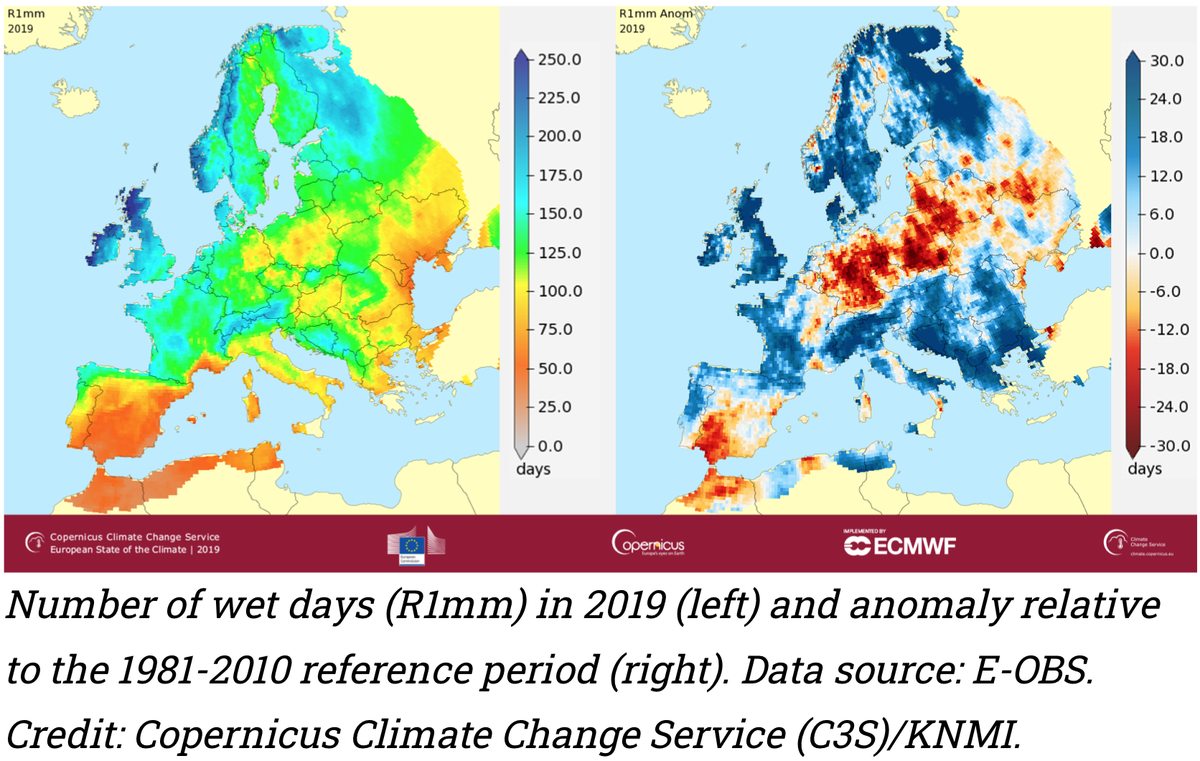
🌦️In 2019, average precipitation drew a inhomogeneous picture over Europe.
The North & West experienced a wetter-than-average year, parts of South & Central Europe were below average.
Read more in @CopernicusECMWF's European State of the Climate Report👉 https://t.co/6rK68oScwx
A héten,2020. július 30-ra az ország déli-délnyugati megyéit szaharai eredetű por érheti el, mely hatással lehet a #Hungairy LIFE IP projektben résztvevő települések PM10 értékeire.
Saharan dust intrusion affecting Iberian Peninsula and western Mediterranean during the next days. Dust emission over the Atlantic will continue.
@WMO@AEMET_Esp@BSC_CNS@UNCCD@AEMET_Canarias
📢June #temperature highlights from #Copernicus#C3S:
🌡️Globally, 0.53°C above the average June for 1981-2010, with the most above-average temperatures in #Arctic#Siberia
🌡️In Europe, tied as the second warmest June in our record
More detail➡️https://t.co/OvJneBc5ni
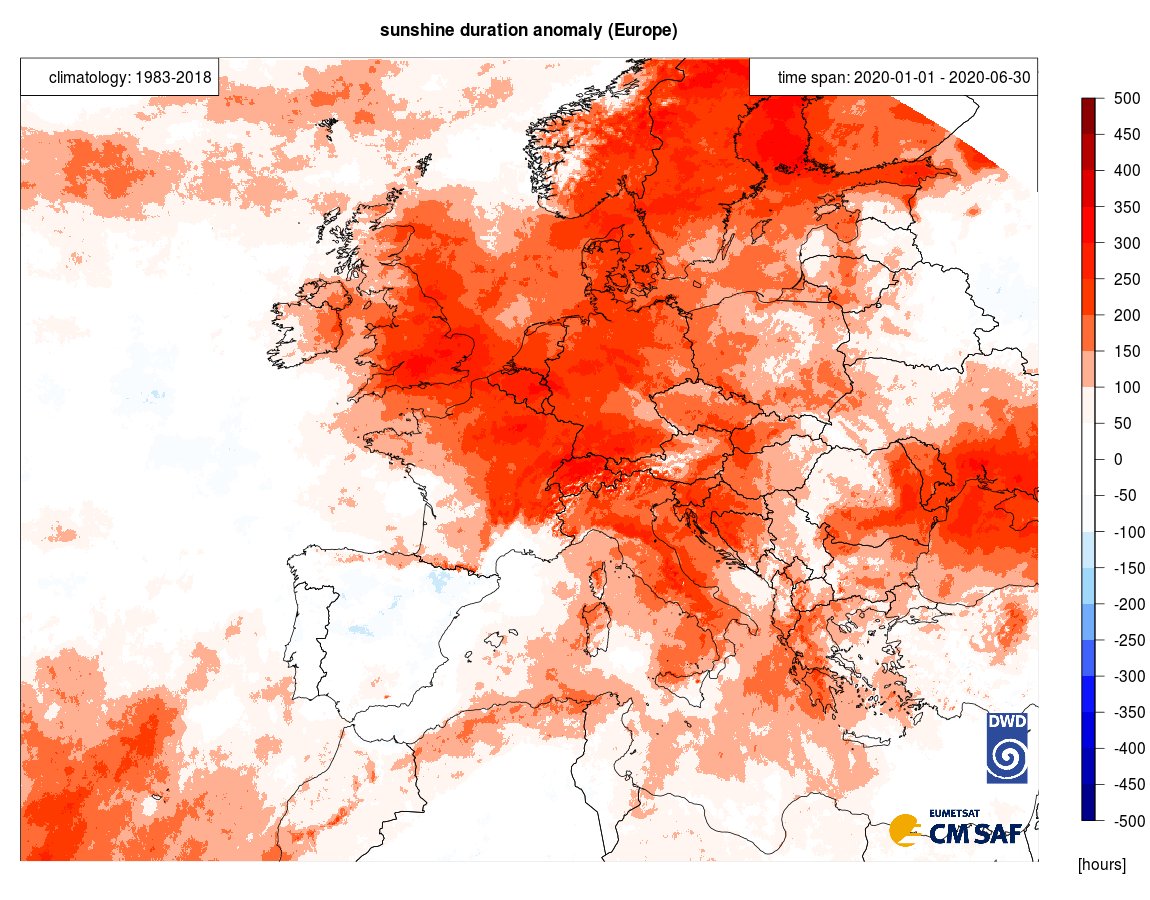
The first half of 2020 was very #sunny for most of Europe with the highest average value since at least 1983! For comparison:
minimum (1985): 975 h
rank 2 (2012): 1200 h
rank 3 (2019): 1197 h
maximum (2020): 1211 h
average (1983-2018): 1113 h
(from SARAH-2.1 data and resp. ICDR)