Following $NVDA’s results today, I thought it might be worthwhile to re-examine the current AI landscape both short-term and longer-term. I wrote on July 11th, “I continue to believe there is a rising mismatch between the amount of capex spent on AI and the resulting revenues being generated… My plan is to be very conservative in my positioning the day the members of the Mag7 report while looking to add to my positions on corrections.”
AI landscape today compared to the internet in the late 1990s:
1. During the internet infrastructure buildout, $CSCO revs increased ~15.5x over 6 years from the end of 1994, when Netscape Navigator (the first mass internet browser) was introduced, to its peak and Cisco’s stock rose ~4000%.
2. Nvidia, since the end of 2022 when OpenAI’s ChatGPT was introduced, has seen revenues go up “only” 5x over the past 7 quarters through today’s results with the stock up “only” 760%.
So far the six Magnificent 7 names that already reported have declined 4% on average the day after reporting on generally disappointing guidance. Only $AAPL and $META both beat revs and EPS for Q2 and had forward revenue & EPS estimates go up as well.
NVidia’s stock is also likely to decline tomorrow given it had the smallest rev/EPS beat of 4%/5% over the past 5 quarters with an even smaller increase relative to consensus for the next quarter.
This increases the odds in my mind of a pending AI capex digestion phase at some point over the next six months. While industry hyperscaler capex is expected to be up ~50% in CY24, NVDA revs were up 262% y/y in CQ1:24 and up 122% y/y for CQ2. Customers have probably been ordering more GPUs than they need over the past 7 quarters given supply has severely lagged demand. As the CEOs of Google, Microsoft and Meta have all said recently, they view the greater risk to be underspending on AI versus overspending. What this means to me, is that when they decide to digest their historical spend now that supply is catching up with demand, much like following Covid, this may be a sharp correction. Deceleration to ~10% capex growth or worse next year would not surprise me.
Following CQ2 results, forward revenue estimates went down at the three AI related hyperscalers: $MSFT, $AMZN and $GOOGL. These are three of the biggest customers for NVidia (in addition to Meta) and in 2022 digestion at these same customers occurred following the build out during Covid. As a result, Nvidia revenues declined 28% in six months while revenues went from up 53% year-over-year in CQ4:2021 to down 21% by CQ4:2022. The stock declined 66% from peak to trough during this slowdown.
In summary, I continue to expect a digestion phase to start over the next six months (and a commensurate fall in the stock price) but then for the AI buildout to continue for the next several years. As a reminder, Cisco’ stock had intra-year declines of 26% in late ‘95, 38% in early ‘97; and 37% in late ‘98 as expectations of growth ebbed and flowed while the stock ultimately climbed ~4000% from the end of 1994 to its peak. I anticipate similar volatility for Nvidia over the next several years while both the revenues and stock double over that time as the AI buildout continues.
VIX 17 tagged with perfection and seems to have resulted in near term bottom forming. Note how price remained below the main pivot in June indicating buyers in control but moment VIX began to perk up through the main pivot in mid July = pullback
VIX vs S&P500 - VIX making higher low ahead of US FOMC and CPI. Black horizontal lines = monthly pivot points. Seems possible that VIX could target 17 as price likes to magnetise to the missed pivot (missed pivot =main pivot not yet touched by price). Dip in S&P in weeks ahead?
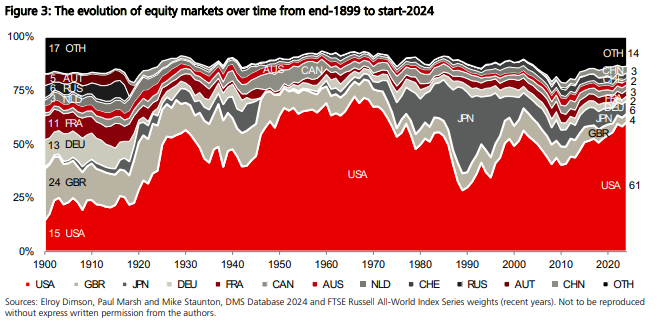
The S&P 500's market cap got down to $6.1 trillion at the Financial Crisis low in March 2009.
The combined market cap of Apple $AAPL and Microsoft $MSFT is now $5.55 trillion.
I’m just going to do some very basic (and broad) math here:
The 10 year yield at ~4.50% is implying that inflation returns to 2%. That’s the bet you’re taking if you want to own 10s here.
Long rates are comprised of 3 components:
1. Inflation
2. Real return
3. Term premium
1. Inflation: Creditors won’t lend below the expected rate of inflation. Why would you lend money to receive less in real terms? This is the minimum return creditors will need.
2. Real return: Creditors (other than central banks) are investors after all! They need a real return on their money, not just to breakeven.
3. Term premium: lending someone money for 10 years, one time, has to come with a slightly higher return than lending someone money for 10 years, but doing it 10 consecutive times - AKA rolling a 1 year bond from 2024-2034. Creditors want to be compensated for the risk of everything that can go wrong over 10 years versus over 1 year.
Now to the math. Real return demands are generally around 2% for high quality credit. The term premium is generally around 0.50%. That already gets you to 2.50%.
For the 10 year yield to equal 4.50%, that assumes inflation will only be 2.00%, when you back the math out.
If expected long term inflation is actually sticky at 3%, then that means the 10 year yield should actually be 5.50%.
If you want to lend the U.S. government money for 10 years today, you are betting on 2% annual inflation over 10 years. If we’re in a structurally higher inflation regime (even just 100 bps higher) than the 10 year yield is still too expensive at ~4.50%.
Shoutout to @rev_cap and @DannyDayan5 for relentlessly drilling on this idea.
Nasdaq 100 total (annual) returns:
1999-2011: +14% (~1% per year)
2012-now: +650% (~20% per year)
Some thoughts on these types of cycles and how they relate to U.S. vs international stocks:
https://t.co/1HNHAIs00S
The most important stock in China plunged more than -10%.
That's one of the most remarkable moves ever for an 800-lb gorilla kind of stock.
Picking bottoms in Chinese tech has been nothing but a knee-hammer kind of thing for investors, but Tencent's reaction history is notable. $TCEHY
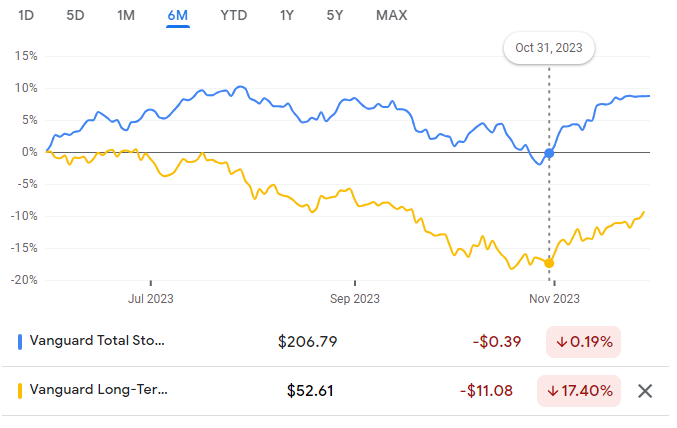
The rise in stocks since Nov 1 has mostly been driven by the rise in long-dated bonds. The rise in long-dated bonds has mostly been driven by pricing in 5-6 Fed cuts in '24 plus some term-premium compression.
But these moves sow the seeds of divergent pressures ahead. Thread.
The whole US high yield market is $1.3 trillion
$AAPL is $3 trillion mkt cap
This means, from an asset allocator’s perspective, getting $AAPL right is 3x more important than getting the junk bond market right
🥴
Not a great sign for Q4 bears that PPI came in hot and futures are moving higher.
The absolute worst case for Q4 bears is if CPI comes in hot tomorrow and equities rally. This would be potentially signaling one of two things.
1) The market is normalizing to the inflation catalyst
2) The bond market front ran the final rate hike of the year and now that it’s on the table, the move is priced in
Doesn’t make too much sense huh? Welcome to markets, it’s not as simple as the academic textbooks make it out to be.
@richytee I liked that it forced me to focus on actually studying all the aspects of TA. Level 1 was pretty straight forward. Level 2 pretty tough but got through it. Level 3 was written and was long! If you want to chat more dm me. It is a fair amount of work
@richytee I did it back in 2012. I really enjoyed doing it & learnt a fair amount. brings all the knowledge together well & formalises the various aspects of technical analysis. The cons are lots of studying and reading and can be costly. Suppose case of asking what you want out of it.
A *very general* rule of thumb that has saved me an immeasurable amount of money is what I call the 75/25 rule
In an uptrend (we've been in one since Jan) 75% of my trades should be longs, 25% shorts. Vice versa for downtrends. 90% of good trading is just getting the trend right
@mfundoxiniwe@thabileoka They have to keep pace with US rates, failure to do so results in the Rand weakening and thus firing up inflation again. Seems US rates higher for longer in my opinion. Doubt SA cuts coming anytime soon as makes Rand vulnerable