Understanding probability distributions is key to making informed decisions in statistics and data science. Probability distributions describe how the values of a variable are expected to behave, making them crucial for interpreting data and predicting outcomes.
Here are some key probability distributions:
🔹 Binomial distribution: This distribution models the number of successes in a fixed number of independent trials, where each trial has two possible outcomes (success or failure). It's often used in scenarios like flipping a coin or determining the probability of passing a test.
🔹 Poisson distribution: This distribution describes the number of events occurring within a fixed interval of time or space, assuming these events happen with a known constant mean rate and independently of the time since the last event. It's commonly used for modeling events like the number of emails received in an hour.
🔹 Normal distribution: Also known as the Gaussian distribution, this distribution represents data that clusters around a mean value. It is symmetric, with most observations falling close to the mean, making it applicable in various fields, from natural sciences to economics.
🔹 Uniform distribution: In this distribution, all outcomes are equally likely within a given range. It's the simplest form of distribution, where every event has the same probability of occurring, such as rolling a fair die.
🔹 Exponential distribution: This distribution models the time between events in a process where events occur continuously and independently at a constant rate. It's often used in scenarios like the time until the next earthquake or the lifespan of electronic components.
These distributions form the foundation for many statistical analyses and are essential for interpreting different types of data accurately.
A probability distribution can be visualized easily in R using the ggplot2 package. For example, a normal distribution can be displayed with a smooth curve using geom_density(). The visualization shown in this post illustrates the distributions explained above.
To learn more about this topic and related statistical methods, check out my online course on Statistical Methods in R.
Learn more by visiting this link: https://t.co/7YQCRDKSPO
#RStats #Rpackage #DataVisualization #Statistics #database
Kedarnath is witnessing such massive crowds that even people are now stuck in traffic.
The question is no longer about record numbers, but about how much the Himalayan ecosystem and infrastructure can realistically handle.
Video Credit: Social Media
Day 2 of the #Kerala exposure leg of #YuvaSangam Phase 6 for Jammu, Kashmir and Ladakh delegates started with a visit to 14thcentury Tali Shiva Temple, one of the oldest temples in Kozhikode, built by the Zamorins. The two-storied sanctum-sanctorum is in the shape of a chariot
"Foundations of the Theory of Probability"
by Andrey Kolmogorov
Kolmogorov introduced the modern axiomatic foundations of probability theory in this book.
Archive link: https://t.co/Vy5JFLVhjo
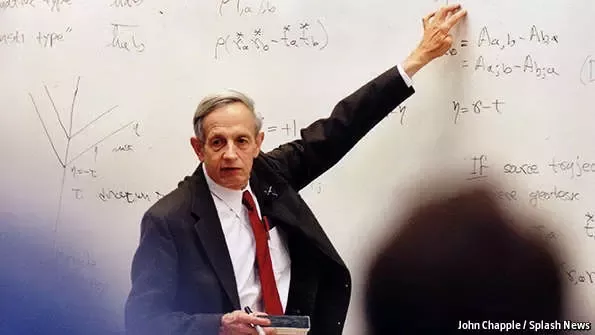
Ever seen the film A Beautiful Mind?
The mathematician that film was based on, John Nash, has one of the shortest PhD dissertations ever published: ‘Non-Cooperative Games’.
It has a grand total of 26 pages, and only cites two references.
That thesis went on to found the basis for his paper on the development of game theory, for which he won the 1994 Nobel Prize in Economics.
CONTAMINATION BIAS IN LINEAR REGRESSIONS:
This paper studies identification problems in linear regressions with multiple treatments and rich control sets intended to eliminate omitted variable bias. The central result is that, even when controls are sufficiently flexible, standard OLS regressions with multiple treatment variables generally fail to recover meaningful convex combinations of heterogeneous treatment effects. Instead, each estimated coefficient is a contaminated mixture of the true causal effects of all included treatments.
The key insight is that in a multi-treatment setting, partialling out controls induces a re-weighting of variation in treatment variables that is not orthogonal across treatments. As a result, the coefficient on any given treatment reflects not only its own causal effect but also linear combinations of the effects of other treatments. These weights can be negative or exceed one, implying that regression estimands are not convex averages and may lie outside the support of true treatment effects. This phenomenon is termed contamination bias.
The authors derive the exact algebraic representation of OLS coefficients under multiple treatments, showing how the projection of one treatment onto others enters the estimand. They characterize conditions under which contamination disappears—essentially requiring orthogonality or special designs where treatments vary independently conditional on controls. However, such conditions are rarely satisfied in observational data, especially in applied economics where multiple policy variables are often correlated.
To address the problem, the paper proposes alternative estimands that target interpretable weighted averages of treatment effects. One approach involves constructing weights that explicitly account for the covariance structure among treatments, ensuring that identified estimands correspond to meaningful convex averages. Another approach focuses on estimating “easiest-to-learn” or most precisely identified linear combinations of treatment effects, trading off interpretability and statistical precision.
The authors also conduct a re-analysis of nine empirical applications from the applied microeconomics literature. They find substantial contamination bias in observational studies, often leading to sign changes or magnitude distortions in reported treatment effects. In contrast, randomized experimental settings exhibit less severe contamination due to more balanced treatment assignment and reduced correlation among treatments, though some bias can still remain when propensity scores vary.
Overall, the paper highlights a fundamental limitation of standard regression-based causal interpretation in multi-treatment environments. It shows that even with rich controls, OLS coefficients may not correspond to any meaningful average treatment effect unless additional structure or alternative estimators are used. The results motivate caution in interpreting multi-variable regressions causally and provide practical tools for more robust estimation strategies.
Paper: https://t.co/KSrZGVNJVd
Goldsmith-Pinkham, @instrumenthull, Kolesár (2024)
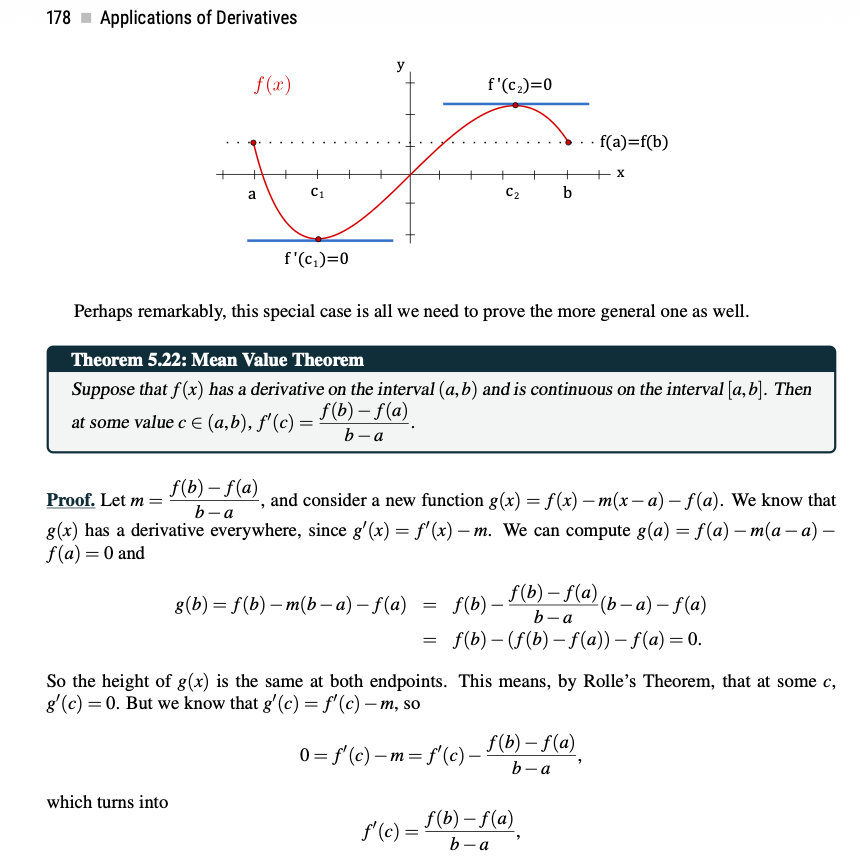
"Calculus: Early Transcendentals" is an excellent free resource for building a solid foundation in calculus. The book is written in a clear and accessible style while maintaining an appropriate level of mathematical rigour. It is also rich in examples and exercises, making it useful for both self-study and classroom use.
It covers a wide range of topics, including limits, derivatives, integrals, sequences, series, differential equations, and multivariable calculus.
I consider it another valuable resource to keep in your mathematical toolbox. Whether you are a student looking to learn or review key concepts or an instructor seeking inspiration and alternative explanations, this textbook is well worth exploring.
https://t.co/QdzBAARO4W
Terence Tao's "Solving Mathematical Problems: A Personal Perspective."
Terry Tao's first book, written when he was 15-16 years old. The book is based on his experiences with mathematical problem solving.
Not knowing what to do is as stressful as having too much to do.
515 studies, 787k people: Role ambiguity and role conflict are at least as detrimental to well-being and performance as role overload.
Setting clear, consistent expectations is a foundation of good leadership.
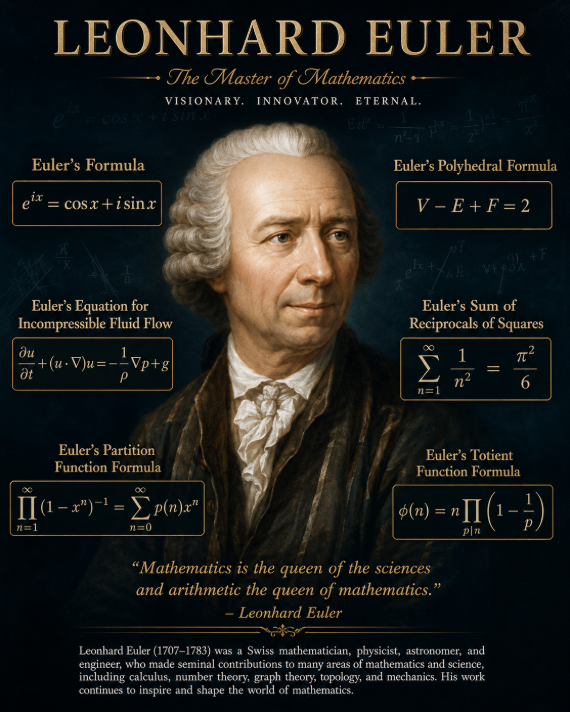
Mathematician Leonhard Euler was so prolific and original that some of his discoveries have been named after the first person to have proved it after Euler.
"A tribute to Euler" -- I loved this funny, fascinating lecture by the great William Dunham, one of the world's best math expositors for people who actually like math. https://t.co/ncKOrUZ8Dj via @YouTube
Researchers from IIT Madras and IISc Bengaluru have solved a chemistry puzzle that remained unanswered for over 70 years.
As reported in The Indian Express, the team led by Prof. Sundargopal Ghosh and Stutee Mohapatra from the Department of Chemistry, IIT Madras, along with Prof. Eluvathingal Jemmis from IISc Bengaluru, has synthesised a carbon-free molecule that mimics the iconic ‘sandwich’ structure of ferrocene.
Using osmium and boron-based rings instead of carbon, the breakthrough marks the first stable carbon-free version of the molecule — something scientists worldwide had long attempted to achieve.
Published in the prestigious journal Science (https://t.co/zqkL1CSqz6), the discovery could open new pathways for designing advanced materials with unique chemical and structural properties.
Read more: https://t.co/DhPSJbAGJ9
@IndianExpress@iitmadras@iiscbangalore@amitabhsin
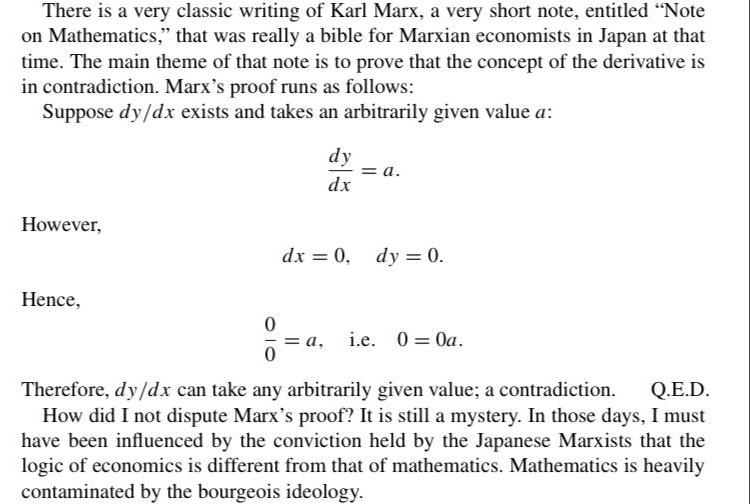
Karl Marx (1818–1883) is famous for being the father of communism. He spent years in his youth living in the library and formulating his ideas, which were ultimately enshrined in Das Kapital. Less well known is that Marx also wrote a calculus book—after all, he had to feed his family.