@the_smart_ape Fewer than 90 accounts using stock collateral made me do a double take. The keynote feature and the thing people actually use are having very different weeks. Did you look at spreads outside NYSE hours? That's where I'd want to know if execution holds up.
@SeniorDeFi A chip stock beating XRP on a crypto liquidation leaderboard is a 'wait, what year is it?' moment. I'm curious what happens to the perp basis when the stock market shuts and the hedge is harder to trade.
@Remzztrades Dow hauling the index uphill while tech quietly heads for the exit The sector scan tells a much clearer story than the headline number. Curious if you're seeing crypto follow tech weakness today or trade its own tape.
@cryptorover Funding is giving the shorts a group discount. Curious whether it's crowded across venues or just a few big perps books—that's the difference between a real squeeze setup and a scary-looking screenshot.
@CryptoTeca__@JupiterExchange Volume is a pretty leaderboard. Net execution is the part traders actually feel. I'd love to see realized price after gas and MEV across routes; the 'free' swap can be the expensive one.
I've kept a comparison of crypto data vendors since July. Here it is as a tier list: raw market data vs derived metrics, ranked for systematic research.
Disclosure: I run Aperiodic (we sell both), so we're on it but unranked.
Full 37-criteria comparison in the thread.
@MartiniGuyYT Leverage got the eviction notice. Liquidity may not have read it yet. Before calling this a reset, I’d want to see bids actually return: tighter spreads, deeper books and faster replenishment after market sells. Falling OI alone doesn’t make the exit easier.
@KushPatil_ The bid that looks deep at 2:00 and takes a coffee break at 2:01. In crypto, leverage gets the headline; disappearing book depth decides how ugly the exit gets. I’d watch how fast bids refill after a sell burst, not just the liquidation tally.
@RoundtableSpace One gate I’d add before any live loop: point-in-time data plus a fill model that includes spread, book depth, fees, funding and latency. A candle backtest can look great while the executable strategy loses money. Paper trade and measure expected vs realized slippage first.
@AlphaPrimer_R The sequencing matters here. I’d compare L2 depth and spread *before* the liquidation burst, then measure how quickly the book replenished afterward. If depth withdrew first, the liquidation total alone is a poor proxy for price impact. Did you see that lead-lag on Oct 12?
A year ago this week, at 20:50 UTC on Friday 10 October 2025, Trump posted that the US would impose an extra 100% tariff on Chinese imports from 1 November.
Wall Street had already closed and crypto was the only market still open.
We rebuilt the night minute by minute from 847 order books across Binance, OKX and Hyperliquid. The replay is in the first comment. #hyperliquid#okx#binance
Read an impact_per_notional spike next to net-flow share before calling it an event.
Both columns, May 2025, no key:
aperiodic impact --preview --symbol perpetual-BTC-USDT:USDT --interval 5m --start-date 2025-05-01 --end-date 2025-05-31 --output-dir .
A metric at 471x its median is either an event or a denominator.
impact_per_notional is the hour's |return| over |net flow|. On Binance BTC perps at Oct 2 00:00 UTC it hit 471x. Amihud, |return| over all notional traded, read 0.7x. Net flow was 0.012% of volume.
Same numerator, so one divided by the other is total over |net| notional, every hour. That hour: 8,078x.
When buys and sells nearly cancel, the denominator does the moving. Price moved less per dollar traded than usual. Across 143 hours, their rank correlation: 0.58.
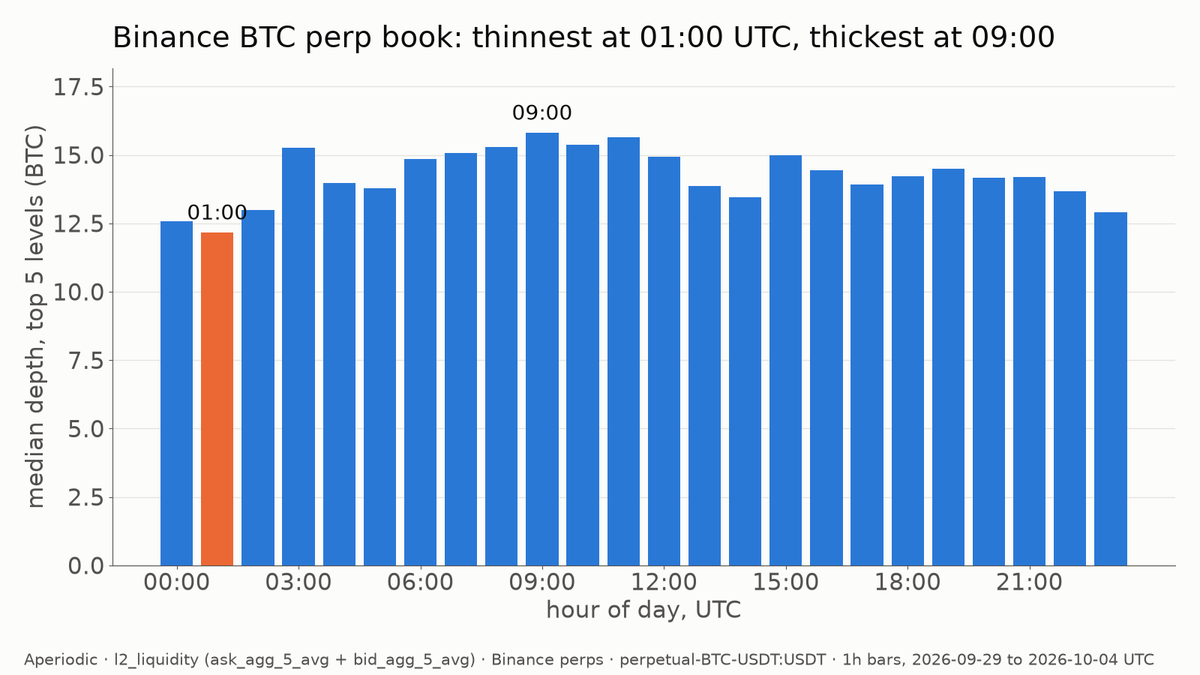
The metric is l2_liquidity (ask_agg_5_avg + bid_agg_5_avg). The no-key preview is May 2025, so you can see whether the shape held then:
aperiodic l2_liquidity --preview --symbol perpetual-BTC-USDT:USDT --interval 5m --start-date 2025-05-01 --end-date 2025-05-31 --output-dir .
Binance BTC perp book, top 5 levels: thinnest at 01:00 UTC, thickest at 09:00, 1.3x apart (hourly medians, Sep 29 to Oct 4).
A slippage model built on one daily average overstates depth at 01:00 and understates it at 09:00. Six days is a small sample; check your own window.