My first publication's out. In this article, @StephenPHinshaw and I reviewed the literature on the stigmatization of individuals with ADHD and explored why these individuals are stigmatized. We also discussed how to combat the stigma against ADHD and mental illness in general.
Simplify the creation of publication-ready plots! The ggpubr package builds on ggplot2, providing easy-to-use functions for creating clean and stylish visualizations, perfect for reports, articles, and presentations.
✔️ Publication-Ready Graphics: Designed to help you generate high-quality plots with minimal effort, ensuring your visuals are polished and professional.
✔️ Easy Statistical Annotations: Easily add statistical comparisons, p-values, and significance markers to your plots, making it simple to highlight key differences.
✔️ Streamlined Plot Customization: Includes intuitive functions for adding titles, labels, themes, and more, so you can quickly fine-tune your plots to match your style.
✔️ Seamless Integration with ggplot2: Works directly with ggplot2, allowing you to enhance and customize your plots without learning a new syntax.
The visualizations shown here are from the package website, demonstrating how ggpubr can simplify the creation of beautiful, informative plots: https://t.co/Dx49IJJVkD
Want to master ggplot2 and its powerful extensions to create stunning visualizations? Enroll in my online course, “Data Visualization in R Using ggplot2 & Friends,” starting on November 25, 2024!
Early bird promotion available for a limited time, through November 6.
Further details: https://t.co/ztlEzoFbM3
#Rpackage #tidyverse #DataVisualization #VisualAnalytics #ggplot2 #programmer
Hold up
So Sakurai created his channel 2.5 years ago. Has released 273 videos on it.
And all of the footage was actually recorded 2.5 years ago? How is this man even human. He recorded an entire channel's worth in a few weeks and moved on to other projects??????
The function is ggstats::ggcoef_model().
It turns your Linear Regression into an easy-to-understand coefficient report.
I don't know how many times I've done this the hard way.
Beginner or Advanced R User? 🤔
➡️ This cheat sheet is gold.
It summarizes all the best practices R developers should apply.
If some of it isn’t familiar, the first module of my https://t.co/wK6l6vXJe9 project explains exactly this!
Thanks so much @_wurli 🙏
What's missing?
R offers _thousands_ of packages. 🙈
I curated a list of the 47 best packages for #dataviz
https://t.co/X4v7Kl6OCT
For each package:
🔎 In-depth description
⚡️ Main features with code
📖 Real-life examples from the gallery
➡️ Agree with my list? Which one is missing? 🤔
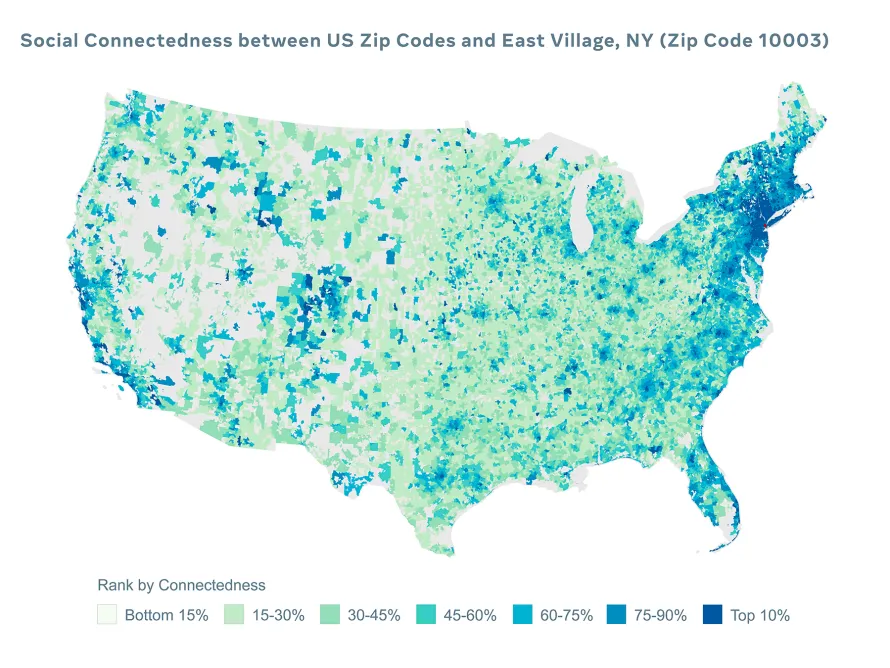
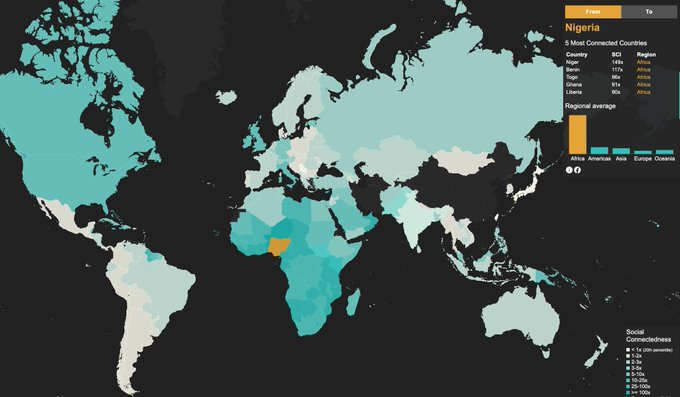
Meta is known for Facebook, WhatsApp and Instagram.
But did you know they provide a range of free geospatial datasets for researchers?
These include granular measures of household wealth, population, and network access.
Here's what you need to know about it:
6. Social Connectedness Index
This measures the strength of connectedness between two areas )as represented by Facebook friendship ties).
This provides insights about economics, social mobility, and health.
Link to data: https://t.co/iVpUtjnwBz
It took me SEVEN years to figure out that you can save a ggplot as a vectorized .svg file ggsave("file.svg"). The svg file can be opened on powerpoint and it will be completely vectorized, even text are still recognized as text boxes! No more recreating plots on illustrator!!!!!
Just updated!
Download our database of 190 PhD fellowships.
For each entry, we provide a description of the fellowship, link, amount, eligibility criteria, and deadline.
Download it here (free): https://t.co/1h76jJaHOv
Social determinants of health (#SDOH) are used across research areas. By introducing standardized measures, the SDOH assessments collection encourages cross-study analysis. Access and share today! https://t.co/Y8kke75l5F #MinorityHealth#HealthDisparities
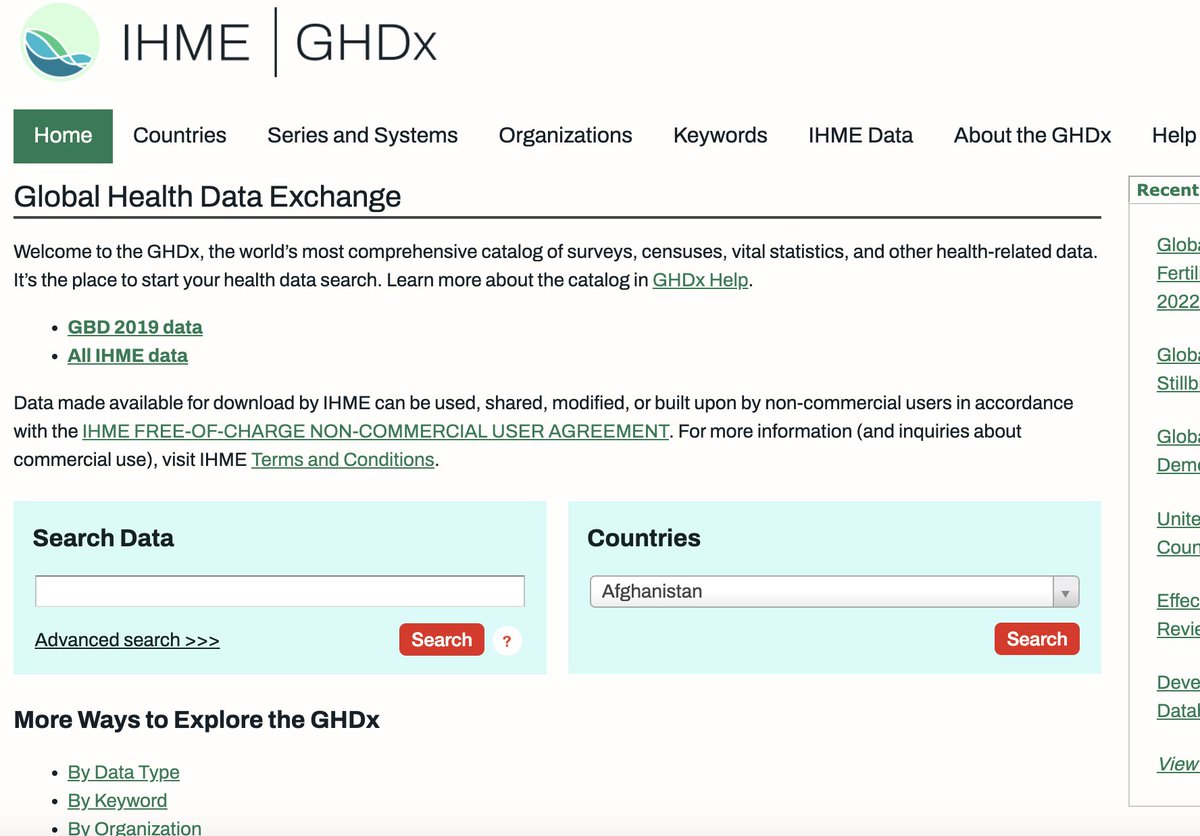
@datadryad@ZENODO_ORG 6. Global Health Data Exchange from @IHME_UW
This is the best resource for geospatial health and well-being data.
It covers geospatial data on:
• pollution
• child mortality
• vaccinations data
• malaria incidence
• educational attainment
Link: https://t.co/Xcw9v4XfeK
The line between satire and reality has blurred to the point of absurdity.
Class Is Canceled Until Further Notice While I Do My Job https://t.co/fjQcllgVqs
⚠️⚠️New Blog Post! ⚠️⚠️
Centering in Moderation Analysis: A Guide
We talk about: how to center variables (including categorical variables!), when you need to use it (moderation analysis, ANOVA) and how to do it (@easystats4u's datawizard)!
#rstats
https://t.co/RDzfuweSkj