$SATS owns ~2% of $SPCX — worth ~$48B.
EchoStar's whole market cap? ~$32B.
You get 2% of SpaceX at a ~35% discount — the rest of the company free.
Catch: the stake is locked up + EchoStar just skipped a $183M coupon.
Mispriced gem or value trap? 👇 $SPCX
Absolutely incredible.
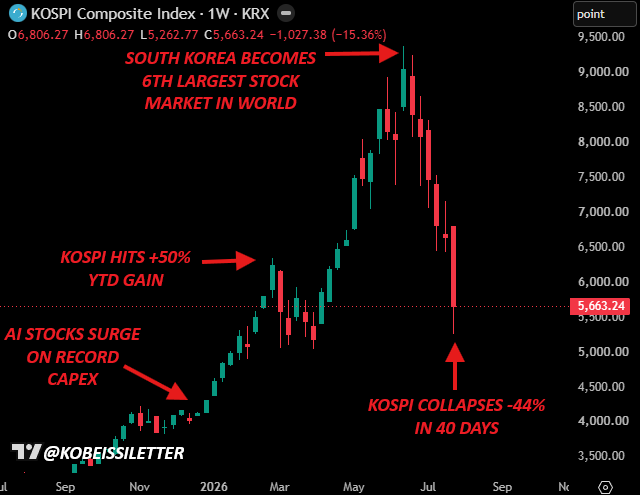
In an unprecedented move, South Korea's stock market just collapsed -44% in 40 days, erasing -$2 trillion in market cap.
Now, South Korea's finance ministry has announced plans to "stabilize" the market.
What is happening? Let us explain.
(a thread)
To everyone questioning SpaceX / $SPCX’s highly successful IPO and its $2.1T market cap, let me share what I believe is the best arbitrage setup.
Do you know $SATS?
$SATS is expected to receive 261.8M shares of $SPCX, worth roughly $42B based on the 6/12 closing price.
Yet SATS’ current market cap is only about $33B.
Short: $SPCX
Long: $SATS
$SATS will effectively own approximately 2% of SpaceX / SPCX.
According to the SPCX prospectus, in exchange for acquiring spectrum from SATS, SPCX will pay SATS 261.8M shares of SPCX stock, roughly $8.5B in cash, and an additional ~$2.0B in cash to cover interest payments that SATS would otherwise have been responsible for.
In addition, SATS is expected to sell roughly $23B of spectrum to $T.
The transactions with $T and SPCX were approved by the FCC on 5/12. If no petition for reconsideration was filed by 6/11, the approval should likely have become final automatically. As of 6/14, I have not confirmed any petition for reconsideration.
Also, the spectrum transfer structure is SATS → TRUST → SPCX. Since the SATS → TRUST transfer has already been completed, I believe the closing risk is relatively low.
Now let’s calculate $SATS NAV.
My base NAV assumptions:
SPCX ownership: approximately 2%
SATS basic shares outstanding: 298M
Fully diluted shares after convertible bonds: 348M
I use 348M shares in the calculation below.
Cash proceeds from spectrum sales to $T and $SPCX:
From $T: approximately $23B
From $SPCX: approximately $8B in cash
Total: approximately $31B
Assuming the convertible bonds are converted into equity, net cash after debt repayment would be roughly $11B.
Regulatory / escrow / contingent liability haircut: -$2.5B
Net cash after haircut: approximately $8.5B
Remaining operating business value: $10B
Based on roughly $300M of operating income in Q1 2026 × 4 quarters × 8x multiple.
Even after the spectrum sales to $T and $SPCX, SATS will retain remaining spectrum assets. The most notable example is AWS-3 paired spectrum, which SATS previously planned to sell to $VZ for approximately $9.8B.
If we conservatively value the remaining spectrum at $10B, that adds approximately $28.7 per share of NAV based on 348M shares.
Formula:
SATS NAV
= {SPCX market cap × 2% + net cash after haircut + remaining operating business value + remaining spectrum value} / 348M shares
= {SPCX market cap × 2% + $8.5B + $10B + $10B} / 348M shares
SATS NAV by SPCX market cap:
• SPCX $2.0T → SATS approximately $197
• SPCX $2.25T → SATS approximately $211
• SPCX $2.5T → SATS approximately $226
• SPCX $2.75T → SATS approximately $240
• SPCX $3.0T → SATS approximately $254
This is my personal analysis, not financial advice.
My theory of $sats price suppression and high short interest + how it will all end.
Convertible arbitrage is probably a major driver of SATS’s elevated short interest
$sats took on a lot of debt. Buyers of the converts sitting on a good 3X, want to lock in gains.
If you loan $sats $1000. You are up 3X. You are now given the option to lock in gains in the latest 10Q
WHAT DO YOU DO?
Short the ownership equal to the value of your own shares to lock in the gains aka convertible arbitrage.
Dateline: June 30
Math Maxing (from latest 10-Q and filings)
🔸Principal amount outstanding: ≈ $1.9426 billion ( Market Value now $6 Billion )
🔸Conversion rate: 29.73507 shares per $1,000 principal
🔸Potential shares if fully converted: ≈ 57.76 million shares
🔸Shares outstanding (as of March 31, 2026): ≈ 289.81 million
🔸Current short interest (as of May 29, 2026): 41.07 million shares
Short % of float: ≈ 30-32%
What does this all mean?
By June 30, Heavy conversion (many arbs convert)
30–50+ million shares bought to cover
Again, this is the kind of DD I’m doing. It makes hodling a hell lot easier.
There will be a time to cut. I’ll know when it comes.
But NOT free money ⚠️
• SpaceX shares locked up (~180d) → $48B is a paper mark
• $183M coupon skipped (30-day grace, default risk early July)
• ~$27B net debt; deal closes 2026–27
• $SPCX -8% in 2 days
Watch: the $20B AT&T cash + the coupon cure.
NFA. Long $SATS. $SPCX
$SATS owns ~2% of $SPCX — worth ~$48B.
EchoStar's whole market cap? ~$32B.
You get 2% of SpaceX at a ~35% discount — the rest of the company free.
Catch: the stake is locked up + EchoStar just skipped a $183M coupon.
Mispriced gem or value trap? 👇 $SPCX
Why it's cheap on paper:
Wall St NAVs: New Street $159, TD Cowen $155. Consensus ~$137. Tape: ~$110.
~14% short + S&P 500 forced buying = squeeze fuel. A take-private by Ergen/Musk lights it.
The stake alone = ~$167/share. $SATS
🛰️ $SATS lets you buy SpaceX at a discount.
EchoStar owns ~2% of $SPCX → ~262M shares. At yesterday's close that stake is worth ~$48B.
EchoStar's ENTIRE market cap? ~$32B.
2% of SpaceX at a ~35% discount, and the rest of the company free.
Thread 👇 $SATS $SPCX
The US stock market is rewriting every record in the financial history books:
The top 10 US stocks now have a combined market cap of $25.3 trillion.
If the top 10 were a stock market, they would be the 2nd-largest in the world, even exceeding China.
The top 10 US stocks' market value is also larger than China's GDP of $19.4 trillion, the world’s 2nd-biggest economy.
Together, these companies are now worth ~80% of US GDP.
Furthermore, the top 5 companies alone have a combined market cap of $18.6 trillion, exceeding the value of every global stock market outside the US.
Truly unprecedented numbers.
Insanity: with a market cap of $2.96 trillion, SpaceX just passed Microsoft to become the 4th largest company in the world.
Microsoft Sales: $318 billion
Microsoft Net Income: $125 billion
SpaceX Sales: $19 billion
SpaceX Net Income: -$9 billion
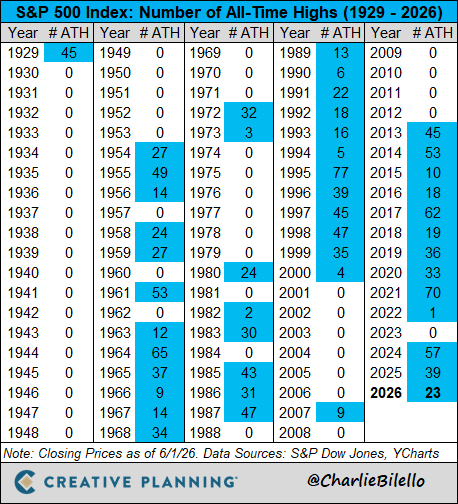
The S&P 500 has never peaked in June in 75 years of data.
Since 1950, the annual high has hit in December 32 times and January 12 times. June: zero.
If history is right, the market has not peaked for 2026 yet.
H/t @RyanDetrick
BREAKING: Micron, $MU, extends gains to rise above $1,000/share for the first time in history, now worth nearly $1.2 trillion.
This stock was worth $60 billion just 13 months ago.
⚠️ WARNING
Berkshire Hathaway is still dumping stocks at a record pace.
14 straight quarters of net selling.
A record $400 BILLION in cash.
They are clearly preparing for something much bigger.
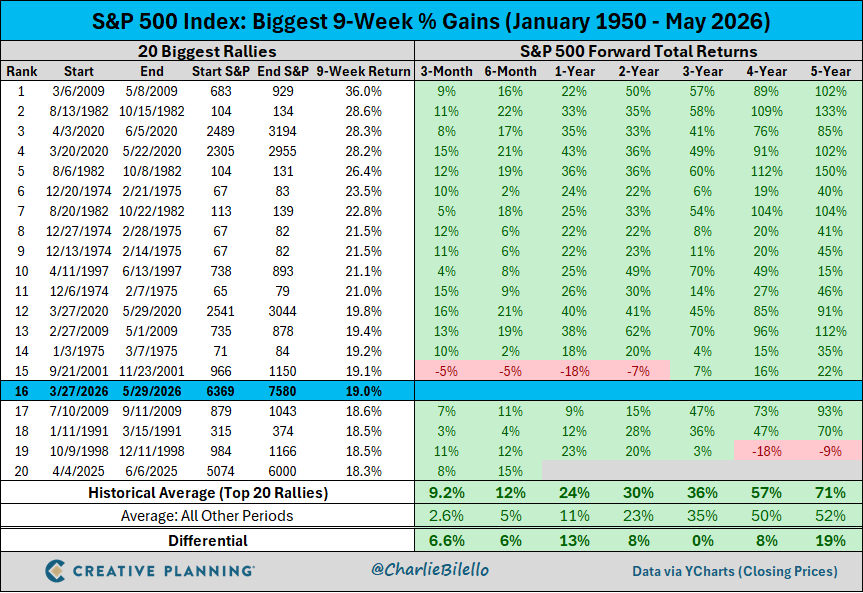
BREAKING: The S&P 500 closes at its highest level on record, now on track for a 10-week win streak for the first time since 1985.
That's +$11.7 TRILLION in market cap since March 30th.
US tech stocks are rewriting the record books:
The Information Technology Sector now accounts for 37% of the S&P 500’s market cap, an all-time high.
This percentage has nearly DOUBLED since the 2020 market bottom.
To put this into perspective, the 2000 Dot-Com Bubble peak was 35%.
As a result, the tech sector's market cap is now up to a record $29 trillion.
Technology stocks also account for a record 91% of total US GDP.
Meanwhile, the remaining 10 sectors collectively account for $49 trillion of the $78 trillion in US market capitalization.
The market has never been more driven by one sector.
Every week I send a letter to tens of thousands of investors covering the most important charts and themes in markets.
Join here: https://t.co/l5IYmkeySJ