📌 Why follow me? I connect the dots before the move.
Markets don’t move in isolation. The edge is in understanding how the pieces fit together.
📊 Macro & Market Internals — What’s happening beneath the index.
🔄 Sector Rotation & Relative Strength — Where capital is shifting.
🐻 Market Structure & Wyckoff — Accumulation, distribution, and potential turning points.
📈 Technical Analysis & Momentum — RSI, key levels, and price action.
🎯 Trade Setups & Execution — Turning a market thesis into actionable scenarios.
My approach: Macro → Breadth → Rotation → Structure → Execution.
No crystal balls. No blind predictions. Just a systematic process, clear levels, defined risk, and price confirmation.
I share my analysis in real time—what I see, what I’m watching, and what would invalidate my thesis.
If you want to understand WHY the market moves, not just WHAT it does, you're in the right place.
Follow along. Connect the dots. Trade with a plan. 👊
For educational purposes only. Not financial advice.
@askslim Thanks for the follow, Slim!
I’ve been following you since the tastytrade days. Time is such an underrated dimension of market analysis, and your cycle analysis has always been my go-to for understanding where we are in the cycle—not just where price is.
Appreciate the knowledge you continue to share! 🙏📈
☕️ Monday Market Watch
Last week saw a significant rotation from Growth into Value, adding pressure to $SPY and especially $QQQ, which was already showing weakness.
Will that rotation continue, or will Growth find its footing? #SectorRotation
Watching price action, market breadth, and sector leadership for clues. Let the market show its hand. 🎯
$SPY $QQQ $DIA $IWM $SMH $IGV $MAGS
Another excellent weekly market review by @askslim !
We’re fortunate to learn from a veteran trader who has a unique ability to connect cycle analysis, momentum, and price action into one coherent view of where the market stands in its cycle.
It’s not just about reading charts - it’s about understanding the rhythm of the market. That perspective is what makes his weekly reviews so valuable. 👏📊
Another outstanding weekly market review by @PeterReznicek.
My weekend isn’t complete without watching his breakdown. He consistently cuts through the noise and gets to the fundamental drivers behind market moves.
This week’s take on AI debt really stood out: Market changes question from “Is there demand?” to “Can it be financed?”
That’s the kind of insight that changes how you look at the market. Always appreciate your perspective, Peter! 👏
I’m always in awe of how simply Brian @alphatrends articulate the most important lesson in trading.
Fundamentals give us a reason to care, seasonality gives us a time to pay attention, but price tells us what the market is actually doing.
Everything else is context. Price is the final arbiter. 🎯
$DIA Daily | Bearish Structure 📉
🔻 Aug 5: Evening Star reversal pattern
🔻 Price broke below the 21 EMA
🔻 Late August: Multiple RSI rejections at its moving averages
🔻 Sep 8: Price broke below the 50 SMA
🔻 October: Tested the 200 SMA and printed a Hammer candle
🔄 Now: Retesting the 50 SMA from below
Blue Ice failure? The breakdown structure remains in focus, but confirmation is key.
Watching for rejection at the 50 SMA and renewed downside follow-through. 🎯
#DIA #TechnicalAnalysis #MarketStructure
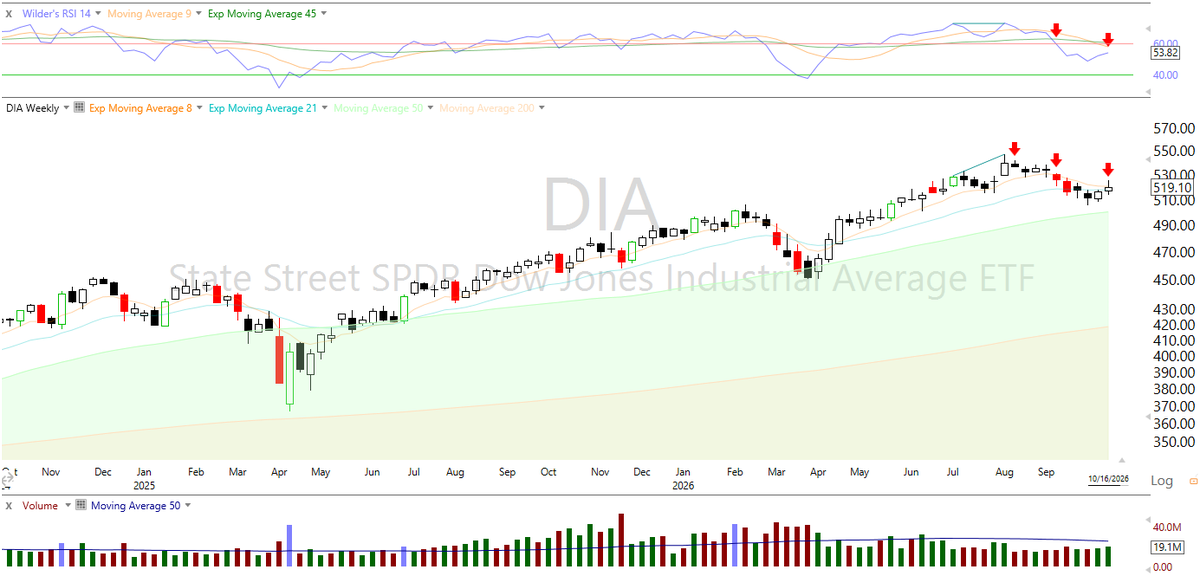
$DIA Weekly | Bearish Structure 📉
🔻 RSI bearish divergence emerged in mid-August
🔻 RSI rejected at its moving average and fell below 60
🔻 Price broke below the 21 EMA
🔻 Now retesting the 8 EMA from below
Looks like a relief rally within a developing downtrend - not yet a trend reversal.
Watching for rejection at the 8 EMA and downside follow-through. 🎯
#DIA #TechnicalAnalysis #MarketStructure
$QQQ Daily | Wyckoff Structure 📉
🔹 Mid-May: PSY — Preliminary Supply
🔹 June: BC → AR → ST — Buying Climax, Automatic Reaction, Secondary Test
🔹 Late July: SOW — Sign of Weakness
🔹 Mid-August: UT — Upthrust
🔹 Early October: UTAD — Upthrust After Distribution
🔹 This week: ICE support failed — potential breakdown from the trading range
The distribution thesis is developing into a potential markdown.
Watching for downside follow-through and failed rallies. 🎯
#QQQ #Wyckoff #MarketStructure
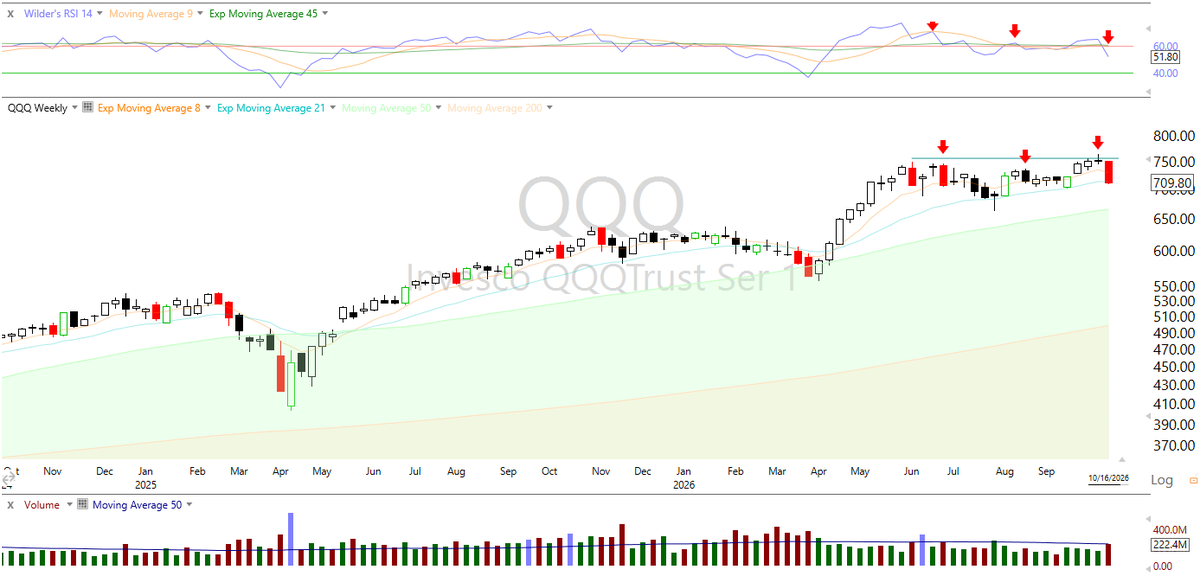
$QQQ Weekly Chart | Bearish Signals Stacking Up 📉
🔻 Bearish RSI divergence
🔻 Repeated RSI rejections at its moving average
🔻 Downside range expansion following upthrusting action
🔻 Heavy volume confirming increased selling pressure
🔻 A potential weekly Evening Star reversal pattern
Momentum is weakening, supply is emerging, and downside pressure is building.
Watching for follow-through to confirm the bearish shift. 🎯
#QQQ #Wyckoff #MarketStructure
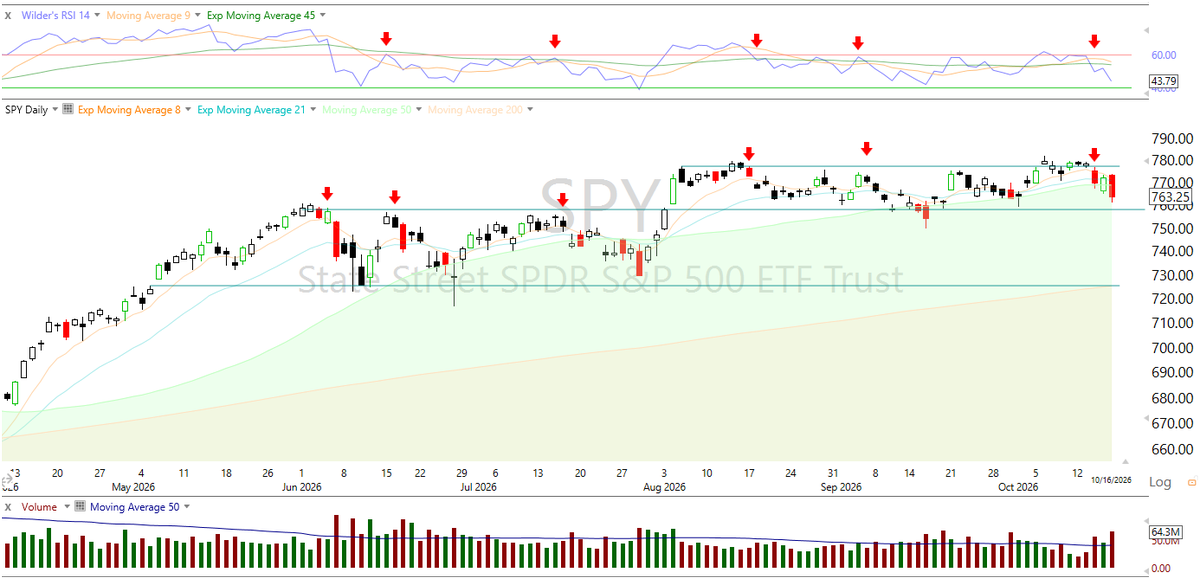
$SPY Daily | Wyckoff Structure 📉
🔻 June 2–3: Bearish RSI divergence near a potential Buying Climax (BC), followed by wide-range down bars on expanding volume — early signs of selling pressure.
🔄 June–July: Trading range / potential distribution. RSI oscillated between 40–60 as momentum weakened.
🚀 Early August: Sharp markup above the range — a potential Sign of Strength (SOS), but follow-through is critical.
⚠️ August–September: Price stalled near the highs, with RSI slipping back into the 40–60 range — suggesting fading momentum and possible re-distribution.
🔻 September–October: Wide-range down bars on heavy volume signal renewed supply.
Wyckoff thesis: The August breakout may have been an Upthrust (UT), or potentially a UTAD if it followed a completed distribution structure. The subsequent weakness raises the risk of a markdown.
📉 Key confirmation: Continued weakness, failed rallies, and a Last Point of Supply (LPSY) would strengthen the bearish case.
Structure first. Confirmation before conviction. 🎯
#SPY #Wyckoff #MarketStructure
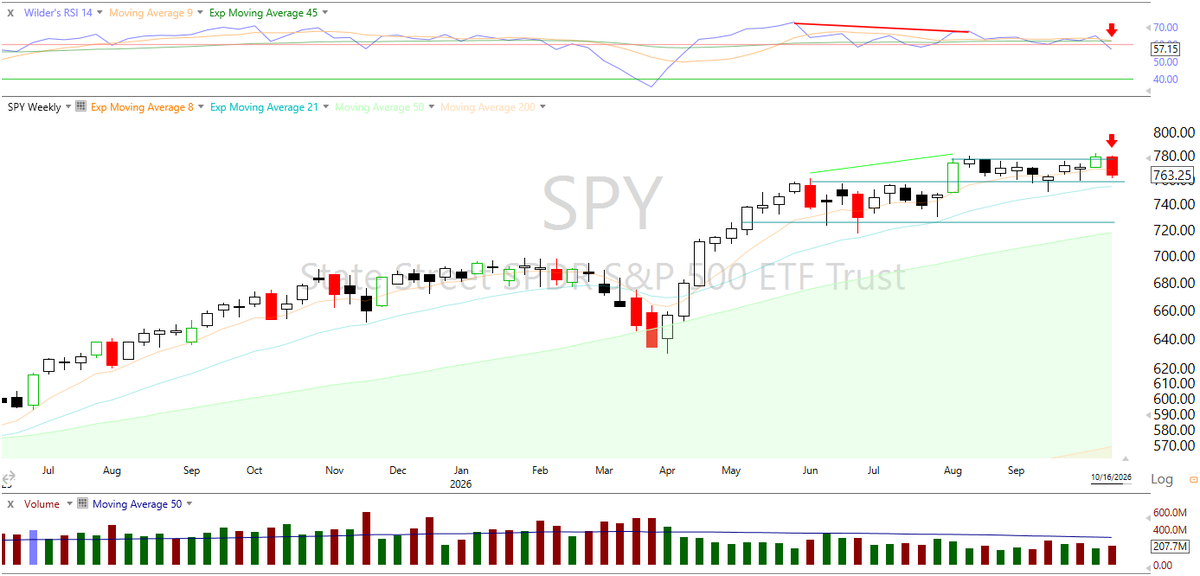
$SPY Weekly Chart 📉
Bearish signals are stacking up:
🔻 RSI bearish divergence
🔻 RSI failing to reclaim 60
🔻 Down weeks showing higher volume than up weeks
🔻 Range expansion to the downside
Momentum, volume, and price structure are pointing to growing downside pressure.
Watching for follow-through. 🎯
🔍 Before the market makes its next move, do your homework.
Weekend analysis starts now.
First stop: weekly charts of the major indices, ETFs, and market-moving stocks.
📊 Trend & market structure
🔄 Sector rotation & relative strength
📈 Momentum & key levels
Macro → Market Structure → Preparation.
The goal: know what matters, identify the shifts, and be prepared before Monday’s open. 🎯
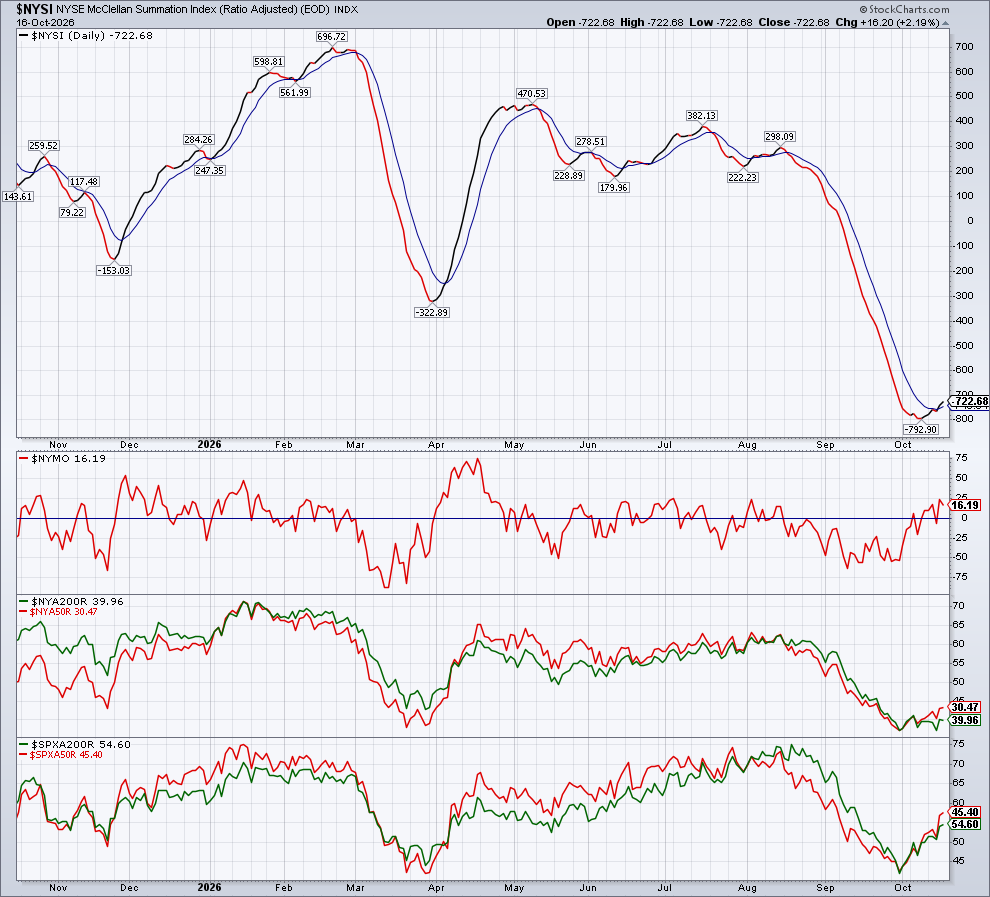
More Breadth - Oct 16, 2026 @StockCharts
$SPY $QQQ $DIA $IWM $MAGS $SMH $IGV
Nasdaq breadth: $NASI -774.68 (-4.33%), $NAMO -32.12. Decline accelerated again after yesterday’s slowdown — summation back to fresh lows.
NYSE breadth: $NYSI -722.68 (+2.19%), $NYMO +16.19. Second straight positive move in NYSE summation, holding the stabilization from yesterday.
% Above 50 / 200 SMA:
- S&P 500: 45.40% / 54.60%
- Nasdaq 100: 39.60% / 57.43%
- NYSE: 30.47% / 39.96%
- Nasdaq Composite: 22.21% / 33.01%
NYSE/S&P 500 breadth continues to firm up even as price pulled back today, while Nasdaq Composite breadth keeps eroding - the divergence is widening, not narrowing.
Sector leadership still reinforces it: $XLV Healthcare and $XLP Consumer Staples leading the S&P 500 sectors.
The takeaway: Growth internals are deteriorating under the surface while Value/defensive breadth holds up - rotation story staying intact into the weekly close. #MarketBreadth
Quoting my morning post: “Monthly OPEX: Is volatility about to unpin?”
$SPY $QQQ $DIA $IWM $SMH $IGV $MAGS
Here’s how it unfolded today. 📉🐻
I laid out the bearish case using deteriorating breadth, late-stage Wyckoff Distribution in $SMH $MAGS $IGV, defensive sector rotation, and the risk of a failed bounce below the ICE.
Then $SPX dropped roughly 100 points in a few hours, reaching my first target.
The setup was mapped before the move- not explained after it.
Macro → Breadth → Structure → Key levels → Execution.
This is why I document the process in real time.
Connect the dots. Let price confirm. Execute with precision. 🎯
$SMH -Weekly Chart Analysis 📉
The warning signs appeared in sequence:
🔻 RSI bearish divergence
🔻 Clear rejection at the RSI moving averages
🔻 Downside follow-through with increasing volume
Momentum weakened first. Price confirmed the message.
This is why I watch RSI and price action together - not in isolation.
#SMH #RSIEdge #TechnicalAnalysis
This was a top-down, multi-layer market analysis - the kind of framework used in institutional market research and trading. 🎯
$SPY $QQQ $DIA $IWM $SMH $IGV $MAGS
📊 Market breadth and internals
🔄 Sector rotation and relative strength
🐻 Wyckoff distribution structures
💰 Money flow and leadership shifts
📅 Options expiry and volatility dynamics
📉 RSI and momentum
⏱️ Price action and key levels for precise execution
Macro → Market Structure → Setup → Execution.
The edge comes from connecting these signals into one coherent thesis, then using price action to define the trigger, targets, and invalidation.
Not just predicting direction. Building a thesis, mapping the levels, and executing when the evidence aligns. 👊
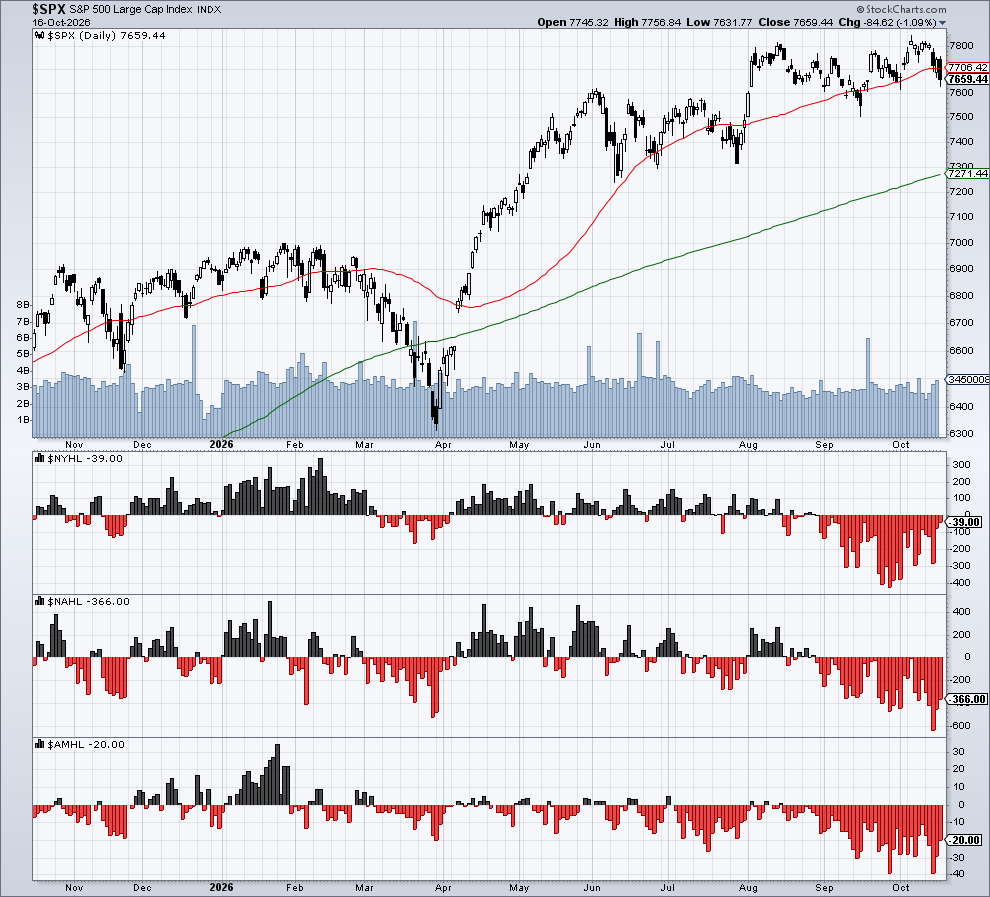
EOD Breadth - Oct 16, 2026📊 $SPX @StockCharts
$SPY $QQQ $DIA $IWM $SMH $IGV $MAGS
$SPX down -1.09% to 7659.44, closing the week on a weak note after failing near the highs.
$NYHL -39 — improved meaningfully from -279/-123 earlier this week
$NAHL -366 — still negative, but better than the -643 low mid-week
$AMHL -20 — also improving
Breadth readings have been choppy but trending less negative into the weekly close, even as price fell today.
Will be watching Monday closely to see if this stabilization holds or the selling resumes.
RSI Matrix - Daily/ Weekly/ Monthly📊 Oct 16, 2026
Broad deterioration on the daily - everything down another notch, $SMH and $IWM both sub-32, deep in weakness. $DIA still the relative leader but even it cooled off from 55 to 52.
Since this is the weekly close, the weekly column matters more for the bigger picture: $DIA 53.8, $MAGS 57.4, $SPY 57.1, $IGV 54.6 - all still in the mid-50s, holding the neutral/bullish zone. $QQQ 51.8 just barely above the midline. $IWM 39.0 and $SMH 48.3 are the weak spots on weekly too.
Net takeaway: daily is flashing clear caution across the board, but weekly hasn’t broken down yet - the bigger trend is still intact, just losing momentum. Worth watching whether next week’s open confirms a deeper pullback or this was just digestion.
☕️ Monday Market Watch
Last week saw a significant rotation from Growth into Value, adding pressure to $SPY and especially $QQQ, which was already showing weakness.
Will that rotation continue, or will Growth find its footing? #SectorRotation
Watching price action, market breadth, and sector leadership for clues. Let the market show its hand. 🎯
$SPY $QQQ $DIA $IWM $SMH $IGV $MAGS