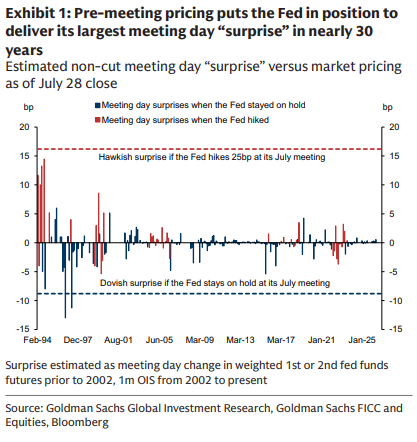
With interest-rate futures markets pricing in a one-third chance of a Fed hike today, whatever the Fed does will be the largest "surprise" at a non-rate-cut meeting since 1997, according to Goldman Sachs.
A hike would be "the largest meeting-day surprise outside of cuts since the Fed started releasing statements to announce policy-rate changes."
The last 30 days have reminded many of a key lesson when investing.
Fear and greed are the two most powerful drivers of price action.
This an entirely mechanical move driven by excessive green in the market.
Follow us @KobeissiLetter for real time analysis as this develops.
Absolutely incredible.
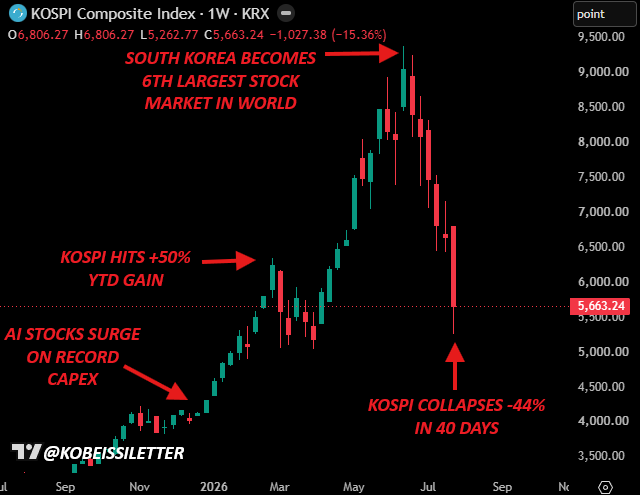
In an unprecedented move, South Korea's stock market just collapsed -44% in 40 days, erasing -$2 trillion in market cap.
Now, South Korea's finance ministry has announced plans to "stabilize" the market.
What is happening? Let us explain.
(a thread)
‼️Retail investors in South Korea have been completely DESTROYED:
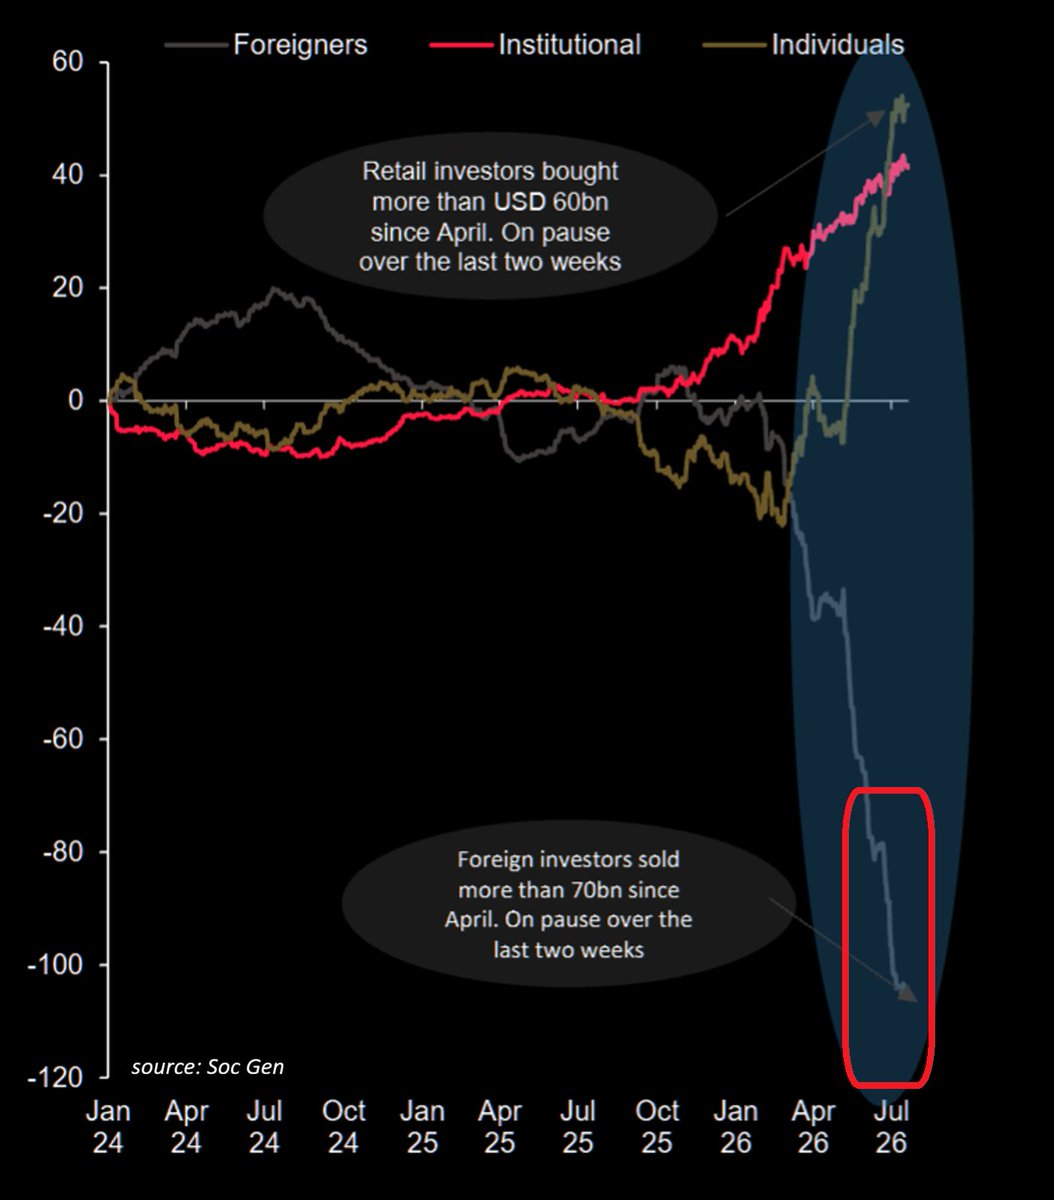
Mom-and-pop investors have bought +$60 BILLION of South Korean stocks since April.
At the same time, foreign investors have dumped more than -$70 billion.
Year-to-date, investors from overseas have sold over -$110 billion of Korean stocks.
Meanwhile, the KOSPI index is down -35% so far in July, on track for its worst month EVER.
This is MIND-BLOWING.
Investors are piling into US equities at a record pace:
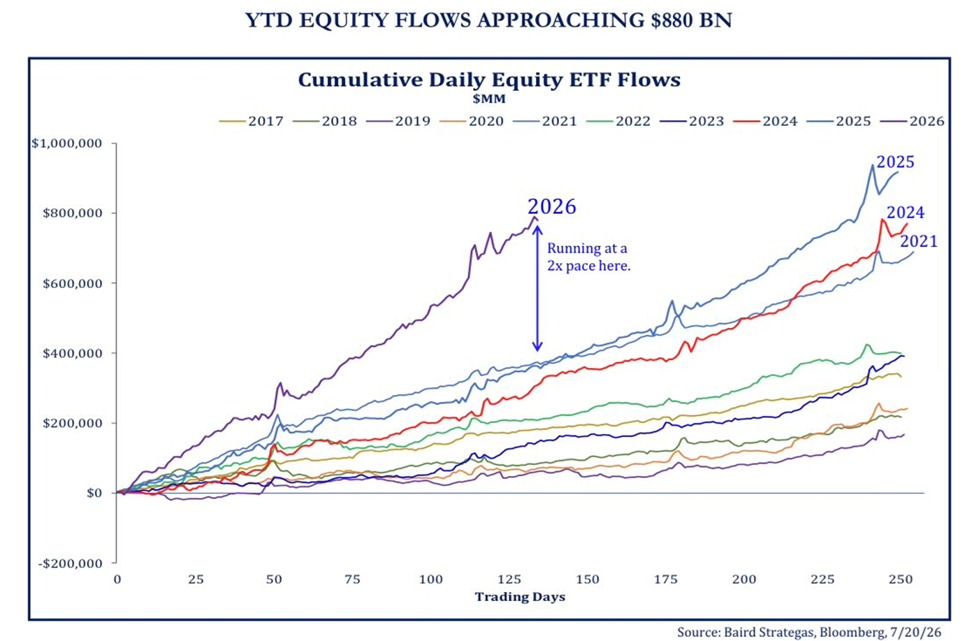
US equity ETFs have attracted +$880 billion in inflows year-to-date, on track for their largest annual inflow on record.
This already surpasses every full-year total except the all-time high set in 2025.
Furthermore, current inflows are more than twice the levels seen at the same point in 2021 and 2025.
At this rate, annual inflows will exceed +$1.4 trillion by year-end.
This would be ~$500 billion above the 2025 record of ~$920 billion.
Investor demand for US equities is unprecedented.
this chart goes back to 1972 and has never printed this number
The 3-week realized vol of the momentum factor is now 4x the vol of the S&P 500. Not 1997, not 2000, not 2008, not the 2021 unwind. Never.
Translation: the index is quiet while the stocks inside it swing like it's a crisis. Winners get dumped, losers get squeezed, and the rotation eats momentum traders alive.
When maximum churn meets minimum index movement, someone is handing over a lot of shares. Distribution rarely announces itself louder than this.
The scariest chart on Wall Street isn't saying what people think it is.
The Morgan Stanley Tech Momentum Index just printed a 17-day rate of change of -35.9% — the worst reading in its 27-year history.
Most investors are reading this as the AI trade breaking.
I see a factor unwind, not a fundamental one.
Momentum is one of the most successful investment factors ever discovered. Decades of research have shown that stocks with the strongest price trends tend to keep outperforming.
That's why it has become the foundation of countless quantitative strategies.
When everyone owns the same baskets, it doesn't take much: a quarter-end rebalance, thin summer liquidity, or a headline taken the wrong way for everyone to rush through the same exit.
This time, we had all of the above, on top of one of the strongest momentum runs in years.
The problem isn't momentum.
The problem is that too much capital is now chasing the same momentum signals.
But factor investing is very different from fundamental investing.
For fundamental investors, these periods often create the best opportunities because the edge isn't in owning the broad theme. It's in understanding what each company actually does within the value chain.
During times like this, we revisit every part of our coverage universe and ask a simple question:
What's actually getting stronger?
- Cheaper AI models may pressure AI lab economics, but they also drive higher adoption, more inference, and ultimately more hardware demand.
- More memory capacity may eventually normalize memory pricing, but every new wafer requires billions of dollars of semiconductor manufacturing equipment.
- AI spending isn't ending; it's broadening. Leadership is rotating from one part of the value chain to the next.
The market is confusing forced selling with deteriorating fundamentals.
Those are two very different things.
Link in comments for the latest Tech Edge that includes a primer on quant vs. fundamental investing.
Feels bad, -49.4% drawdown this month after the recent crash.
My portfolio is mainly AI chokepoints and bottlenecks.
In the memory, photonics, robotics, and upstream semis, (on margin) which all tend to be higher beta than others. But reduced leverage recently from the crash.
I see a lot of people making fun of the drop or AI names, saying it’s obvious that:
- “AI is a bubble”
- “memory/kospi is a bubble”
- “photonics is a bubble”
- “humanoids won’t get anywhere”
- “neoclouds will get replaced by hyperscalers like Meta”
And a bunch of retail + bots saying “sell everything, it’s never going to recover”.
But I have conviction that all these themes are backed by structural revenue growth or technological shifts.
And I’ve had similar drawdowns back when there admin threatened global tariffs, before markets pulled off a recovery.
I personally have a longer horizon + higher tolerance for volatility than others, to see how this plays out.
Especially considering a lot of retail view things on a week to week basis: no, my thesis isn’t wrong yet if I project revenue inflection in H2 2027 and it’s 2026 now.
Anyway, feels bad short term just wanted to share anyway for transparency.
🚨SPACEX'S BONDS ARE THE REAL STORY, NOT ITS SHARE PRICE:
A $100 million allocation in SpaceX's 2056 bonds is now worth just ~$90.7 million, a loss of -9.3% in under a month since the $25 billion offering priced.
More than two-thirds of that loss came from investors demanding a bigger risk premium specifically for SpaceX, not from the general decline in bond prices.
The $SPCX bond's credit spread, the extra yield paid over Treasuries to compensate for risk, has widened from +175bps at pricing to +231bps now.
This makes SpaceX's 2056 bond the worst-performing BBB-rated US dollar bond among 1,450 benchmark issues with at least $1 billion in face value.
Meanwhile, $SPCX stock has fallen -38% from its post-IPO peak and now trades below its $135 IPO price, while the bonds themselves yield a junk-like 7.5%.
After a wave of massive corporate debt issuance, investors are demanding higher yields and are no longer willing to finance every large deal at tight spreads.
US corporate credit market stress is surging.
The scariest chart on Wall Street right now is actually one of the best buying signals in years (Save this).
The Morgan Stanley Tech Momentum Index just hit a 17 day rate of change of -35.9%, the worst reading in the index's entire 27 year history.
The Goldman Sachs High-Beta Momentum Index is down -24% month-to date, the worst performance since April 2009.
Before you panic, you need to understand what these numbers actually measure because this is not the AI buildout collapsing but rather a momentum factor unwind and those are two very different things.
A momentum strategy is simple, buy whatever has gone up the most, short whatever has gone down the most and in H1 2026, that strategy returned a historic 57% because AI stocks went nearly straight up.
When a trade gets that crowded, Goldman tracked momentum positioning at the 100th percentile of the last five years, it gets fragile.
One trigger causes every fund running the same playbook to sell at the same time and you get a cascade that has nothing to do with the actual businesses underneath.
The triggers here were textbook, low holiday week liquidity, end of quarter rebalancing, profit taking after a record first half and a widely misread headline about Meta and data center capacity.
The fundamental view remains positive and while JPMorgan said buy the dip and UBS called it an orderly de-risking exercise, not a forced liquidation.
The data that actually matters hasn't moved.
Hyperscalers are still guiding to $1.4 trillion in capex by 2028, a number Morgan Stanley just raised 9-10% for 2027 and 2028.
Micron's entire HBM4 supply for 2026 is already sold out under long-term contracts, Nebius has $12 billion locked in from Meta and $17.4 billion from Microsoft.
None of those contracts changed because a momentum index printed -35%.
Goldman's own historical data shows that momentum selloffs of this magnitude since 2006 were followed by average gains of 1.45% the following week and nearly 23% over the next year.
The worst momentum reading in 27 years sounds terrifying but what it actually means is that the trade got too crowded after a historic run and now it's flushing out the weakest hands.
The only question left is simple, are you buying from the weak hands or are you one of them?
The biggest opportunities are often created by the biggest overreactions and make sure to follow me @MelvinInvests for more.