If you do a lot of #numpy in your day to day scientific work, it's time to give #JAX a shot. Almost a like for like drop in replacement for numpy, with 40-60% speedups (on CPU). A short benchmark is below:
https://t.co/FvhUogJUqo
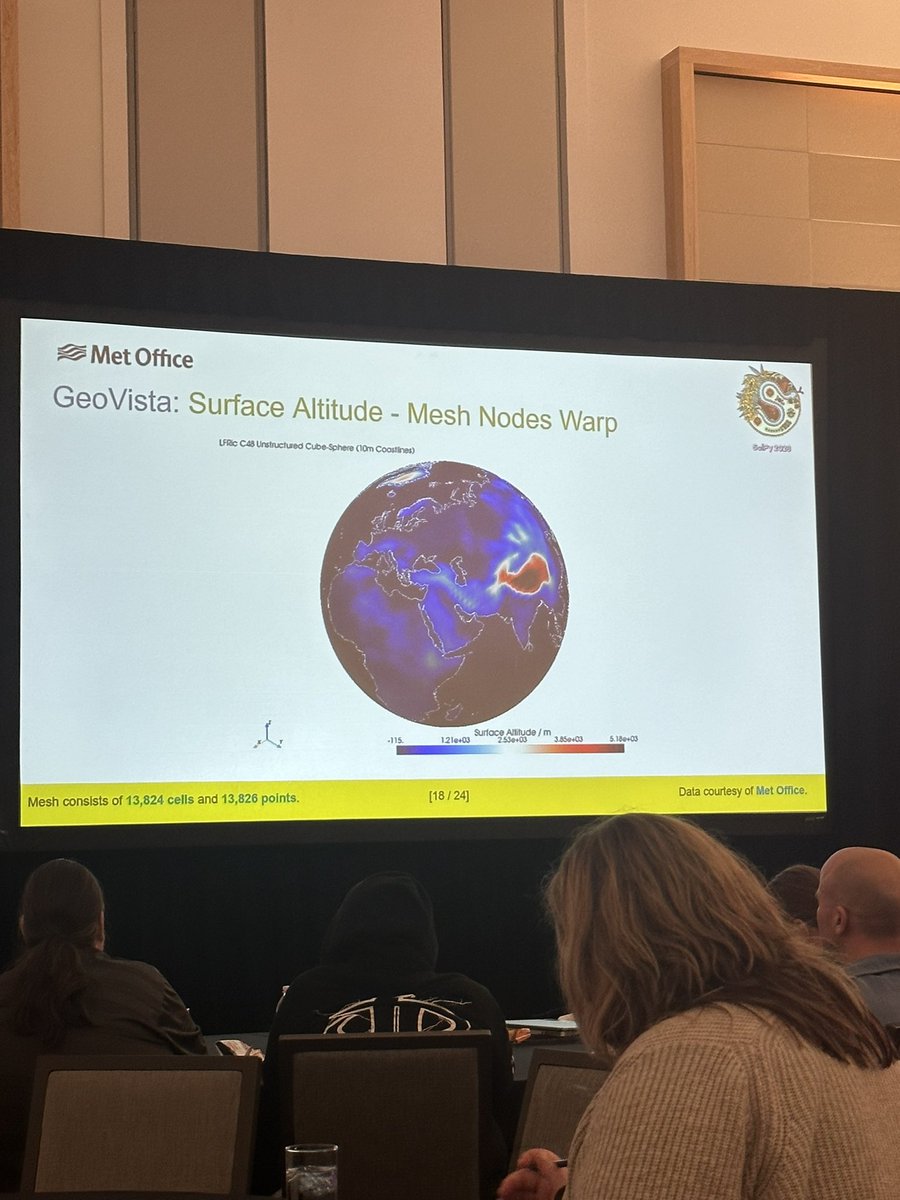
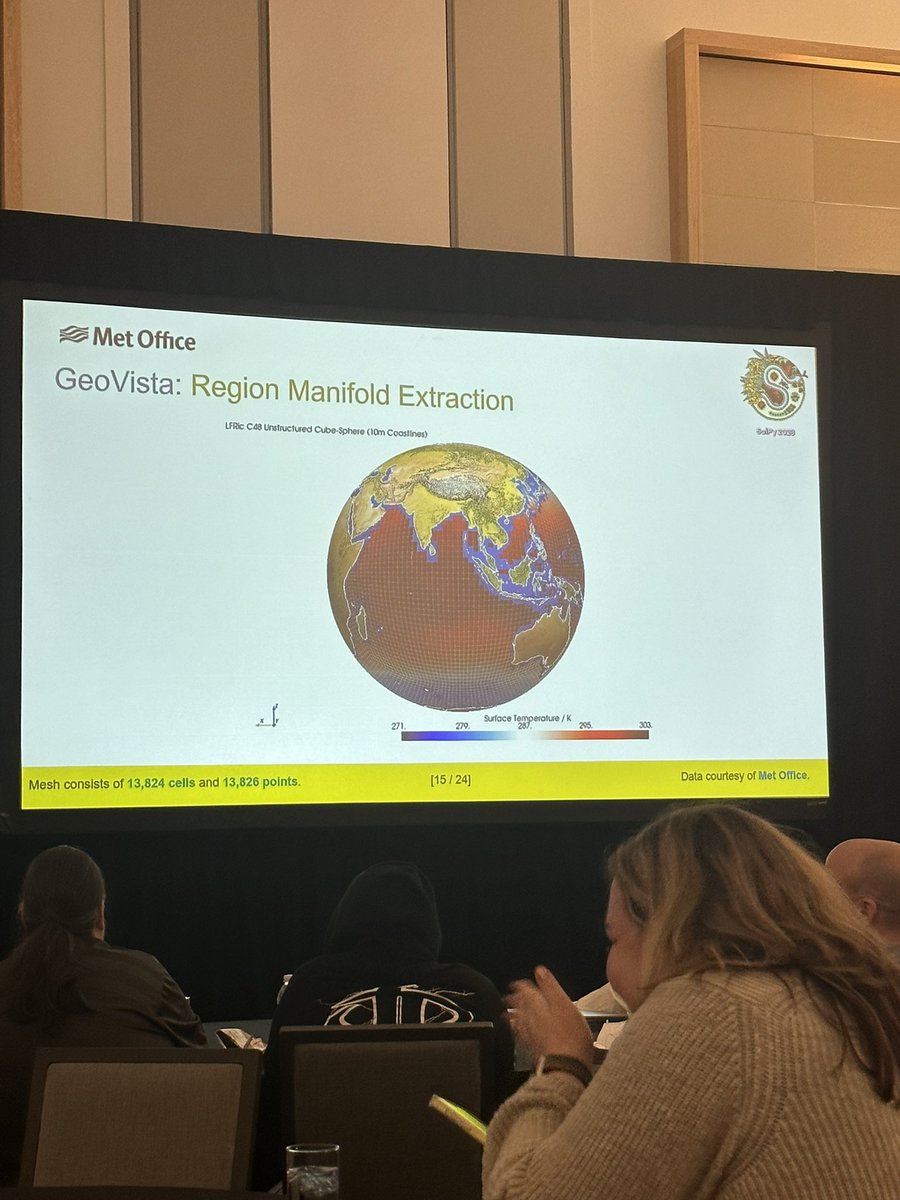
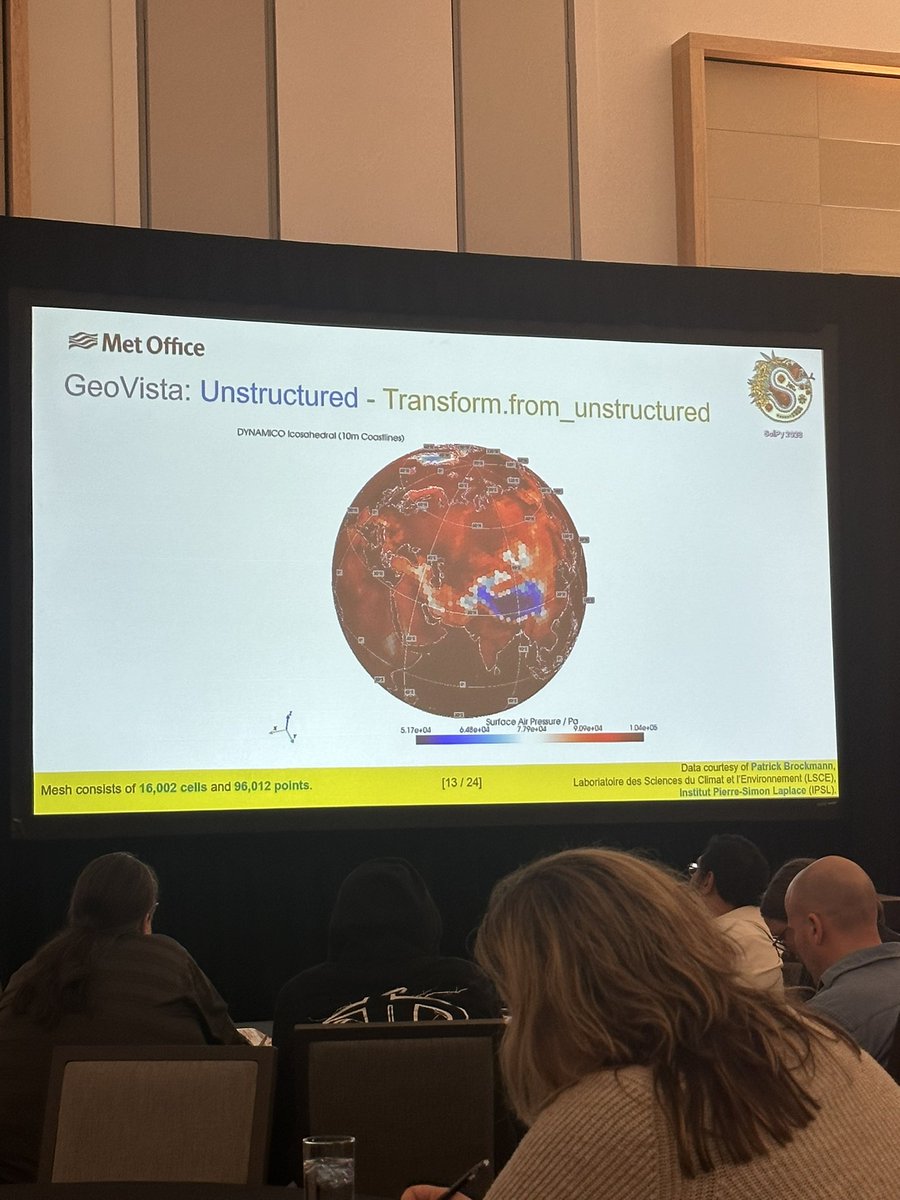
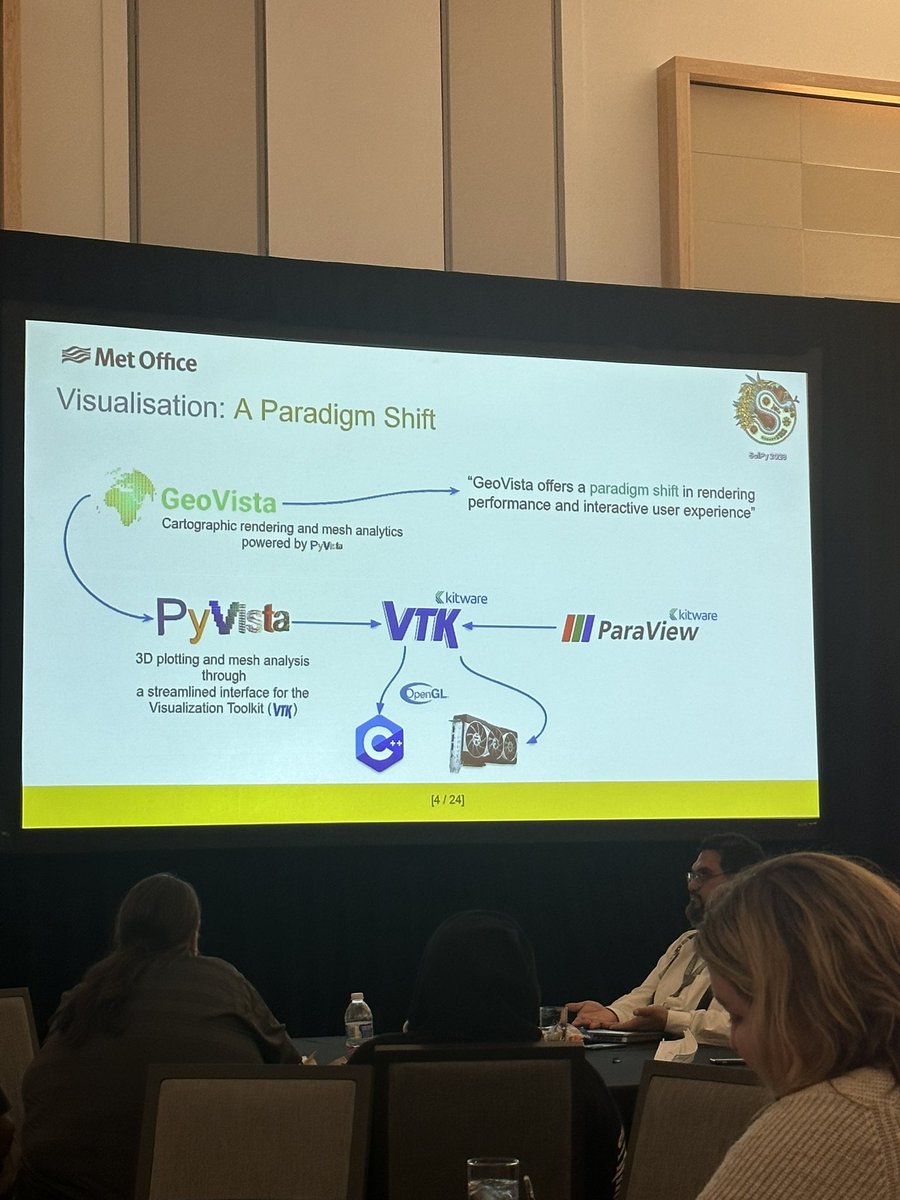
#GeoVista by @billjameslittle continues to impress!! Fantastic demo of how #PyVista can handle global datasets with cartographic projections https://t.co/lH9ACTbeJC
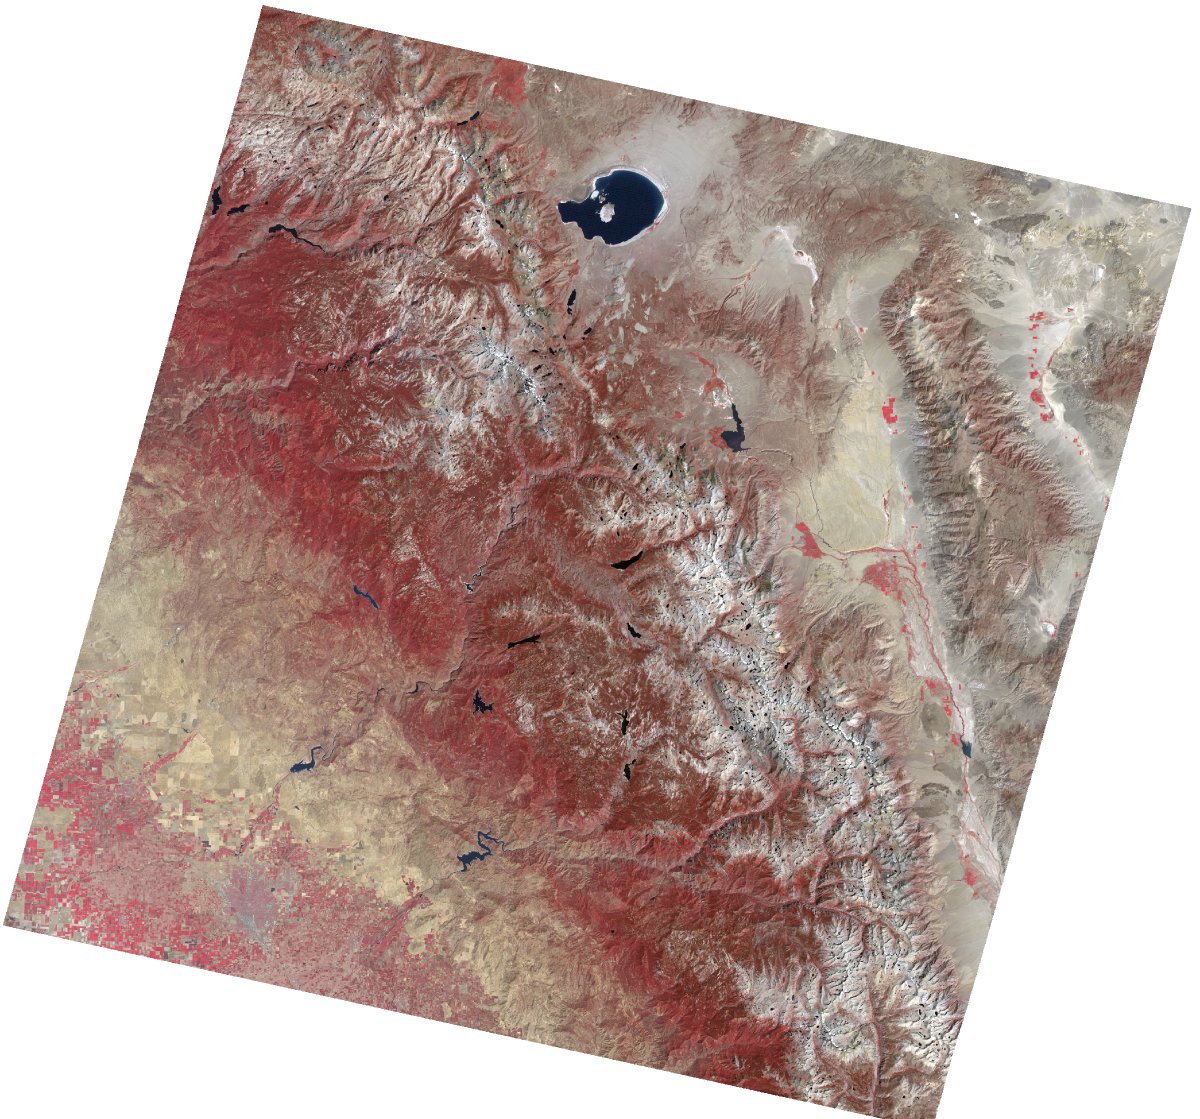
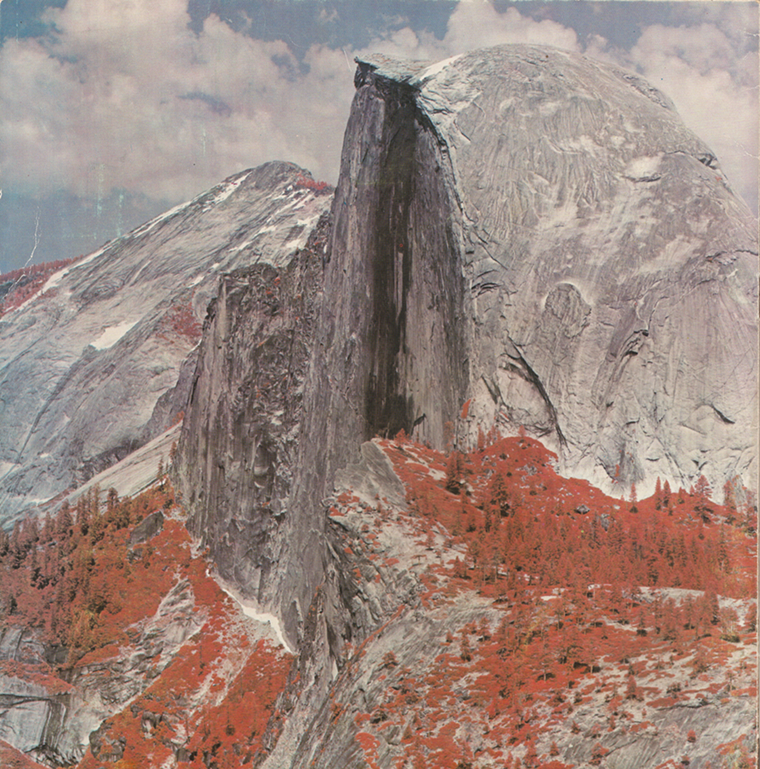
Using GDAL for data visualization. Wherein I try to explain the difference between "imagery" and "data", with the help of two radically different pictures of the same place with the *exact* same instrument: https://t.co/wpXNaDYVx9
#PyVista v0.40 has arrived! So many new features to try out. My favorite: embedding #3D visualizations in #Python documentation with sphinx-gallery https://t.co/O6gyiqup7K
Not all COGs are COGs. Learn more about Cloud Optimized GeoTIFFs and some of the challenges my team at @Kitware faced. #cog#geospatial#CloudNative#geotiff
https://t.co/f4trQfqSOt
I am very honored to be featured in the 1st edition of “Geoawesome People in EO”. Thank you @geoawesomeness for featuring me 🌎
https://t.co/LAugtHmdk0
#geospatial#eo#opensource
📣 We’re having a "3D Visualization with PyVista" 4-hour tutorial at #SciPy this July!
We'll showcase the forefront of 3D visualization with #VTK and #PyVista — such as diving into using @Kitware's #Trame for #Jupyter and web #3D#visualization
https://t.co/xAxTNWwOAu
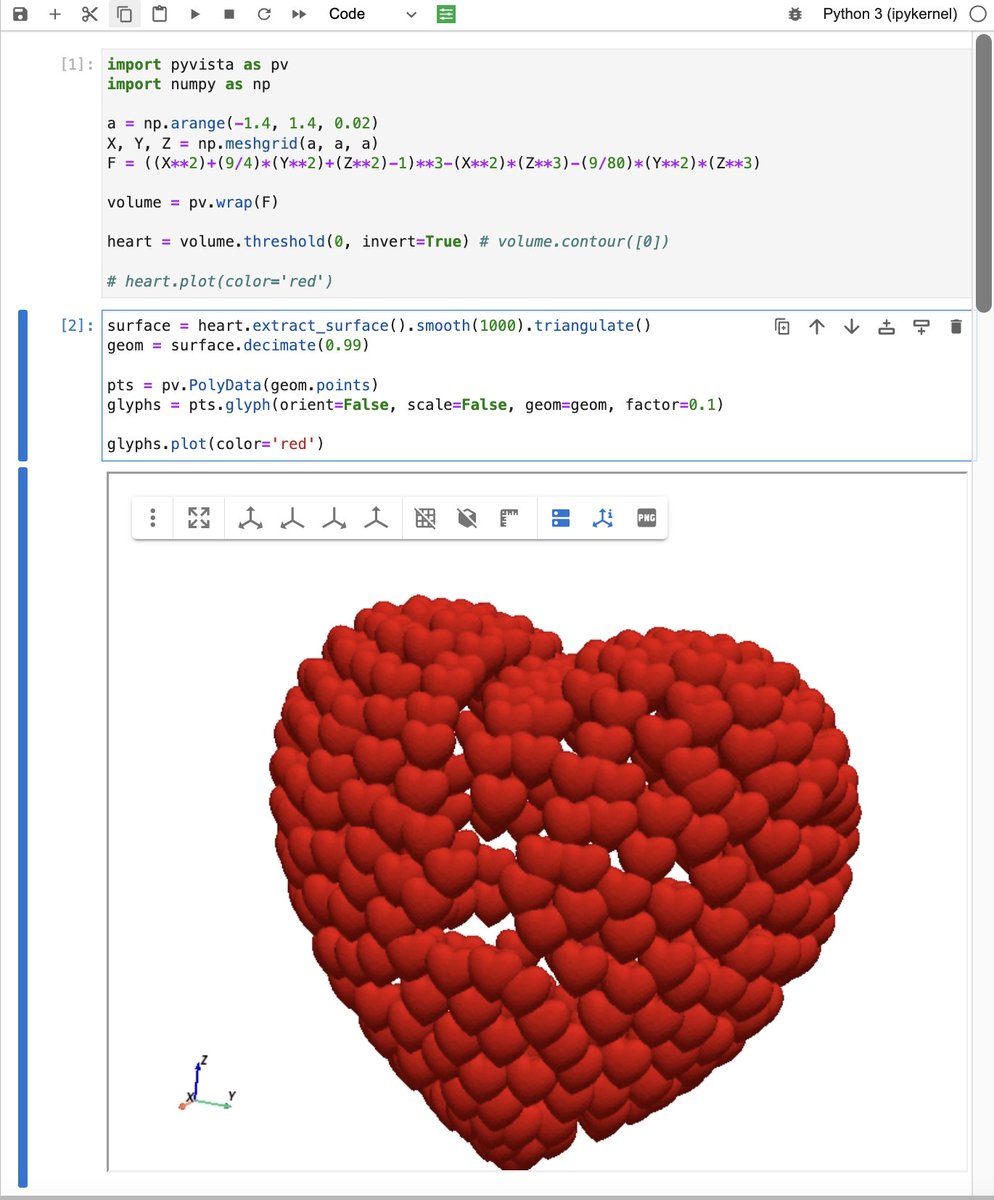
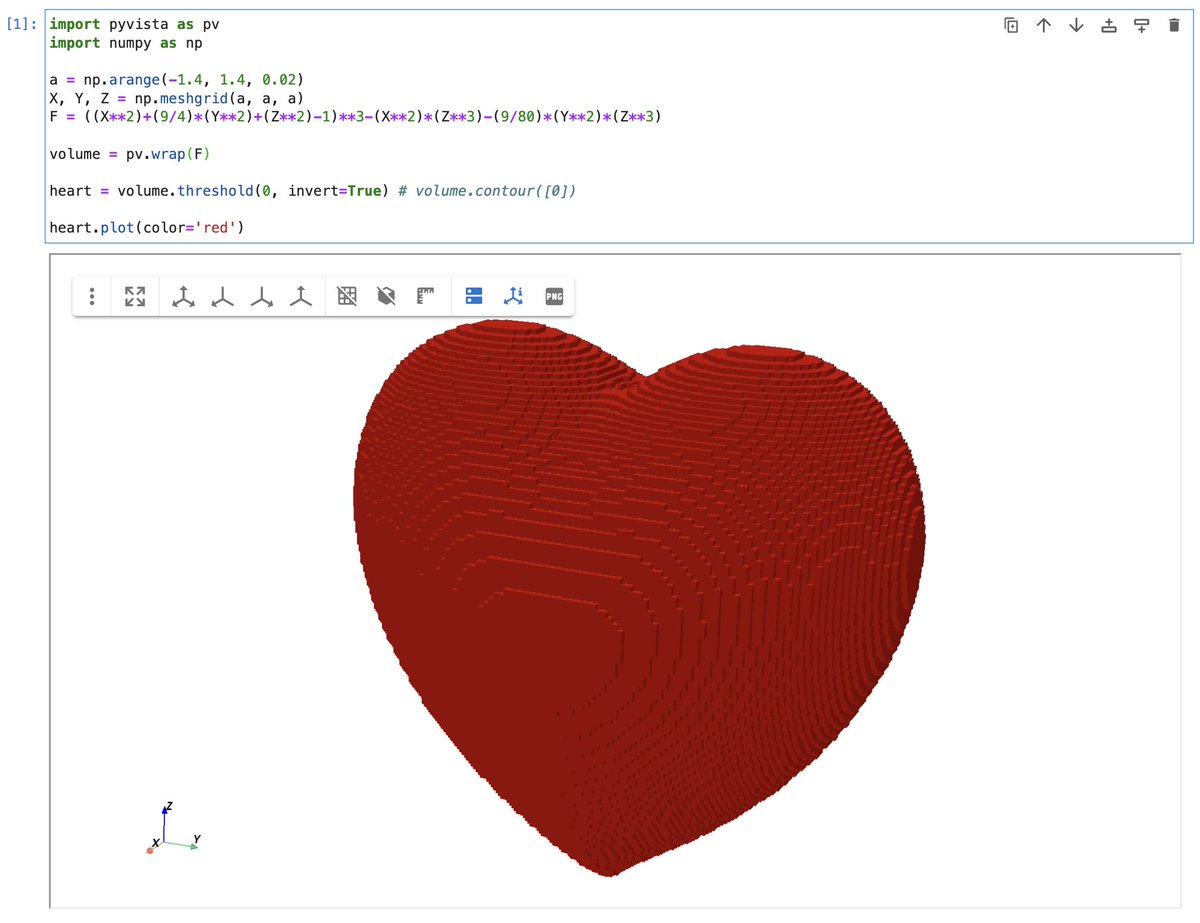
@ThomasM_geo@rafaelotinoco@IsamarCortes1 In Python? Enter #PyVista
import pyvista as pv
import numpy as np
a = np.arange(-1.4,1.4,0.02)
X,Y,Z = np.meshgrid(a, a, a)
F=((X**2)+(9/4)*(Y**2)+(Z**2)-1)**3-(X**2)*(Z**3)-(9/80)*(Y**2)*(Z**3)
volume = pv.wrap(F)
heart = volume.threshold(0, invert=True)
heart.plot(color='red')