$BTC touched $62,000 Wednesday and stood Thursday morning at $63,813, down 0.31 percent.
The figures that matter: hawkish Fed minutes and a 50-basis-point call, $306.5 million of ETF outflows, and an oversold read that does not confirm a bottom.
#NVDA: What levels may technicians be watching?
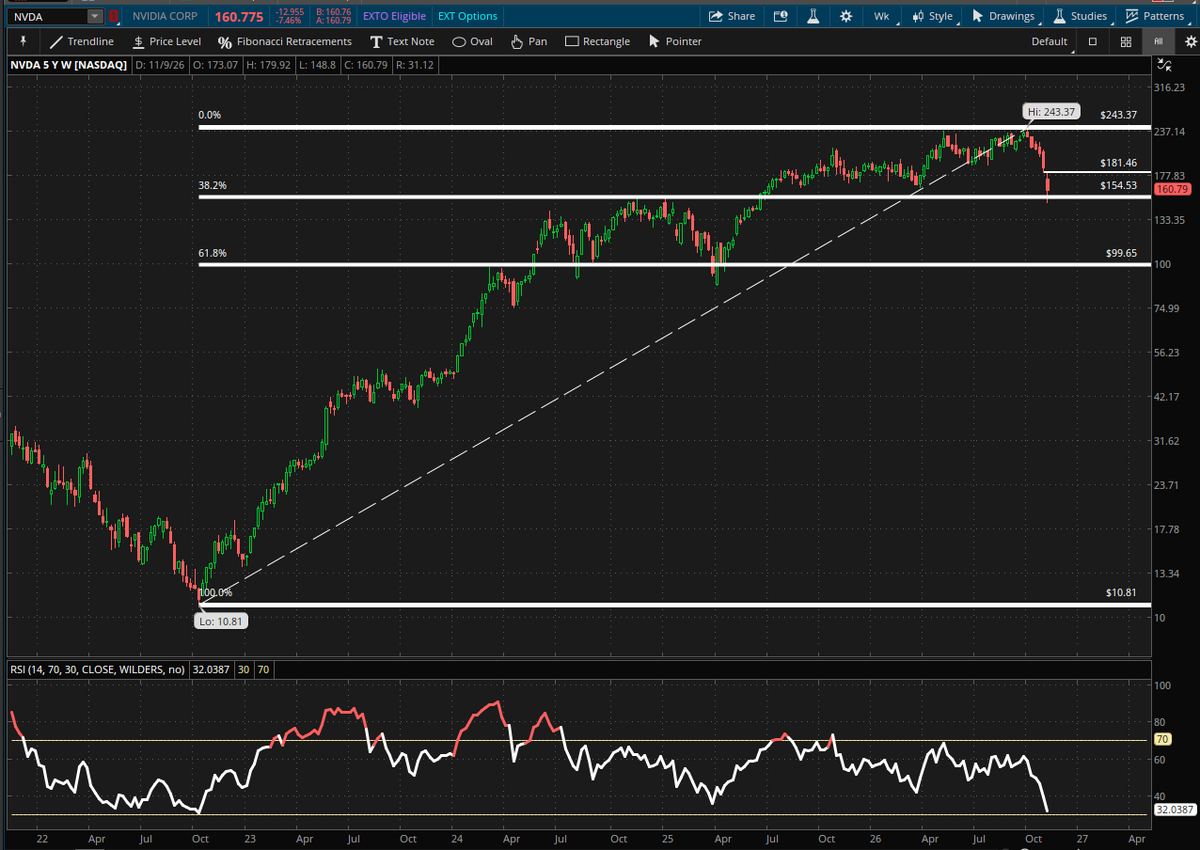
Today, #NVDA made new yearly lows, reaching oversold conditions on the daily Relative Strength Index (RSI). Oversold conditions can reflect the strength of a downtrend and do not necessarily signal that a reversal is imminent.
When price breaks support or resistance on a shorter time frame, technicians may zoom out to longer-term charts to identify potential inflection points.
On the weekly chart, #NVDA is testing potential support near its 2024 highs around $150–155, an area that also aligns with the 38.2% Fibonacci retracement of the advance from the 2022 bear market lows. Weekly RSI is also approaching oversold territory.
If the $150–155 zone does not hold, technicians may look toward the next area of potential long-term support near the 2025 corrective lows around $100, which roughly aligns with the 61.8% Fibonacci retracement.
*Schwab does not recommend the use of technical analysis as a sole means of investment research
*All names and market data shown below are for illustrative purposes only and are not a recommendation, offer to sell, or a solicitation of an offer to buy any security
*Chart source: thinkorswim
Hearing more amplified versions of "AI Bubble" and comparisons to the internet bubble burst in 2000.
Comparison:
Cisco Systems forward PE at it's internet bubble peak was nearly 150x (trailing PE ~200x).
Nvidia forward PE the all-time high last month was ~17x (trailing PE ~30x).
What I'm still watching... 👀
Bad news becomes bad price action when liquidity is tight... and liquidity is still tight.
And bank lending standards are getting tighter, not looser, which continues to bode poorly for liquidity sensitive assets in the near term.