Hear ye, hear ye 🥁🙌
So happy and proud to announce that we won the Jean Monnet Prize for European Integration 2020 for our project “Home Is Where the Herz Is”
https://t.co/TEJjHeJkUo
Check it out ☺️❤️
https://t.co/eSDcI7gGG3
So proud of our team at @metropole_vie 🤩
European nations are the finest builders of cities in the world, combining efficiency and liveability with atmosphere and beauty. But today, despite huge demand, Europe is building only half as much housing as it did at its peak. What's gone wrong?
Well-intentioned EU environmental directives are part of the problem, creating a legal straitjacket on growth.
- The 2005 environmental impact statement for the Dublin City Centre light railway extension was 176 pages. Twenty years later, the report for the extension to Finglas is… over 7,000 pages.
- Lack of clarity over goose feeding sites in Dublin has led to permission for 1,200 homes being refused.
- Major infrastructure projects from Galway to Antwerp, and the Baltics to Germany, have fallen afoul of environmental rules.
What's the solution? Today @ProgressIreland has published a report showing how targeted changes to environmental directives can deliver the housing and infrastructure we need -- without costing the earth.
Our specific recommendations include move from a reactive regime to strategic protection, restoring the original purpose of directives, updating tests for public interest, and more.
You can read about them in our report (link below), which we're launching tonight in Brussels.
L'Insee avoue avoir fait d'énormes erreurs dans ses estimations de croissance pour 2023 et 2024 : elle a été bien + forte qu'annoncée d'où les inexplicables créations d'emplois ces années-là. Dès lors, le narratif sur la baisse de productivité est biaisé !
https://t.co/VehdvCrWVF
ASML became Europe’s most valuable company ever after a 60% year-to-date advance fueled by a clamor for stocks with exposure to the buildout of AI data centers https://t.co/UdxVzexTXO
How much does the world work? Excited to see our research with Emmanuel Saez on global working hours featured in the IMF F&D Magazine:
https://t.co/19fHjpiJOB
@thomasforth The argument is imho that non-market forces (or interests within a market that is considerably less free) are dominating the housing and construction market and that precisely that is a big part of the issue.
@thomasforth I mean, fair enough, but I'm not quite convinced that housing and construction regulations of various kind (local, regional, or national) can truly be compared to the free market and competition between cutting-edge chipmakers.
Have some spare time before dinner so writing up some short comments on this fascinating empirical paper @SethAckerman shared with me:
This Uppsala/Riksbank team used Swedish producer price index micro data (goods 2004-2019, services 2013-2019) to quantify how much price-index construction methodology (as in: accounting conventions) affects measured aggregate inflation, and, by extension, real growth rates reported in the national accounts. They replicate the official Swedish PPI from the underlying data, then run counterfactuals applying other countries' methodological choices to the same micro data.
The headline finding: lower-level aggregation choices alone produce inflation rate differences of around 0.5 percentage points per year on IDENTICAL data. So, applying Denmark's weighted geometric method to Swedish data lowers measured annual goods inflation by 0.48pp; Spain's unweighted arithmetic raises it by 0.49pp.
They estimate elasticities of substitution from the micro data (median 4.4 for goods, 5.5 for services, well above the values implicit in official methodology) and find that the theory implied ideal index produces annual inflation 3.9pp lower for goods and 3.1pp lower for services than the official Swedish indices.
They conclude that the results "pose a challenge for the comparability of inflation rates and real output growth rates across countries." Indeed.
So, if methodological asymmetries of this magnitude exist at the PPI construction level, comparable asymmetries are likely operating in the GDP deflator construction that drives constant series and that renders the 'wedge' between constant and chained series overtime an artefact of these method choices.
The magnitudes certainly match up: they show roughly 0.5-1.0 percentage points per year of inflation dispersion across countries using identical data from documented methodological choices. And compounded over 25-30 years, this generates 15-30 percentage points of cumulative divergence in measured real growth. This is pretty much the same order of magnitude as the wedge between the constant and chained series in the relative US-Europe productivity level since 1995. The plausible assumption you;d have to make is that US-Europe asymmetries are larger than within-Europe ones.
The cross-country variation is actually documented and systematic. the OECD has catalogued since at least 2011 which statistical office uses which aggregation method. These are not random choices and they produce measured inflation rates differing by close to a percentage point per year on the same data, accumulating to large multi-decade effects. This means the effects of harmonising these methods would be substantial.
It would also means that ICT sector deflation isn't the whole story: the entire architecture of price index construction varies systematically across countries in ways that mechanically produce divergent measured real output even with, again, the IDENTICAL underlying data.
https://t.co/GVv3WrUmf3
France, Italy and Spain are proposing a package of reforms that would ease the way for banks doing cross-border business in Europe, according to documents seen by Bloomberg News https://t.co/kQ6DdES7Ty
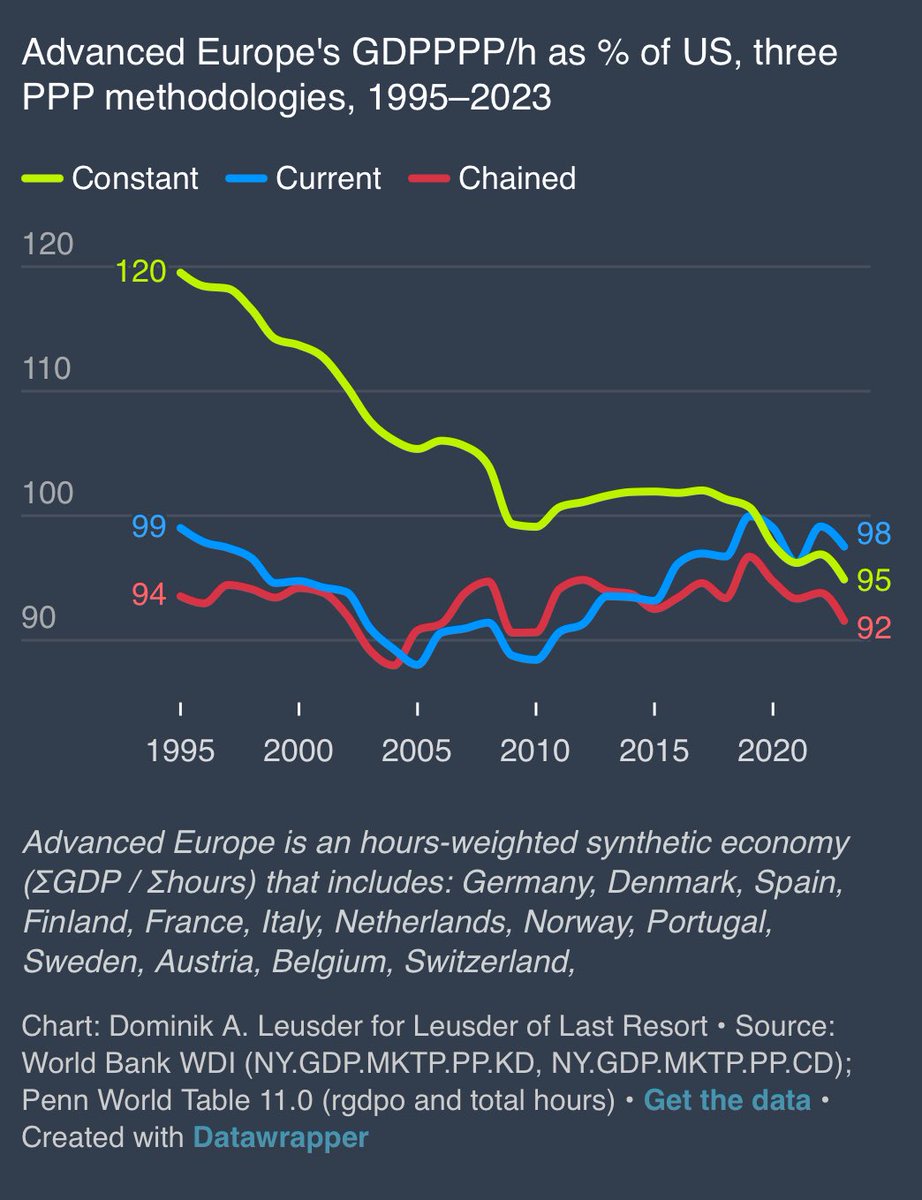
Since the debate has somehow evolved from ‘this and only this PPP construction’ to ‘we don’t like PPPs at all, it’s the national accounts that matter’ and ‘what matters is not the productivity level but the growth rates’, I think it’s worth asking the proponents of the constant series what they are claiming.
The constant series anchors at ICP benchmark year (2021 here) and uses the national account figures for everything else.
So, in the updated Draghi report graph, what those very same national accounts real growth rates (supposedly the only things that matter) suggest is that Europe didn’t “converge on the US 1995, then decline” but declined from a _super-parity_ in 1995.
With this country composition, Europe was at 120% of US levels; you can fiddle around with it and it still ends up at above 110%. This is implausible to say the least.
Can we please be serious: the main problem is not the PPP benchmark, or the current series, but the non-harmonised national accounts.
And constant series amplifies the distortions of the latter.
Why is why, again: the Conference Board and the World Bank caution against using the constant series for comparative long-run stuff, the IMF and Eurostat don’t even bother producing them.
Denmark’s economy will expand 3.7% this year, beating previous forecasts on the back of strong export gains driven by demand for Novo Nordisk products, according to Danske Bank https://t.co/HQqrBR5CHE
Der leichte Aufwärtstrend der #Wirtschaftsleistung, der sich bereits 2025 gezeigt hatte, setzte sich auch zu Jahresbeginn 2026 fort. Das Wachstum lässt sich vor allem auf die Herstellung von Waren und den öffentlichen Konsum zurückführen.
➡️ https://t.co/Bh0X3BUjwc
Eurozone exporters have faced a larger loss of competitiveness in the US than China due to € appreciation. For others, FX weakening offset the tariff impact.
But EU won't engage in a race to the bottom. Direction of travel is to build a protective wall around its single market.
Let me be more precise.
Under either current PPP or chained PPP, Western Europe's (EU-15) GDP per capita relative to the US has not declined since 2000 — and the EU-27, which includes Eastern Europe, has actually risen relative to the US.
A decline in EU-15 (with the EU-27 roughly flat) shows up only once you switch to constant national prices — the GDP-deflator concept — anchored at the 2000 PPP level.
That, I believe, is the crux of the debate.
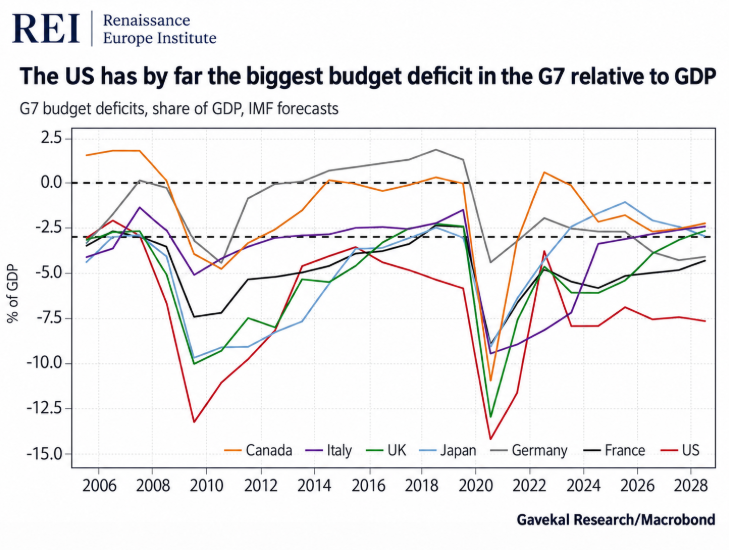
US growth is increasingly supported by fiscal excess.
In 2025, the US federal deficit was close to 6% of GDP, while the broader general-government deficit was around 7% of GDP — well above the EU average and higher than other major advanced economies such as the UK and Japan.
The IMF 2025 research also found that higher US debt and deficits are increasingly associated with higher long-term interest rates and term premia.
That fiscal position supports demand, corporate revenues, and employment in the short term, but the U.S. will eventually face a mandatory restructuring of its debt.
Net interest costs are now close to $1 trillion per year.
The OECD’s 2026 MAGIC database shows global industrial subsidies reached $108bn in 2024, the highest level since the global financial crisis.
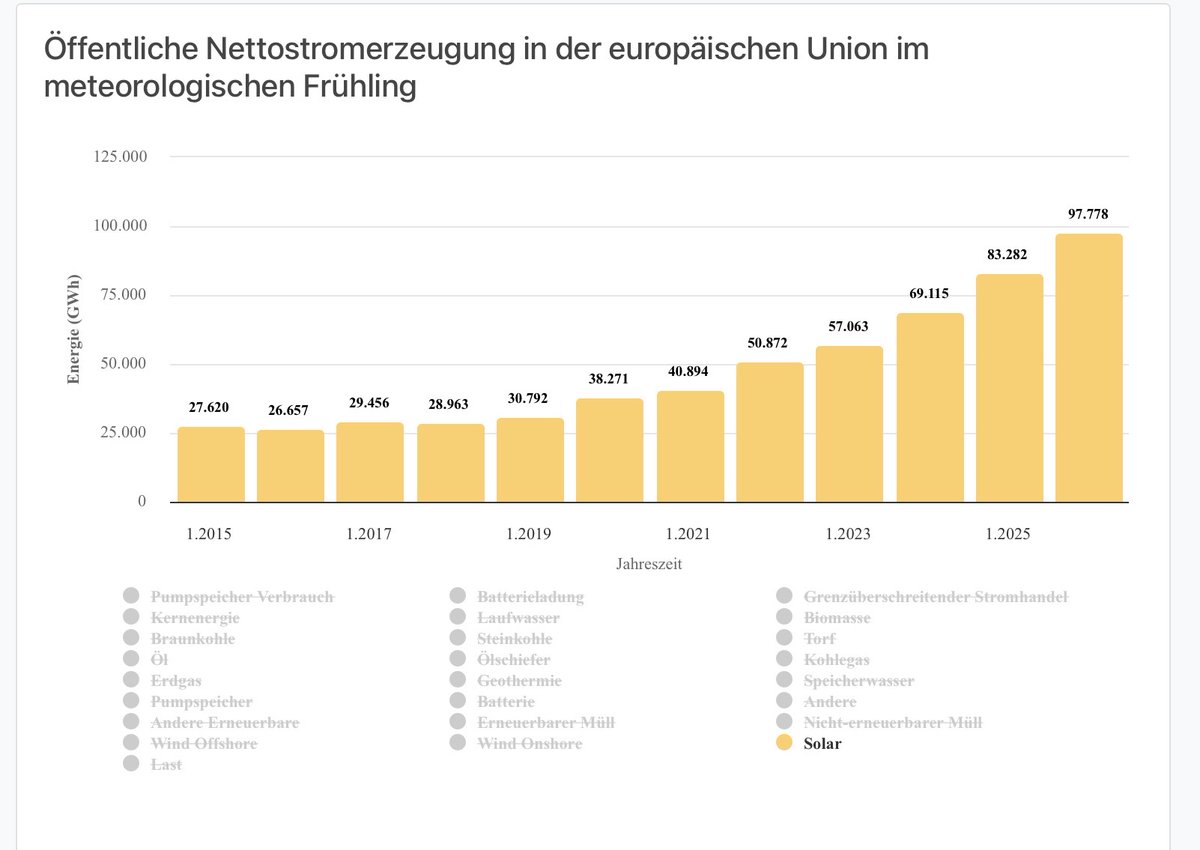
The OECD also finds Chinese firms received 3–8x more support than firms in OECD economies. This is how China scaled solar, batteries, shipbuilding, steel, EVs and semiconductors.
Solar PV was the most subsidised sector in 2005–2024. Result: China now controls 80%+ of the global solar value chain.
The U.S. did the same through defence procurement, DARPA, NASA, the CHIPS Act and the Inflation Reduction Act. America did not build its technological base through “free markets” alone.
Europe must stop pretending strategic sectors can survive without strategic capital.
Brussels should directly support European champions in chips, defence, AI infrastructure, nuclear, grids, batteries, telecoms, shipbuilding, aerospace, robotics and advanced manufacturing.
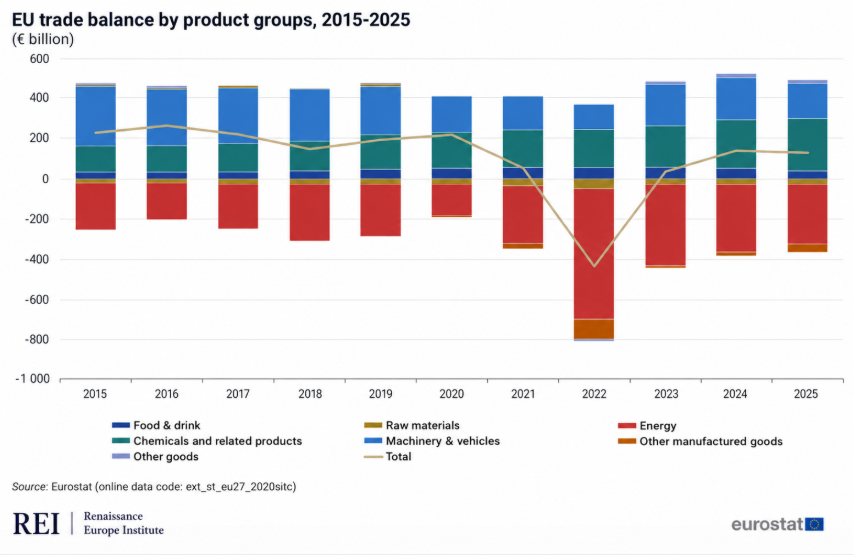
The EU remains a major external-surplus economy.
In 2025, the EU recorded a current account surplus of roughly €340bn, while its goods trade balance was also positive at €128bn.
By contrast, the United States ran a current account deficit of $1.12tn, equivalent to 3.6% of GDP.
Europe’s structural weakness is not its inability to export. It is its excessive dependence on imported energy.
In 2025, EU energy imports still cost €336.7bn. Crude oil alone accounted for €218.8bn, LNG for €56.4bn and pipeline gas for €60.1bn.
Without this fossil-energy import bill, Europe’s external surplus would be closer to €650–700bn — approximately 3.5–4% of GDP.
Energy independence is not only a climate objective. It is a macroeconomic, industrial and geopolitical necessity for Europe.
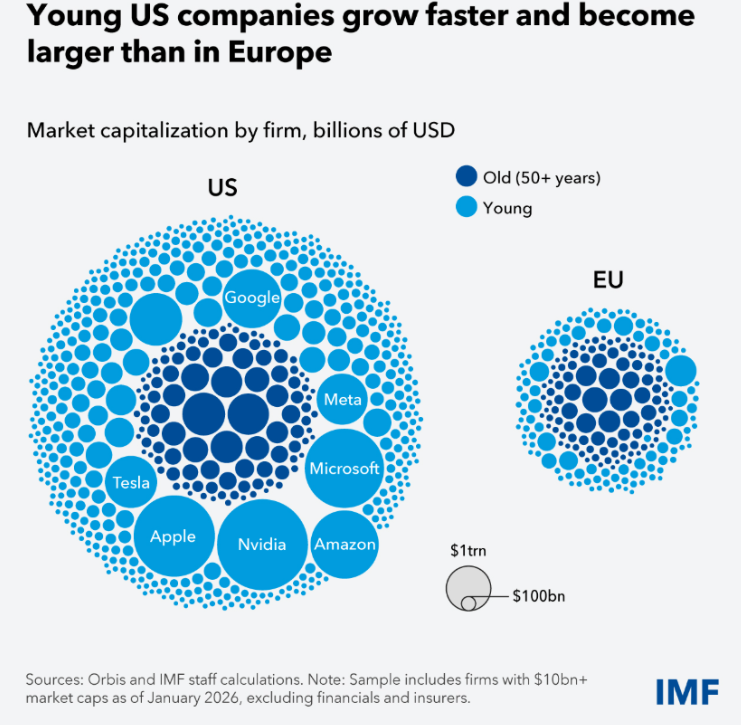
Europe’s startup problem is not mainly “too much regulation.”
That matters, but the bigger problem is capital scale.
In 2025, U.S. VC-backed companies raised around $340B. Europe raised roughly €66B in VC investment — around $70B+.
In other words, Europe attracted barely one fifth of U.S. VC capital, despite having a comparable economic size.
U.S. startups scale directly across a single market of 330M+ people. European startups scale country by country, massively reducing their speed, efficiency and growth potential.
That is the core difference: American companies raise more capital into one integrated market, while European companies raise less capital and then have to rebuild sales, hiring, legal, tax and regulatory structures across multiple national markets.
This is why young U.S. companies grow faster and become larger.
That fragmentation kills speed. Europe does not lack talent. It lacks capital depth.
The solution is not just "less bureaucracy".
It is a real Capital Markets Union and a true Single Market for companies, so European startups can raise larger rounds and expand across the continent as one market — not country by country.
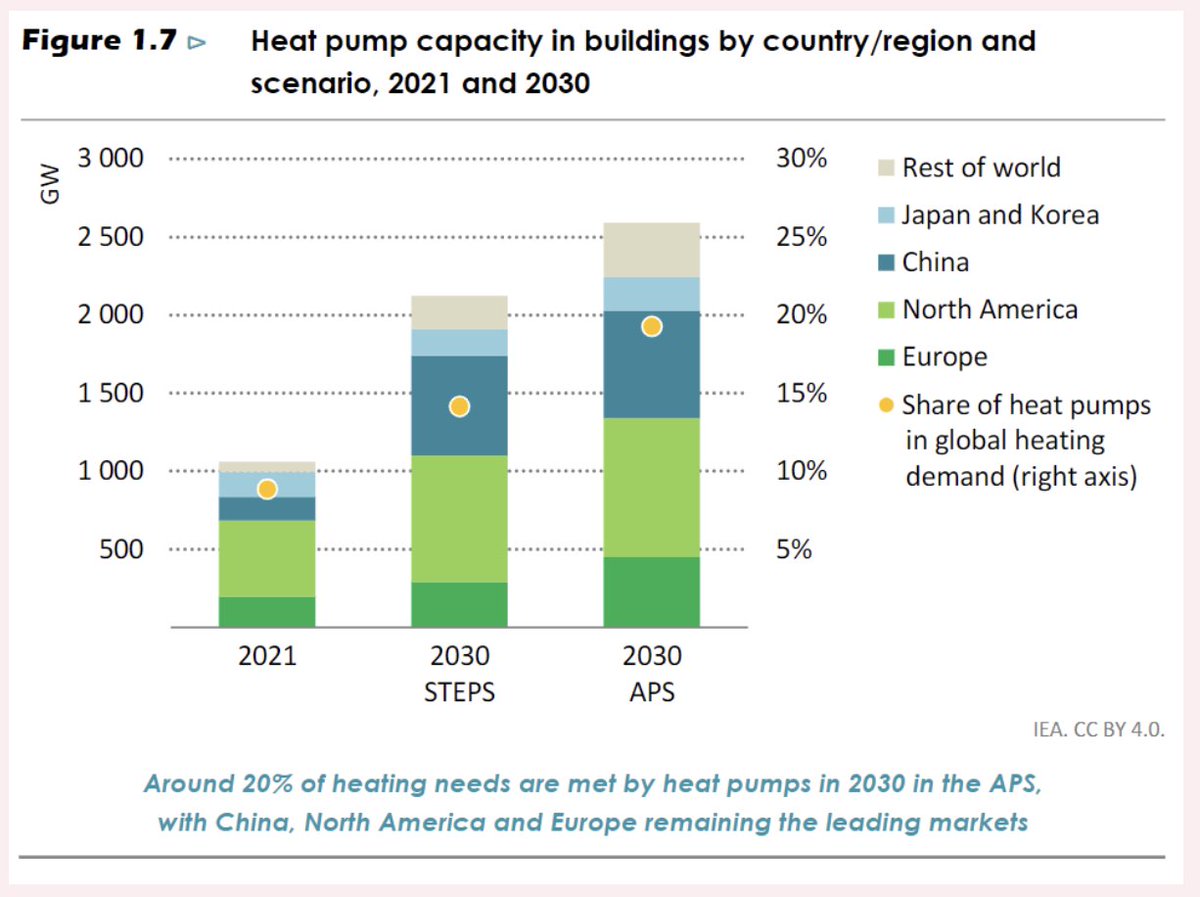
The boring heat pump is obliterating gas demand in Europe: heat pumps will cut 30 bcm of natural gas demand out of European buildings and light industry, each year, by 2030, a permanent structural erasure of gas demand
>30 bcm is about 20% of the entire annual output of the US LNG export infrastructure
>It's also 19% of Qatar’s entire annual global LNG exports, pre Hormuz
>And 80% of the total capacity of Russia's Power of Siberia 1, which ships 38.8 bcm/year to China
In Germany for example, heat pumps have outsold gas boilers for the 1st time in modern history. In the US, they've beaten gas boilers for 4 consecutive years
Every single heat pump is a non-reversible eviction notice for a fossil gas pipe