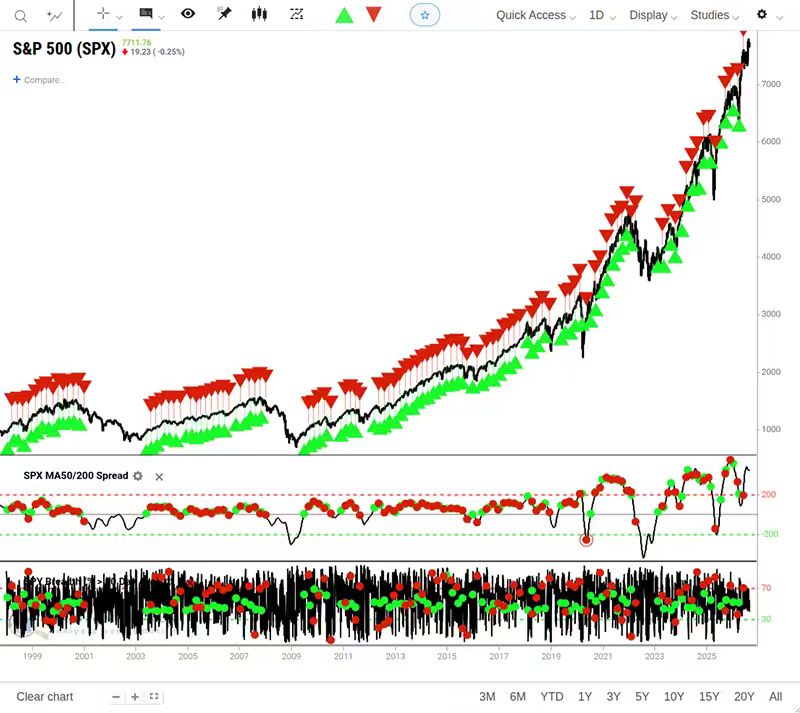
Breadth just crossed a key threshold.
When more than 40% of S&P 500 stocks are above their 10-day MA while the 50-day MA is above the 200-day MA, the S&P 500 was higher 2 months later 72% of the time.
A rising 50/200-day MA spread lifted the historical win rate to 79%.
August triggers have historically been weaker.
Read full analysis: https://t.co/m5keeRMFYg
Big Tech dominated earnings season:
The S&P 500's total market cap has surged +$1.75 trillion since Q2 earnings season began on July 13th.
The Technology sector alone accounts for +$1.39 trillion of that gain, or ~79% of the total.
Within tech, Microsoft, $MSFT, and Nvidia, $NVDA, added a combined +$1.42 trillion in market cap over this period.
By contrast, the other 71 stocks in the sector lost a combined -$22.3 billion.
Health Care added +$345.2 billion in value, followed by Financials at +$192.7 billion and Energy at +$174.7 billion.
On the other hand, Communication Services lost -$299.6 billion, followed by Utilities at -$88.5 billion and Industrials at -$67.3 billion.
Big Tech has never been bigger.
Canada owns the railways. Canada owns the electricity. Canada owns the minerals. Canada owns the lumber. Canada owns the water. Canada owns the potash. And Canada owns the oil. Vive le Canada 🇨🇦
The S&P 500 has returned an average of 12% per year since 1980 and has done so despite an average intra-year drawdown of 14%, and often drawdowns that are much worse.
The lesson? Volatility doesn’t equal a permanent loss unless you sell.
The most bullish chart?
@_JoshSchafer (via Keith Lerner) shows that future earnings expectations for '26 and '27 have soared this year.
This simply doesn't happen often, as most years see things trending lower.
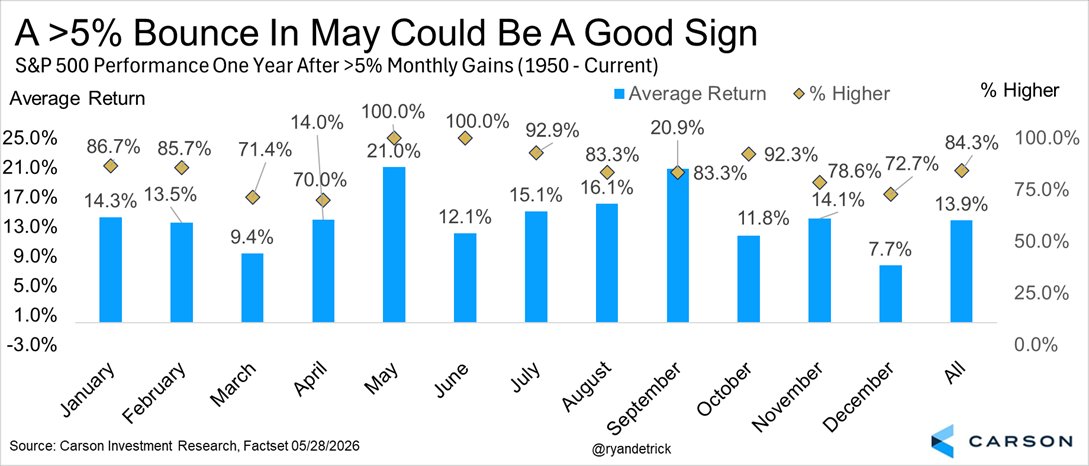
Good time to remember that when the S&P 500 gains >5% in May (like 2026) the next 12 months have never been lower and gains 21% on average.
Yes, June/July was a sideways chop, but things are now moving higher as expected.
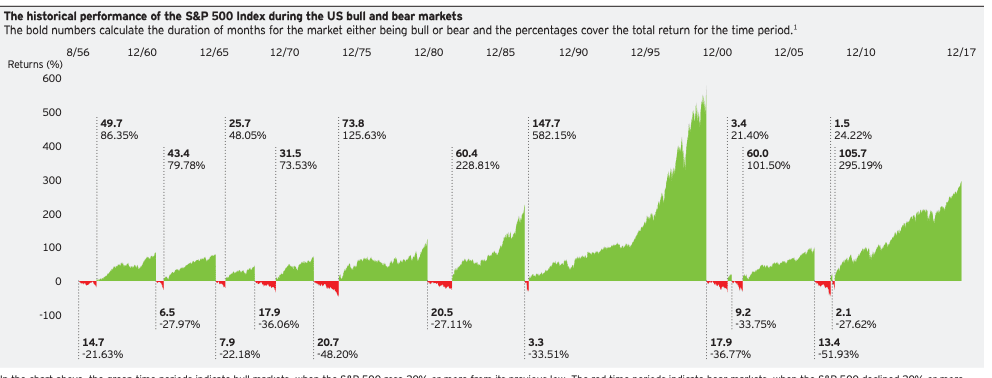
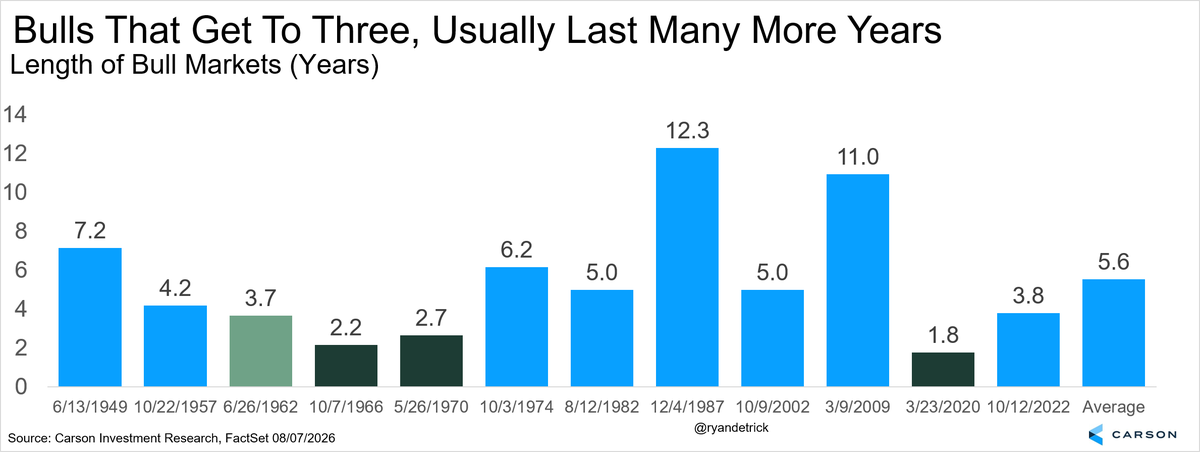
The current bull market is 3.8 years old.
As we've noted many times, once a bull gets to three years old, they usually last many, many more years. This one isn't looking any different than history.
Overvalued, Bubble, or Revolution?
"Every new technology comes with massive overinvestment and an over-allocation of capital toward that technology. This turns out not to be a bad thing (unless it’s your capital)."
https://t.co/7QdDo1FR6q
by @Ritholtz
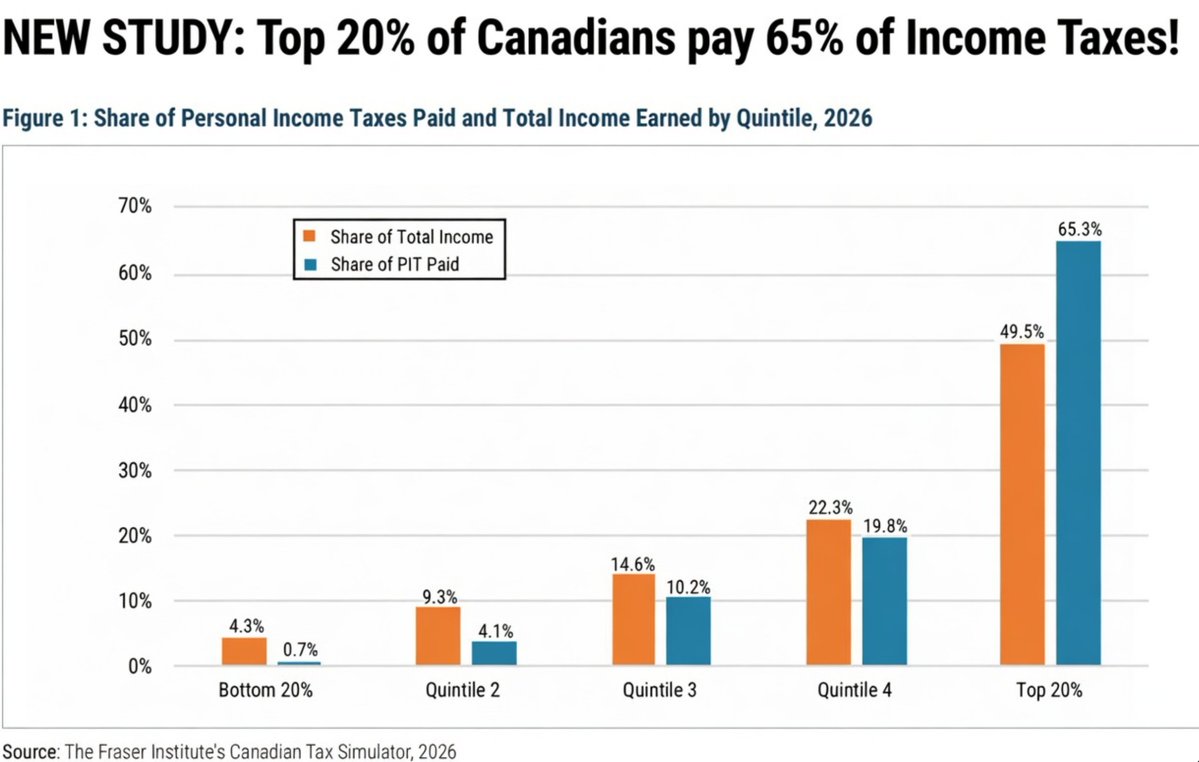
NEW STUDY: Top 20% of Canadians NOW pay 65% of all Personal Income Taxes
and the bottom 20% pay just 0.7% of taxes!!
Together, the top 40% of income earners pay 85% of ALL income taxes......insane levels of wealth redistribution!
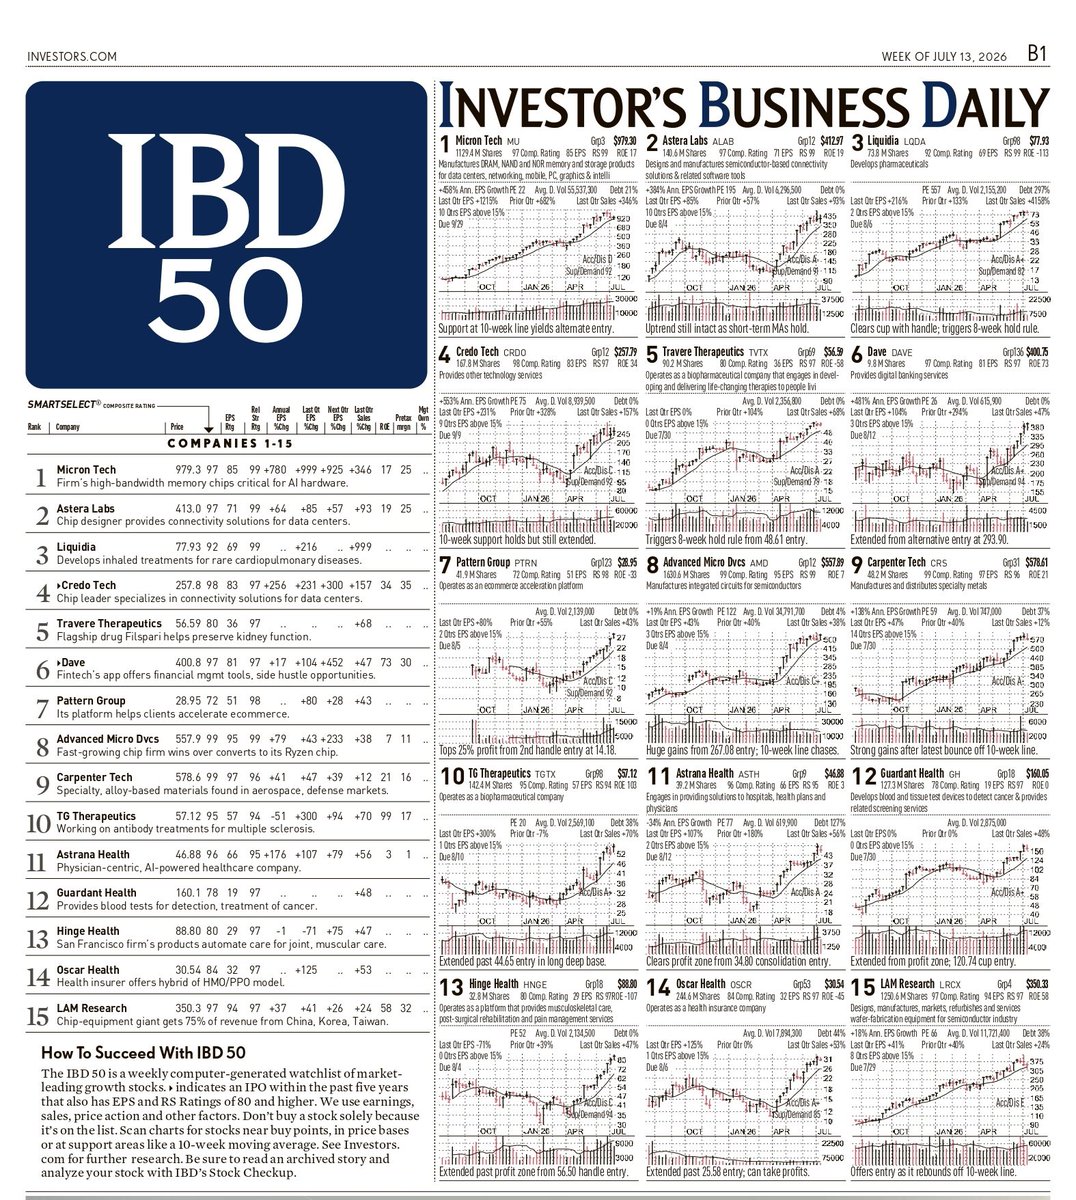
IBD 50 Update | July 13
The latest IBD 50 list is out, highlighting some of the strongest growth stocks showing exceptional earnings, sales growth, relative strength, and institutional accumulation.
Markets reward strength—not hope. Keep your watchlist focused on stocks making new highs with powerful fundamentals, and let price and volume confirm the trend.
The best opportunities often come from leaders, not laggards.
🇺🇸 S&P 500
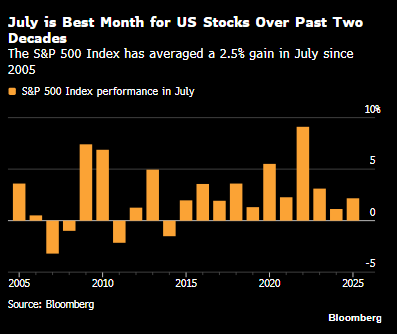
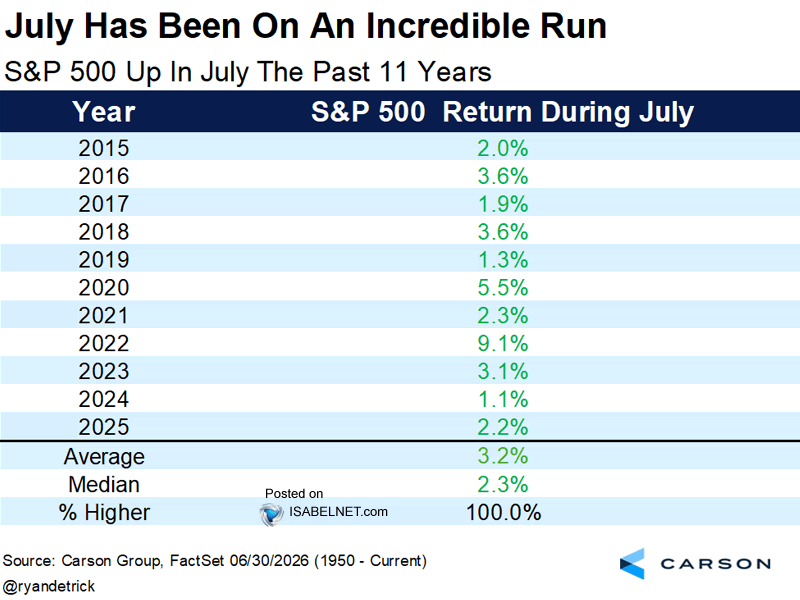
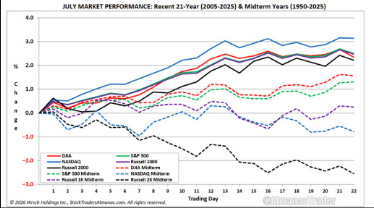
July has been kind to US stocks, rising for 11 straight years and delivering an average gain of 3.2%. Can the streak continue?
👉 https://t.co/yIk7SZYp6p
h/t @RyanDetrick $spx #spx
TOM LEE: 7,800 FIRST, THEN A 10 TO 15% PULLBACK WORTH BUYING
He still thinks the market is in an up phase before a correction comes later for understandable reasons:
- Near term, he sees 7,700 to 7,800 first
- Then a 10 to 15% pullback driven by the Fed, a major IPO unlock, and petroleum shortages
- But earnings are strong, investors are offsides, and he thinks fund managers buy the dip
Why to Buy in July: S&P Hasn’t Fallen in This Month Since 2014 (Bloomberg)
July has been the best month for the S&P 500 Index in the past two decades, with the index averaging a 2.5% gain in July since 2005.
The S&P 500 hasn’t had a losing July since 2014, but this year's track record is meeting worries that market-moving events will whip up volatility in the second half of the month.
Despite favorable seasonal patterns, fundamental risks such as the fallout from the Iran war and the specter of rising interest rates are confronting the case for owning stocks, with some strategists recommending hedging against potential losses.
This @VisualCap graphic ranks America’s biggest industries by economic output, showing how each contributed to GDP in 2025; data comes from @BEA_News; finance, real estate, insurance, rental, and leasing led all industries at $6.8 trillion in output, accounting for > 1/5 of entire U.S. economy