“Palestine was stolen by Jews in 1948”
Then they show you:
• Jewish banks & stores in the 1940s
• Hebrew University of Jerusalem, 1925
• Tel Aviv being founded, 1908
• Jewish farmers in Zikhron Yaakov, 1890
• Jewish settlers in the 1880s
• Jews of Jerusalem, 1834
And British Mandate stamps that literally say “Land of Israel” in Hebrew.
How exactly do you “steal” something you’ve lived in, built, and owned for centuries?
History isn’t a slogan.
Hey @grok is it true that reportedly 90% of the "settler violence" incidents in the UN OCHA datasets are actually not settler-initiated violent attacks on Palestinians at all?
[THREAD]
1/ Massive new study involving over 1 million individuals: "We find that the genetic architecture of personality is robustly generalizable, minimally confounded and widely relevant to human experience."
1,260 genetic variants are identified.
https://t.co/2VNFbiwhM1
This is not just wrong, this is civilization-ending level wrong.
For most of human history, life was pretty miserable for nearly everyone in every part of the world. It was this unique Western culture that gave rise to the modern, prosperous and relatively safe world, and the high living standards people in the West enjoy today. For that reason, it would be wise to preserve the key factors that made this possible, rather than dismantling them for no good reason.
Some of the most important distinct Western values that made the modern world possible include individualism, impersonal trust, meritocracy, moral universalism, Enlightenment rationalism, and nuclear family structures (as opposed to extended kinship clans).
It’s no accident that it was precisely the civilization shaped by these values that gave rise to classical liberalism, capitalist market economies, the Industrial Revolution, the Scientific Revolution, secure private property rights, rule-of-law institutions, and the other key building blocks of modern prosperity.
These values didn’t just drop out of the sky. They arose from a combination of very old societal norms (the most important one being marriage patterns, i.e. monogamy and avoidance of cousin marriage) and genetic factors (as most psychological traits are to a significant extent heritable, and for centuries European societies systematically removed the most violent individuals from the gene pool).
The problems people in other cultures are running away from come mostly from the people who live in those places and the ways they do things. The more people from those backgrounds come into Western countries, the more our societies will start looking like the dysfunctional ones they left behind.
In 1500, humanity began the largest natural experiment in history.
Ships crossed oceans. Empires expanded. Entire continents were repopulated.
Europeans settled the Americas, Australia, and New Zealand—bringing with them not just flags and borders, but skills, norms, technologies, and ways of organizing society.
For centuries, we’ve argued about why some countries became rich while others remained poor.
Was it fertile land? Climate? Natural resources? Or something deeper?
This mass migration gives us a rare way to test the question.
If place mattered most, then the New World should still be poor—its soil, climate, and geography didn’t change.
If people mattered most, then prosperity should follow populations wherever they go.
The data are unambiguous.
How rich a country is today depends far more on how technologically advanced its genetic ancestors were in 1500 (r = 0.7) than on how technologically advanced the place itself was (r = 0.4).
That’s why the United States, Canada, Australia, and New Zealand—among the least technologically advanced places in 1500—are now among the richest on Earth. Their geography didn’t improve; their human capital did.
The people make the country, choose your people wisely.
This is the smoking gun of junk science.
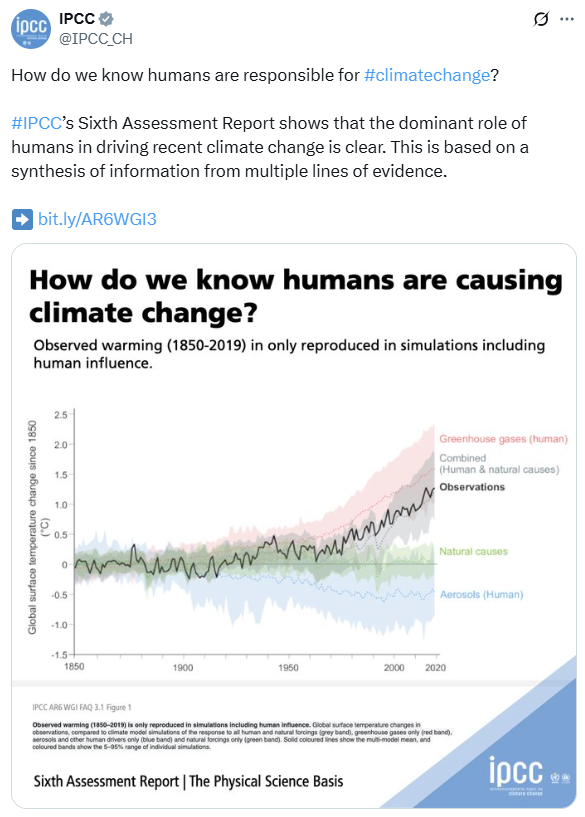
So-called “climate scientists” ostentatiously show the chart on the left as incontrovertible proof that virtually all global warming since 1850 is caused by mankind's greenhouse gas (GHG) emissions, a natural byproduct of combustion. 🏭
The figure is adapted from the Summary for Policymakers (SPM) of the latest United Nations IPCC AR6 WG1 report. 🇺🇳 They avow that it is “[𝑏]𝑎𝑠𝑒𝑑 𝑜𝑛 𝑎 𝑠𝑦𝑛𝑡ℎ𝑒𝑠𝑖𝑠 𝑜𝑓 𝑖𝑛𝑓𝑜𝑟𝑚𝑎𝑡𝑖𝑜𝑛 𝑓𝑟𝑜𝑚 𝑚𝑢𝑙𝑡𝑖𝑝𝑙𝑒 𝑙𝑖𝑛𝑒𝑠 𝑜𝑓 𝑒𝑣𝑖𝑑𝑒𝑛𝑐𝑒.”
🔗https://t.co/ew9IvQsyym (p. 6)
Let's break it down for the laypeople:
⬛️ The black curve shows the observed (really estimated) global mean surface temperature (referred to as GMST hereafter) anomaly [in degrees Celsius] since 1850. Over the last 175 years, the planet has warmed by ~1.2°C according to Hadley Centre data, but there is a 30% range on that number due to the divergence between datasets.
🟩 The green line shows the global climate model- (GCM-) simulated GMST change since 1850 that is ascribed to 𝗻𝗮𝘁𝘂𝗿𝗮𝗹 𝗰𝗮𝘂𝘀𝗲𝘀 𝗼𝗻𝗹𝘆. The only natural forcings considered in most GCMs are the total solar irradiance ☀️ (TSI)—a measure of the solar power over all wavelengths per unit area incident on the top of the atmosphere—and volcanic aerosols. 🌋
The chart also considers internal variability, which essentially are cyclical ocean-driven changes in heat distribution on decadal or multidecadal time scales. However, these mechanisms remain poorly understood because they are understudied within the academic literature.
🟦 The blue line shows the GCM-simulated GMST change due to aerosols only. Aerosols are fine solid or liquid particles—natural or anthropogenic in origin—that are suspended in the air and generally will have diameters <1 μm. Aerosols can act to either warm or cool the atmosphere.
For instance, 𝗯𝗿𝗶𝗴𝗵𝘁 𝗮𝗲𝗿𝗼𝘀𝗼𝗹𝘀 (e.g., sulfates from coal burning) act to scatter incoming solar radiation out to space, which has a net 𝗰𝗼𝗼𝗹𝗶𝗻𝗴 𝗲𝗳𝗳𝗲𝗰𝘁. On the flip side of that are 𝗱𝗮𝗿𝗸 𝗮𝗲𝗿𝗼𝘀𝗼𝗹𝘀 (e.g., black carbon from diesel exhaust) that absorb incoming solar radiation, which has a net 𝘄𝗮𝗿𝗺𝗶𝗻𝗴 𝗲𝗳𝗳𝗲𝗰𝘁.
🟥 The red curve shows the GCM-simulated GMST change due to GHG emissions only.
⬜️ The gray curve shows the GCM-simulated GMST change due to natural and anthropogenic causes. It is the combined sum of the green, blue and red curves.
As we can see, the IPCC's figure implies that GCMs have done remarkably well to explain why the Earth's GMST has risen by ~1.2°C since 1850. This plot also implies that virtually all of the warming over that time has been due to GHG emissions. 📈
Essentially, the IPCC argues that in the absence of GHG forcing, the GMST would have remained quasi-steady or even have slightly decreased since 1945. IPCC AR6 states that warming is not reproduced by the models unless extra GHGs are added, therefore the science is settled.
𝗕𝘂𝘁, 𝗵𝗲𝗿𝗲'𝘀 𝘄𝗵𝗮𝘁 𝘁𝗵𝗲 𝗜𝗣𝗖𝗖 𝗮𝗻𝗱 𝗮𝗰𝘁𝗶𝘃𝗶𝘀𝘁𝘀 𝗰𝗼𝘀𝗽𝗹𝗮𝘆𝗶𝗻𝗴 𝗮𝘀 𝘀𝗰𝗶𝗲𝗻𝘁𝗶𝘀𝘁𝘀 𝗶𝗻 𝗮𝗰𝗮𝗱𝗲𝗺𝗶𝗮 𝘄𝗼𝗻'𝘁 𝘁𝗲𝗹𝗹 𝘆𝗼𝘂. 🫵
Their “settled science” crumbles with just a tiny bit of scrutiny of their methodology.
1⃣ 𝗖𝗟𝗜𝗠𝗔𝗧𝗘 𝗠𝗢𝗗𝗘𝗟𝗦 𝗖𝗔𝗡'𝗧 𝗛𝗜𝗡𝗗𝗖𝗔𝗦𝗧
We know from paleoclimate data (e.g., tree rings, ice cores and sedimentary rock) that the Earth's GMST is capable of fluctuating significantly on multidecadal time scales without human influence. Just take a look at some of the reconstructions compiled here:
🔗https://t.co/5PpWXs2EkM
However, GCMs are incapable of skillfully hindcasting observed climate variations over the past 2,000 years or even last few centuries. I have run different models myself, and they struggle to capture the natural ups 'n downs seen in observations. They essentially smooth everything out into a flat line and variance is lost. This is something even my professors discussed in classes when the modeling subject came up.
Rather than acknowledging the shortcomings of the models, most “climate scientists” or modelers cling to their high egos and make a general assumption that natural forcing and internal variability cannot possibly explain any observed global warming since 1850 just because their models cannot reproduce it on natural variability alone. But, that's because the models also cannot reproduce the natural fluctuations observed in the paleoclimate record.
2⃣ 𝗖𝗟𝗜𝗠𝗔𝗧𝗘 𝗠𝗢𝗗𝗘𝗟𝗦 𝗔𝗥𝗘 𝗙𝗨𝗗𝗚𝗘𝗗
Since GCMs cannot hindcast historical temperature variations, modeling centers pre-tune their GCMs to the instrumental GMST record, using the dataset of their choice (e.g., HadCRUT5, Berkley Earth, NASA GISS, etc.). Pre-tuning is basically when modelers arbitrarily turn knobs on parameters in their models until they agree with the observations.
Figure 3.8 from Chapter 3 of IPCC AR6 WG1 shown on the top right shows the “drivers of observed warming” between 1850-1900 and 2010-19. 📊
🔗https://t.co/6RS5rVXm2r (p. 440)
To curve fit the model data to the GMST record, they set a GMST change “target” range of +0.9°C to +1.2°C with a “best estimate” of +1.0°C [relative to the 1850-1900 mean]. This range accounts for spread between observational datasets.
Let's break it down:
🟩 The green boxes show the spread in the modeled GMST change since 1850 ascribed to both natural forcing and internal variability. The multi-model mean (MMM) is centered around zero with little variation between individual models. This, once again, is due to the fact that GCMs cannot reproduce historical climate variations accurately.
Since first order radiative forcings including land use change and urban sprawl are left unconsidered by the IPCC and most other scientists, this leaves them with two major parameter schemes to adjust: The aerosol (e.g., SO₂ and black carbon) and GHG (e.g., CO₂, CH₄ and N₂O) forcing schemes.
But, there is one major problem! ⚠️
The individual aerosol and GHG contributions to the change in GMST since 1850 are unknown.
This is because the coefficients used to quantify the anthropogenic versus natural forcing on the climate system are computed from computer modeling, not by direct in-situ measurements or remote sensing. So, it becomes a game of fudging the data until the GCMs give scientists the result that their funding agents are implicitly requiring them to find.
According to Figure 3.8 from IPCC AR6 WG1,
🟦 Aerosols may have had a net cooling effect by as much as 0.9°C between 1850 and 2019 (mainly due to SO₂ outweighing the impact of black carbon), or a net warming of 0.1°C (due to absorbed solar radiation by black carbon) over that same time interval.
The MMM is a net -0.5°C ± 100%. In other words, the estimated aerosol contribution to the GMST change since 1850 has a 100% margin of error. In other words, the “climate experts” have absolutely no clue just how much aerosols have impacted the radiation balance of the atmosphere, and therefore observed temperature trends over the last 100+ years.
🟫 The models say that extra GHGs may have had a net warming effect on the atmosphere by as little as 1.1°C, or as much as 2.2°C over the period 1850-2019. The MMM is +1.5°C ± 44%, which means that there is a 44% margin of error on the relative contribution of GHGs on GMST change. So, scientists still don't have a clue exactly how sensitive the climate system is to changes in CO₂ flux.
That doesn't sound like “settled science” to me.
To see what's going on here, take a look at one model in Figure 3.8. For sake of ease, let's choose the Hadley Centre model (HadGEM3-GC31-LL). In the diagram, it is denoted by the symbol ✚.
The Hadley Centre's model says that natural forcing and internal variability had little to no impact on the GMST change between 1850-1900 and 2019. So, it's relative contribution is ∆0°C.
The model also says that aerosols cooled the planet by 0.9°C over that same period. 📉
But, that's too cold! The planet hasn't cooled; it has warmed by more than 1°C since 1850.
So, to get their model to produce what the modelers wanted, the Hadley Centre countered the aerosol forcing with a robust GHG forcing of +2.2°C. When the two are added together, it meshes out to a net 1.1°C of warming, which fits within the target range.
Success is declared! ✅
But, here's the glaring reality.
The “basic physics” don't yield correct values. So, the modelers adjust the aerosol or GHG parameter schemes in their models until they get a desired result. Other times, they adjust the cloud parameter scheme. But, it's almost always done arbitrarily with little to no physical reasoning.
Don't believe me? 🤔
These dubious methods are admitted by scientists in the peer-reviewed literature.
A prime example of this artificial tuning being done is in Mauritsen & Roeckner (2020). In the paper, the authors detailed how they pre-tuned the Max Planck Institute model (MPI-ESM1.2) to the instrumental surface air temperature (SAT) record by targeting the IPCC's “best estimate” of equilibrium climate sensitivity (ECS) (i.e., the amount of warming resulting from doubling CO₂ plus feedbacks) of 3°C.
With the known physics, the MPI model produced an ECS of 7°C, which is more than double their set target of 3°C. So, to produce a more realistic ECS, they just arbitrarily adjusted the cloud parameter scheme until the model output aligned with GMST observations.
In the closing remarks of the paper, they say,
🗨️ “𝑊𝑒 ℎ𝑎𝑣𝑒 𝑑𝑜𝑐𝑢𝑚𝑒𝑛𝑡𝑒𝑑 ℎ𝑜𝑤 𝒘𝒆 𝒕𝒖𝒏𝒆𝒅 𝒕𝒉𝒆 𝑴𝑷𝑰-𝑬𝑺𝑴𝟏.𝟐 𝒈𝒍𝒐𝒃𝒂𝒍 𝒄𝒍𝒊𝒎𝒂𝒕𝒆 𝒎𝒐𝒅𝒆𝒍 𝒕𝒐 𝒎𝒂𝒕𝒄𝒉 𝒕𝒉𝒆 𝒊𝒏𝒔𝒕𝒓𝒖𝒎𝒆𝒏𝒕𝒂𝒍 𝒓𝒆𝒄𝒐𝒓𝒅 𝑤𝑎𝑟𝑚𝑖𝑛𝑔; 𝑎𝑛 𝑒𝑛𝑑𝑒𝑎𝑣𝑜𝑟 𝒘𝒉𝒊𝒄𝒉 𝒉𝒂𝒔 𝒄𝒍𝒆𝒂𝒓𝒍𝒚 𝒃𝒆𝒆𝒏 𝒔𝒖𝒄𝒄𝒆𝒔𝒔𝒇𝒖𝒍. 𝐷𝑢𝑒 𝑡𝑜 𝑡ℎ𝑒 ℎ𝑖𝑠𝑡𝑜𝑟𝑖𝑐𝑎𝑙 𝑜𝑟𝑑𝑒𝑟 𝑜𝑓 𝑒𝑣𝑒𝑛𝑡𝑠, 𝒕𝒉𝒆 𝒄𝒉𝒐𝒊𝒄𝒆 𝒘𝒂𝒔 𝒕𝒐 𝒅𝒐 𝒕𝒉𝒊𝒔 𝒑𝒓𝒂𝒄𝒕𝒊𝒄𝒂𝒍𝒍𝒚 𝒃𝒚 𝒕𝒂𝒓𝒈𝒆𝒕𝒊𝒏𝒈 𝒂𝒏 𝑬𝑪𝑺 𝒐𝒇 𝒂𝒃𝒐𝒖𝒕 𝟑𝑲 𝒖𝒔𝒊𝒏𝒈 𝒄𝒍𝒐𝒖𝒅 𝒇𝒆𝒆𝒅𝒃𝒂𝒄𝒌𝒔, 𝑎𝑠 𝑜𝑝𝑝𝑜𝑠𝑒𝑑 𝑡𝑜 𝑡𝑢𝑛𝑖𝑛𝑔 𝑡ℎ𝑒 𝑎𝑒𝑟𝑜𝑠𝑜𝑙 𝑓𝑜𝑟𝑐𝑖𝑛𝑔.”
🔗https://t.co/uBatWfd0Gi
🔗https://t.co/8Ntgszr1dC (p. 44, for IPCC ECS “best estimate”)
In a nutshell, after “scientists” force their models to agree with the instrumental surface temperature data [by fudging parameters arbitrarily], they declare that their models are successful / correct because they are in agreement with the surface temperature data.
Circular logic much? 🔁
What's more, for over three decades, the scientists employed at these modeling centers refused to inform the public exactly how their GCMs are calibrated. The lack of transparency from the scientific community on model tuning was first subtly acknowledged in Chapter 9 of IPCC AR5 WG1,
🗨️ “𝑊𝑖𝑡ℎ 𝑣𝑒𝑟𝑦 𝑓𝑒𝑤 𝑒𝑥𝑐𝑒𝑝𝑡𝑖𝑜𝑛𝑠 (𝑀𝑎𝑢𝑟𝑖𝑡𝑠𝑒𝑛 𝑒𝑡 𝑎𝑙., 2012; 𝐻𝑜𝑢𝑟𝑑𝑖𝑛 𝑒𝑡 𝑎𝑙., 2013) 𝒎𝒐𝒅𝒆𝒍𝒍𝒊𝒏𝒈 𝒄𝒆𝒏𝒕𝒓𝒆𝒔 𝒅𝒐 𝒏𝒐𝒕 𝒓𝒐𝒖𝒕𝒊𝒏𝒆𝒍𝒚 𝒅𝒆𝒔𝒄𝒓𝒊𝒃𝒆 𝒊𝒏 𝒅𝒆𝒕𝒂𝒊𝒍 𝒉𝒐𝒘 𝒕𝒉𝒆𝒚 𝒕𝒖𝒏𝒆 𝒕𝒉𝒆𝒊𝒓 𝒎𝒐𝒅𝒆𝒍𝒔. 𝑇ℎ𝑒𝑟𝑒𝑓𝑜𝑟𝑒, 𝑡ℎ𝑒 𝑐𝑜𝑚𝑝𝑙𝑒𝑡𝑒 𝑙𝑖𝑠𝑡 𝑜𝑓 𝑜𝑏𝑠𝑒𝑟𝑣𝑎𝑡𝑖𝑜𝑛𝑎𝑙 𝑐𝑜𝑛𝑠𝑡𝑟𝑎𝑖𝑛𝑡𝑠 𝑡𝑜𝑤𝑎𝑟𝑑 𝑤ℎ𝑖𝑐ℎ 𝑎 𝑝𝑎𝑟𝑡𝑖𝑐𝑢𝑙𝑎𝑟 𝑚𝑜𝑑𝑒𝑙 𝑖𝑠 𝑡𝑢𝑛𝑒𝑑 𝑖𝑠 𝑔𝑒𝑛𝑒𝑟𝑎𝑙𝑙𝑦 𝑛𝑜𝑡 𝑎𝑣𝑎𝑖𝑙𝑎𝑏𝑙𝑒.”
🔗https://t.co/z2jHU1HDv5 (pp. 749-50)
This then became the focus of an editorial in Science Magazine in October 2016,
🗨️ “𝐼𝑛𝑑𝑒𝑒𝑑, 𝑤ℎ𝑒𝑡ℎ𝑒𝑟 𝑐𝑙𝑖𝑚𝑎𝑡𝑒 𝑠𝑐𝑖𝑒𝑛𝑡𝑖𝑠𝑡𝑠 𝑙𝑖𝑘𝑒 𝑡𝑜 𝑎𝑑𝑚𝑖𝑡 𝑖𝑡 𝑜𝑟 𝑛𝑜𝑡, 𝒏𝒆𝒂𝒓𝒍𝒚 𝒆𝒗𝒆𝒓𝒚 𝒎𝒐𝒅𝒆𝒍 𝒉𝒂𝒔 𝒃𝒆𝒆𝒏 𝒄𝒂𝒍𝒊𝒃𝒓𝒂𝒕𝒆𝒅 𝒑𝒓𝒆𝒄𝒊𝒔𝒆𝒍𝒚 𝒕𝒐 𝒕𝒉𝒆 𝟐𝟎𝒕𝒉 𝒄𝒆𝒏𝒕𝒖𝒓𝒚 𝒄𝒍𝒊𝒎𝒂𝒕𝒆 𝒓𝒆𝒄𝒐𝒓𝒅𝒔—𝒐𝒕𝒉𝒆𝒓𝒘𝒊𝒔𝒆 𝒊𝒕 𝒘𝒐𝒖𝒍𝒅 𝒉𝒂𝒗𝒆 𝒆𝒏𝒅𝒆𝒅 𝒖𝒑 𝒊𝒏 𝒕𝒉𝒆 𝒕𝒓𝒂𝒔𝒉. “𝐼𝑡'𝑠 𝑓𝑎𝑖𝑟 𝑡𝑜 𝑠𝑎𝑦 𝑎𝑙𝑙 𝑚𝑜𝑑𝑒𝑙𝑠 ℎ𝑎𝑣𝑒 𝑡𝑢𝑛𝑒𝑑 𝑖𝑡,” 𝑠𝑎𝑦𝑠 𝐼𝑠𝑎𝑎𝑐 𝐻𝑒𝑙𝑑, 𝑎 𝑠𝑐𝑖𝑒𝑛𝑡𝑖𝑠𝑡 𝑎𝑡 𝑡ℎ𝑒 𝐺𝑒𝑜𝑝ℎ𝑦𝑠𝑖𝑐𝑎𝑙 𝐹𝑙𝑢𝑖𝑑 𝐷𝑦𝑛𝑎𝑚𝑖𝑐𝑠 𝐿𝑎𝑏𝑜𝑟𝑎𝑡𝑜𝑟𝑦, 𝑎𝑛𝑜𝑡ℎ𝑒𝑟 𝑝𝑟𝑜𝑚𝑖𝑛𝑒𝑛𝑡 𝑚𝑜𝑑𝑒𝑙𝑖𝑛𝑔 𝑐𝑒𝑛𝑡𝑒𝑟, 𝑖𝑛 𝑃𝑟𝑖𝑛𝑐𝑒𝑡𝑜𝑛, 𝑁𝑒𝑤 𝐽𝑒𝑟𝑠𝑒𝑦.”
The Science Magazine article continues, stating that climate scientists had been reluctant to come clean about tuning practices for years because they feared that skeptics would use their shady practices against them to downplay the impacts of global warming,
🗨️ “𝑭𝒐𝒓 𝒚𝒆𝒂𝒓𝒔, 𝒄𝒍𝒊𝒎𝒂𝒕𝒆 𝒔𝒄𝒊𝒆𝒏𝒕𝒊𝒔𝒕𝒔 𝒉𝒂𝒅 𝒃𝒆𝒆𝒏 𝒎𝒖𝒎 𝒊𝒏 𝒑𝒖𝒃𝒍𝒊𝒄 𝒂𝒃𝒐𝒖𝒕 𝒕𝒉𝒆𝒊𝒓 “𝒔𝒆𝒄𝒓𝒆𝒕 𝒔𝒂𝒖𝒄𝒆”: 𝑊ℎ𝑎𝑡 ℎ𝑎𝑝𝑝𝑒𝑛𝑒𝑑 𝑖𝑛 𝑡ℎ𝑒 𝑚𝑜𝑑𝑒𝑙𝑠 𝑠𝑡𝑎𝑦𝑒𝑑 𝑖𝑛 𝑡ℎ𝑒 𝑚𝑜𝑑𝑒𝑙𝑠. 𝑻𝒉𝒆 𝒕𝒂𝒃𝒐𝒐 𝒓𝒆𝒇𝒍𝒆𝒄𝒕𝒆𝒅 𝒇𝒆𝒂𝒓𝒔 𝒕𝒉𝒂𝒕 𝒄𝒍𝒊𝒎𝒂𝒕𝒆 𝒄𝒐𝒏𝒕𝒓𝒂𝒓𝒊𝒂𝒏𝒔 𝒘𝒐𝒖𝒍𝒅 𝒖𝒔𝒆 𝒕𝒉𝒆 𝒑𝒓𝒂𝒄𝒕𝒊𝒄𝒆 𝒐𝒇 𝒕𝒖𝒏𝒊𝒏𝒈 𝒕𝒐 𝒔𝒆𝒆𝒅 𝒅𝒐𝒖𝒃𝒕 𝒂𝒃𝒐𝒖𝒕 𝒎𝒐𝒅𝒆𝒍𝒔—𝒂𝒏𝒅, 𝒃𝒚 𝒆𝒙𝒕𝒆𝒏𝒔𝒊𝒐𝒏, 𝒕𝒉𝒆 𝒓𝒆𝒂𝒍𝒊𝒕𝒚 𝒐𝒇 𝒉𝒖𝒎𝒂𝒏-𝒅𝒓𝒊𝒗𝒆𝒏 𝒘𝒂𝒓𝒎𝒊𝒏𝒈. “𝑇ℎ𝑒 𝑐𝑜𝑚𝑚𝑢𝑛𝑖𝑡𝑦 𝑏𝑒𝑐𝑎𝑚𝑒 𝑑𝑒𝑓𝑒𝑛𝑠𝑖𝑣𝑒,” [Bjorn] 𝑆𝑡𝑒𝑣𝑒𝑛𝑠 𝑠𝑎𝑦𝑠 [a director of the Max Planck Institute for Mathematics, MPIM]. “𝐼𝑡 𝑤𝑎𝑠 𝑎𝑓𝑟𝑎𝑖𝑑 𝑜𝑓 𝑡𝑎𝑙𝑘𝑖𝑛𝑔 𝑎𝑏𝑜𝑢𝑡 𝑡ℎ𝑖𝑛𝑔𝑠 𝑡ℎ𝑎𝑡 𝑡ℎ𝑒𝑦 𝑡ℎ𝑜𝑢𝑔ℎ𝑡 𝑐𝑜𝑢𝑙𝑑 𝑏𝑒 𝑢𝑛𝑓𝑎𝑖𝑟𝑙𝑦 𝑢𝑠𝑒𝑑 𝑎𝑔𝑎𝑖𝑛𝑠𝑡 𝑡ℎ𝑒𝑚.”
🔗https://t.co/PImzcNbn0W
Except, the contrarians using experts' shady model tuning practices against them isn't unfair. Why? Well, because:
➊ What they are doing is 𝒏𝒐𝒕 physics. ⚖️
➋ What they are doing is 𝒏𝒐𝒕 science. 🧪
What they are doing is the antithesis of science, as it is starting with a predetermined conclusion and working backwards to find or fudge data to support said conclusion.
3⃣ 𝗠𝗢𝗗𝗘𝗟𝗦 𝗣𝗥𝗘𝗗𝗜𝗖𝗧 𝗧𝗢𝗢 𝗠𝗨𝗖𝗛 𝗪𝗔𝗥𝗠𝗜𝗡𝗚
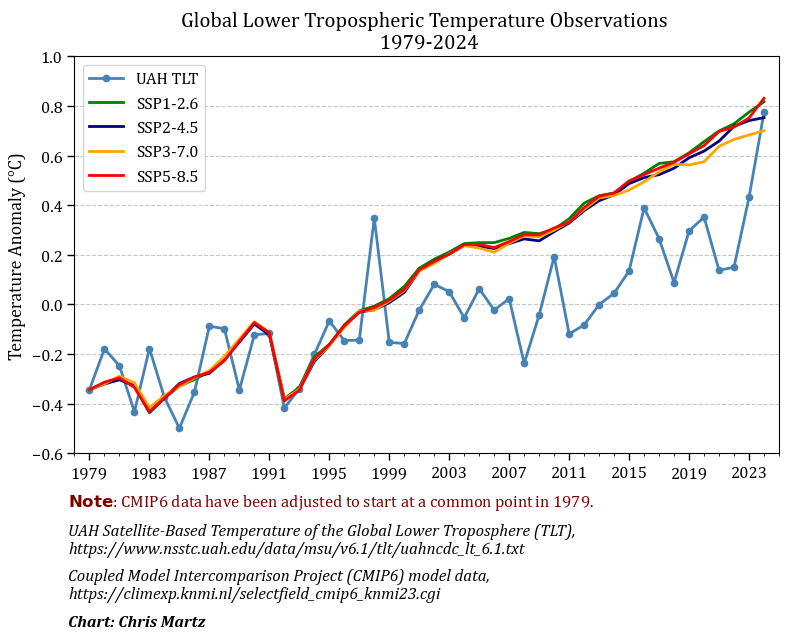
The true test of a climate model is to see how well it fares against observational data that the model has not been arbitrarily tuned to. One such dataset is the NASA satellite-based temperature of the global lower troposphere (TLT) that is processed by University of Alabama Huntsville (UAH) scientists Dr. John Christy and Dr. Roy Spencer.
On the bottom left, I plotted the latest CMIP6 model projections for global mean temperature alongside the UAH satellite-based TLT. Anomalies in both datasets are against 1991-2020 averages for fair comparison. I started the CMIP6 model runs in 1979 (because that's as far back as the UAH data extends) and adjusted the CMIP6 data so that it starts at the measured annual TLT anomaly from 1979 for model initialization.
And, as we can see, the CMIP6 models produce way too much warming over the last 45 years. 🌡️
In fact, the models were off by a factor of two and it only recently took a major El Niño event, the Hunga-Tonga eruption and a reduction in cloud cover to get a statistical outlier placed within the model spread.
4⃣ 𝗧𝗛𝗘𝗥𝗘 𝗜𝗦 𝗔𝗡 𝗔𝗡𝗧𝗛𝗥𝗢𝗣𝗢𝗚𝗘𝗡𝗜𝗖 𝗘𝗟𝗘𝗠𝗘𝗡𝗧 𝗧𝗢 𝗚𝗟𝗢𝗕𝗔𝗟 𝗪𝗔𝗥𝗠𝗜𝗡𝗚; 𝗜𝗧'𝗦 𝗔 𝗤𝗨𝗘𝗦𝗧𝗜𝗢𝗡 𝗢𝗙 𝗛𝗢𝗪 𝗠𝗨𝗖𝗛
Now, I'm 𝒏𝒐𝒕 saying that there is no anthropogenic component to global warming. I think there certainly is, but it is a question of exactly how much. And, despite what you're routinely told by the press and even scientists themselves, no one really has a clue.
The annual average radiation flux in and out of the Earth's atmosphere is 239 ± 4 W/m² of absorbed solar radiation (ASR) per year (Trenberth et al., 2009).
🔗https://t.co/mlZbsIdAVi
Global warming theory states that the direct radiation imbalance that results from doubling the atmospheric CO₂ concentration is 3.7 ± 0.4 W/m². That is, 3.7 W/m² of outgoing infrared radiation (IR) gets intercepted by CO₂ molecules. This enhances the natural greenhouse effect by ~1.5%, which produces a direct 1°C warming bump (not accounting for amplifying OR dampening feedbacks). Wijngaarden & Happer (2023) produced slightly smaller numbers, but the results are the same in principle.
🔗https://t.co/CoxbsWVmUh
Since the margin of error on the natural energy flows in and out of the Earth’s climate system is more than double that of the direct radiative forcing from RF 2× CO₂, that means that the warming since 1850 could be partly or mostly natural and scientists could never know for sure.
Scientists ought to be better about conveying all this uncertainty to the public, but their career success in academia or government research positions requires them to adhere to the storyline that global warming is dangerous. If doubt is cast on its severity, then their funding could dry up because Congress would deem it unworthy of having a large science budget.
Science has become corrupted by political agendas and money.
This study finds that over the past 10,000 years, polygenic scores for household income increased by 1.1 standard deviations, intelligence by 0.79 S.D, and years of schooling by 0.61 S.D.
"The deterioration of a government begins almost always by the decay of its principles."
- Baron de Montesquieu, The Spirit of the Law (1748).
"France is cooked."
- The spirit of Baron de Montesquieu (2026).
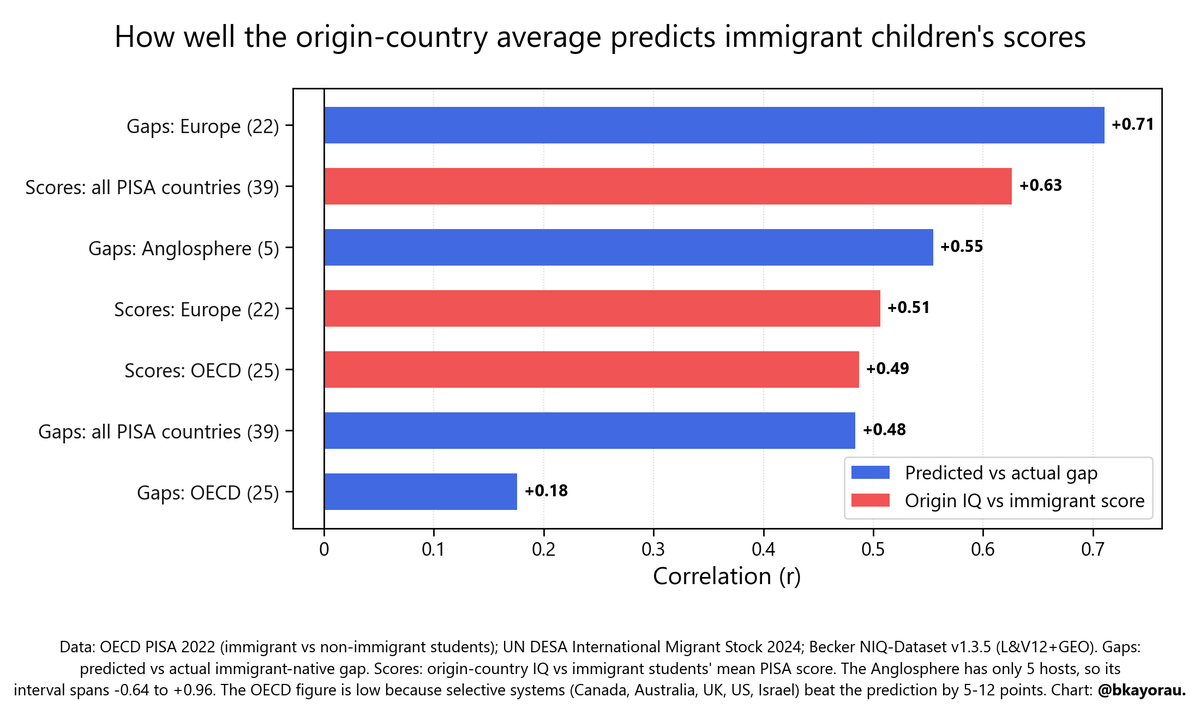
@iskanderlee Yes, absolutely. I noticed that selection is much more prevalent in the Anglosphere, less so in Western Europe. This was meant to be a model for illustrative purposes. The average IQ model does happen to correlate quite well when measured against immigrants' PISA scores.
If every immigrant scored their birth country's average national IQ, how much lower would each OECD country's average be?
Most rich countries come out 1–2.5 points lower: Canada −2.5, Sweden −2.2, UK −1.8, Germany −1.4, Denmark −0.9.
In Denmark, only 56% of people in prison are actually Danes. Considering the enormous cost of keeping people locked up (160k USD/year for closed prisons), it would seem like a very easy policy optimization point here.
https://t.co/fZaYzRA2Ov
Fortunately there is a vast empirical literature on the relationship between IQ and moral reasoning.
Here's one quote:
"More intelligent individuals exhibit higher levels of moral reasoning. In a review of the findings, Kohlberg (1984) estimated a correlation between the level of moral reasoning and intelligence at r = .30-.50. Rest (1979) made a similar estimate, and research consistently shows that intelligence is also predictive of moral action (Kohlberg & Candee, 1984; Ruffle & Tobol, 2015)."
[The DIT, the Defining Issues Test, is a standard test of moral reasoning. It's now widely used in LLM benchmarking, as you may well know.]
https://t.co/JlD2CQPJr7