💡 Option income without losing overnight returns
Most covered call ETFs cap upside.
We fixed that with $BITK – Tuttle Capital IBIT 0DTE Covered Call ETF
• Sell calls each morning, expiring same day
• Capture intraday option premium
• Keep capital free for tomorrow’s move
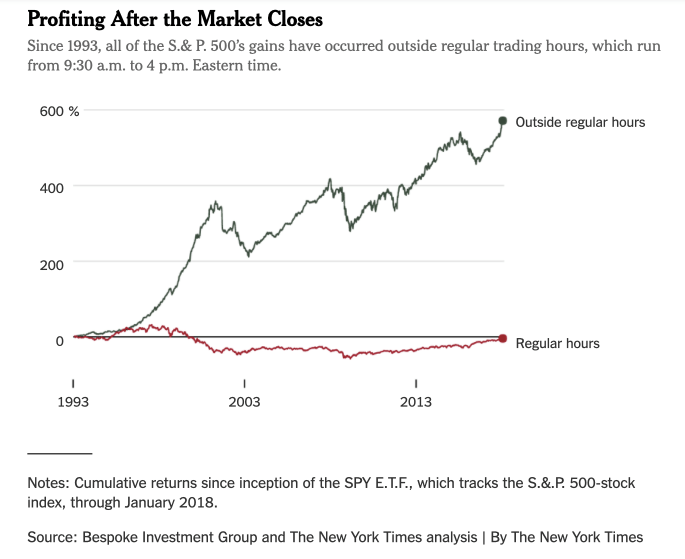
@BrianMelcher24 Particularly on the red days though! A Last hour/evening rally on red days is a very strong edge in ES, one of my favorites especially in downtrends but also in bull markets. Spoken about it often in newsletter
I think there is a 30% chance that BTC has topped for this bull market cycle. Next stop then back to $60k to $70k by Nov 2026, then next bull thrust to $500k
@alshfaw I see an August 2015 four trading day type drop of 12%, or an 8% drop in 2 trading days like in Aug 2024. This correction is going to be potent & quick.
@iceman_cry As I recall ...
Cem's call was a 30%-40% decline some time between Q4 2025 ➡️ Q2 2026
I believe his expectation was sooner (Q4) rather than later
Big picture ... 🥐 is looking at this as a rangebound decade similar to 68 - 82
This is the likely path & Powell will probably hint of it at his Jackson Hole speech on Aug 22. Correction in the market prior then meltup into the Sept Fed meeting is a high probability.
Not to sound too bearish but still think there will be some kind of late summer pullback, perhaps starting after July Options expiration in a few weeks. Would be ideal to see NAAIM spike to above 100 to see sentiment more frothy/bullish.
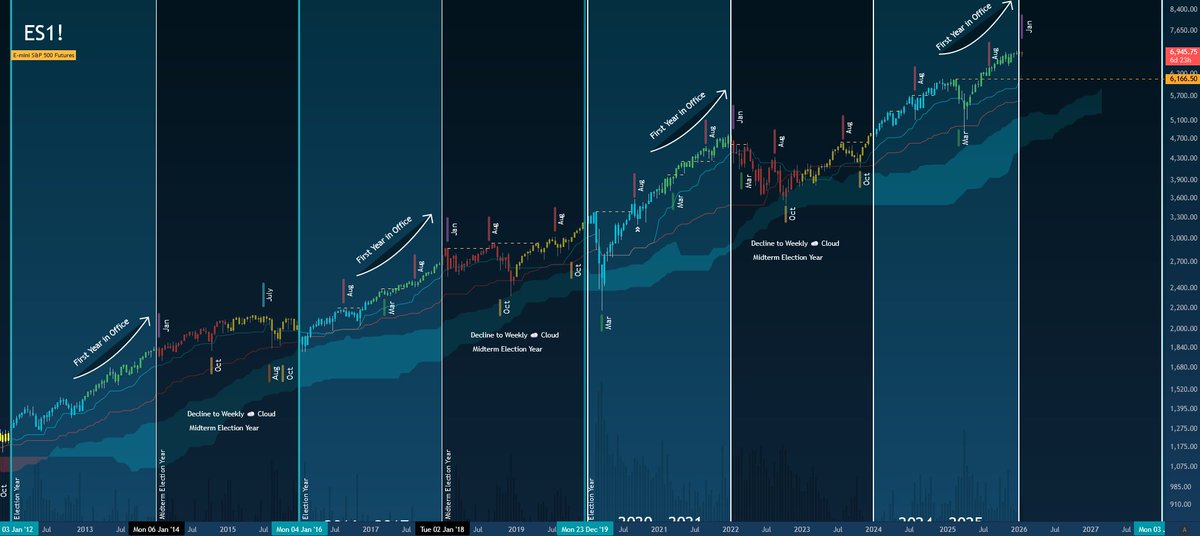
Seasonality wise the 1st year of Presidential cycle tends to see that in August/September which sets up year end rally into the Spring of following year. Should be interesting to see if market follows that path,
I’m likely not doing much of any trading until July 18, OPEX. I’m not chasing the rally at these levels & will move any new $SPY put positions to late October. In the last 12 days I’ve executed 1 trade (Bought Sept 19, SPY $615 puts 6 days ago). Patience is always rewarded. 😊👊🏽
The S&P 500 has formed a "Golden Cross" (50 day moving average crossed above 200 day moving average).
Here's every Golden Cross in the past 50 years, and what the S&P did next:
@10009nyny@NickWoolos PS: The headline price of 2 indexes doesn’t tell you what’s happening under the entire market hood. It ain’t pretty & all that’s happening is a nominal new high in 2 indexes. That’s exactly how it was in the spring of 2000 & the 3Q of 2007.