S&P 500 IS RALLYING ON EMPTY VOLUME
And that's exactly the problem
When price goes up but volume stays low - it means there's no real conviction behind the move
We saw this exact setup in early 2025:
1. Low volume rally - price goes up, nobody's really buying
2. Volume picks up - first warning sign, distribution begins
3. High volume sell-off - that's when it gets ugly
Right now the same picture is forming again
I'm not saying the dump is guaranteed, but when volume finally returns to this market, it won't be buyers leading the charge
Save this. Let's see who's right!
$BTC 2026 Bear Market Structure | WXY
This is how I see the structure of this Bear Market
We've already spent more time chopping between $62-78k than between $84-97k back in November-January, so now I assume we are dealing with a Double Zigzag (WXY) and this move from $60k to $79.5k (could go even higher as the next major resistance sits at $85k and the ABC target is $82.5k, so a little more upside would be quite normal) is Wave (X) between two bearish Waves (W) & (Y).
From the timing perspective, we still have ~5 months of this bear market left.
Wave (W): $126k --> $60k
Wave (X): $60k --> $80k
and now I'm expecting the final wave down - Wave (Y): $80k --> $40k (Bear Market Bottom in September-October 2026) 📍
Apr. 16, 2026 Day Trade Plan:
--------------------------------
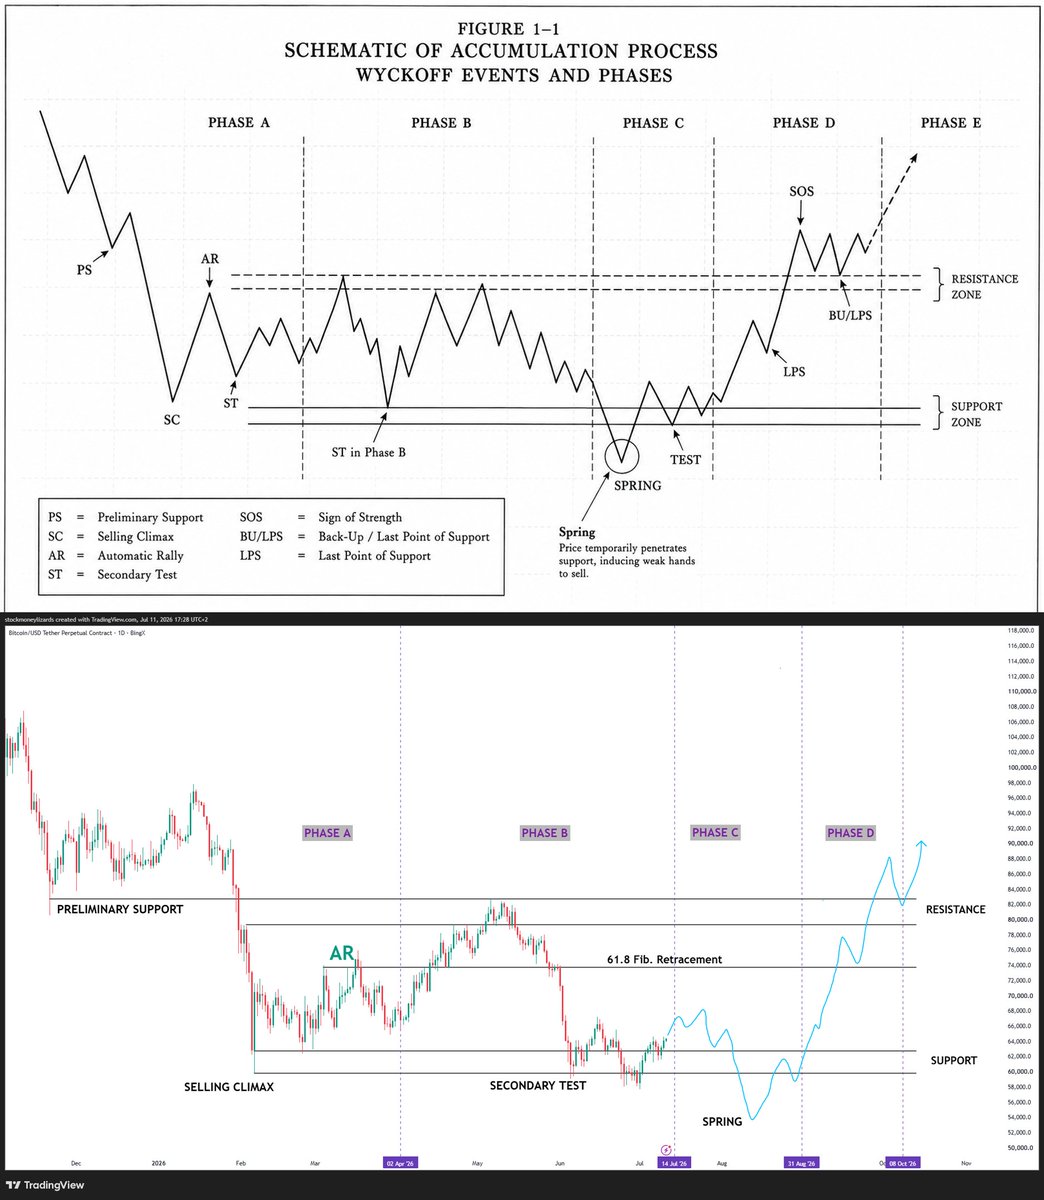
let me start this post by saying i am very sensitive and aware of moving goal posts - i despise it when i see people do it, and i don't use methodologies that encourage it. this is one of the reasons why i stopped using elliott wave analysis decades ago in the early part of my journey. so i am very careful about the words i am using in what i am about to share
the wyckoff distribution pattern is very close to being invalidated after the massive rally that was detonated on the ceasefire news. as i described weeks ago, i was anticipating a countertrend rally bounce back up as the short positioning was excessively overcrowded. this is why i was not short the market and mostly in cash even as i was still scalping in and out of long uso positions. what i did not anticipate was the size of the rally to new all time highs without any pullbacks. but here we are
so, is the wyckoff distribution from last october invalidated? it will be, if this is not the final UTAD. the recent low we cranked out could have been an mSOW or a minor Sign of Weakness. this low would have punctured underneath the horizontal distribution box before rocketing back up to a new ATH to print the final UTAD. of course, the rally will have to fail for the UTAD to be printed, LPSY to set it, and the MSOW or Major Sign of Weakness to be locked in
the good news is that we don't have to wait much longer given where we are - any price movement much higher, especially if there is a drop and successful retest before moving back up will definitively invalidate the wyckoff. conversely, any major move back down - and it will have to be a swift move all the way back down once it starts - would keep the wyckoff alive
as always, patience is key and refraining from the impulse to front-run and jump the gun is the discipline. once the signals are clear, i will be ready to take action long or short. until then, i continue to remain mostly in cash and just deploy scalp positions for long uso trades
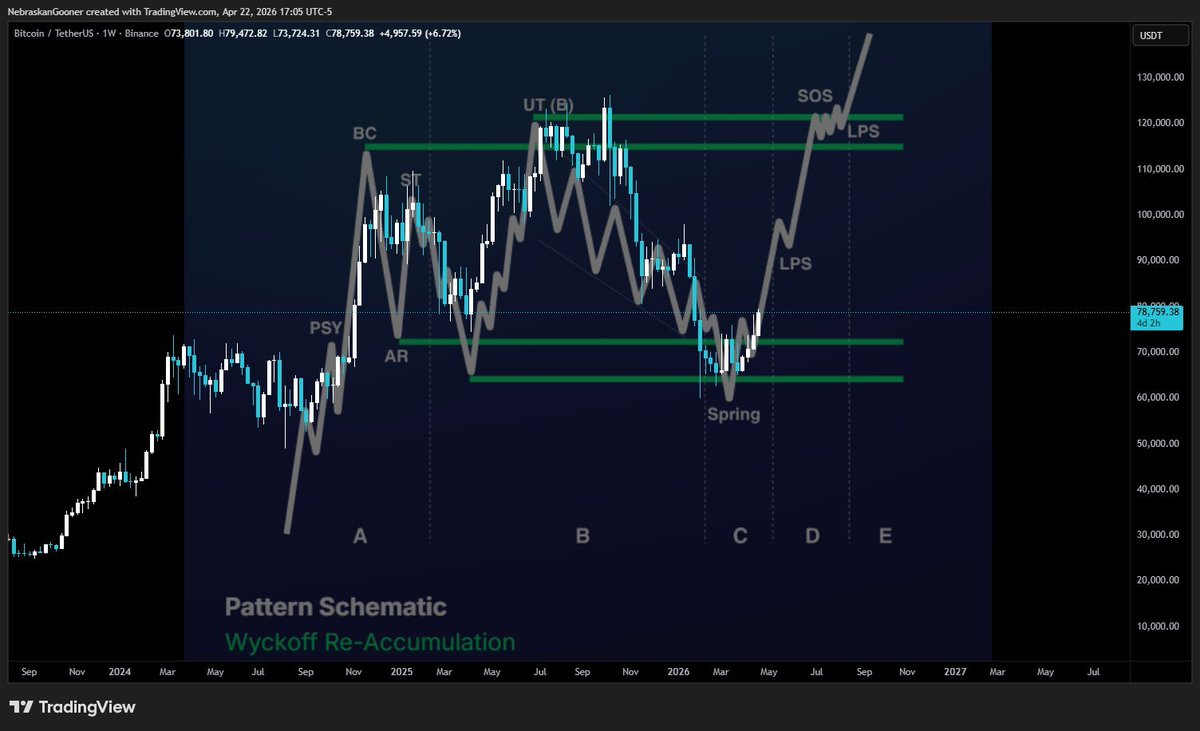
#Bitcoin – What’s Next?
The Big Sunday Report: All We Need to Know
🚩 TA / LCA / Psychological Breakdown: A few days ago, I gave a long at the 71k region and mentioned targets of the 79–84k region, and I am now changing something in the plan! I previously said that between 79–84k I would take profit of the long and ADD more SHORTS, this strategy has now changed and is very important to understand!
My long from the 71k region remains open, but my take profit has changed. Instead of taking profits between 79–84k, I will take HALF OF THE POSITION SIZE as profit at the 76,200 region, and this is also very important to understand! I am NOT adding short orders at 76,200, but still between 79–84k in case the market allows a move there. The other half of the long will also be closed between 79–84k if the market reaches that region. Once 76,200 is hit, I will take profit on half of the position size of the long and move the stop loss to entry to avoid any loss and secure 50% of the profit. I hope this makes sense now. You might wonder where this shift comes from, and I need to admit a small mistake in my calculation: the probability of hitting 76k is very high, but the probability of reaching 79–84k is currently medium. Because of this, I am adjusting my take profit areas. Overall, the short from 115–125k remains open, and additional short orders are placed between 79–84k in case the market reaches that zone, I am not interested to add short orders at 76k region, just if we move higher and we see higher FOMO, I would be interested to add between 79-84k, not earlier.
I am expecting a large downside move in the coming weeks, it should not take much longer, as the move is very close. I am expecting the S&P 500 to crash within the next two months, with a downside move of more than 35%. In comparison, the S&P 500 dropped 34% during the COVID black swan event. I am expecting a much larger downside move this time, with a heavy domino effect.
I am expecting a large trap for bulls as well, something market makers will use to send us lower into the 50s area and even further afterward. We have not bottomed out. The only question now is: how high will we rise before continuing downward? Will it be 76k before rejection, or will we reach the 79–84k region first? This question needs more time to be answered with clarity. While I see the probability of 76k as extremely high, I currently see 79–84k as medium probability, and therefore I am adjusting my trade accordingly. Profit is the only option and I am using every move to make a profit, no matter what my bias are!
As always, I am very transparent with you regarding my trades and decisions, and I want to personally thank you all for the support you are giving. Congratulations to everyone who took the short with me at the exact top, I will keep it open and realize it at much lower levels than where we are now.
Join DrProfit Premium now: https://t.co/Ice9n2uknI
Everything is going exactly as I told you.
$73K has been hit.
The relief rally is over.
Bitcoin is entering the phase where cycle bottoms form.
For the record, I was the only one publicly calling the exact bottom at $16,000 three years ago and the top at $126,000 in October.
If you missed those calls, don’t worry. I’ll call the next one too.
Turn notifications on. If you’re not following yet, you’ll understand why that was a mistake later.
Peace talks between the US and Iran have failed.
What does this mean for markets?
We'll probably open with a huge gap-down on monday, followed by more downside in case the situation doesn't resolve.
The market has proven to be resilient, so we might not see a new low.
My gameplan is simple:
Buy when we drop into support.
Buy more when we retest the 2025 march high.
This is a massive opportunity.
Deep retracements lead to extended waves.
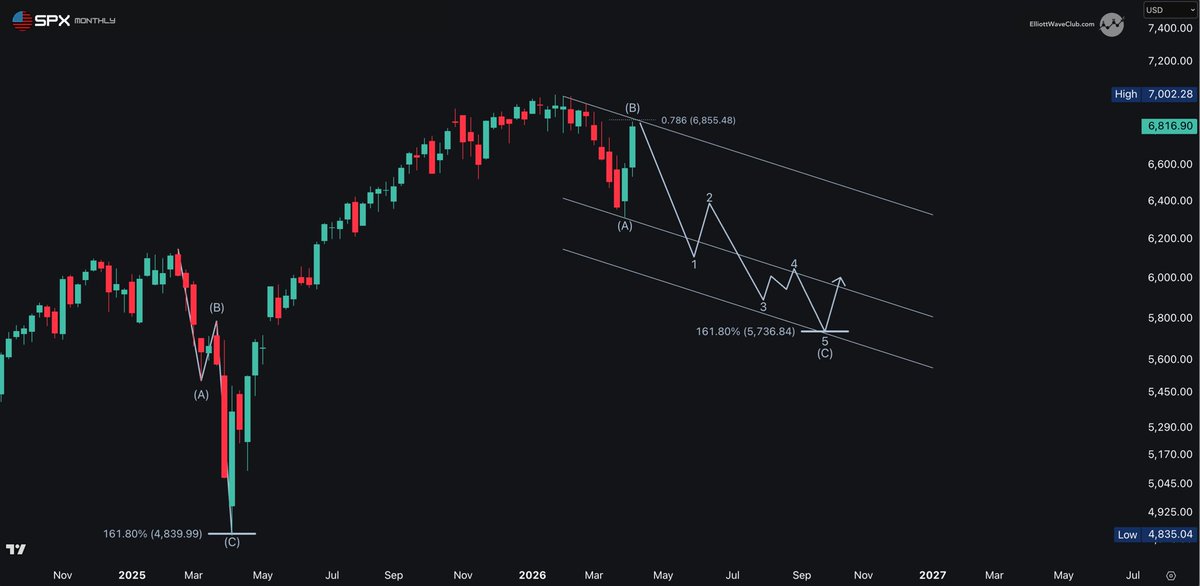
$SPX just retraced 78.6% of the decline.
Bulls see strength.
I see a B-Wave loading the SPRING.
The deeper B goes — the longer C tends to run.
Primary targets:
110% → primary
127.2% → high probability
161.8% → extension in play
The channel is drawn. The count is set.
A 161.8% C-Wave would MIRROR the 2025 extension.
History doesn’t repeat. It extends.
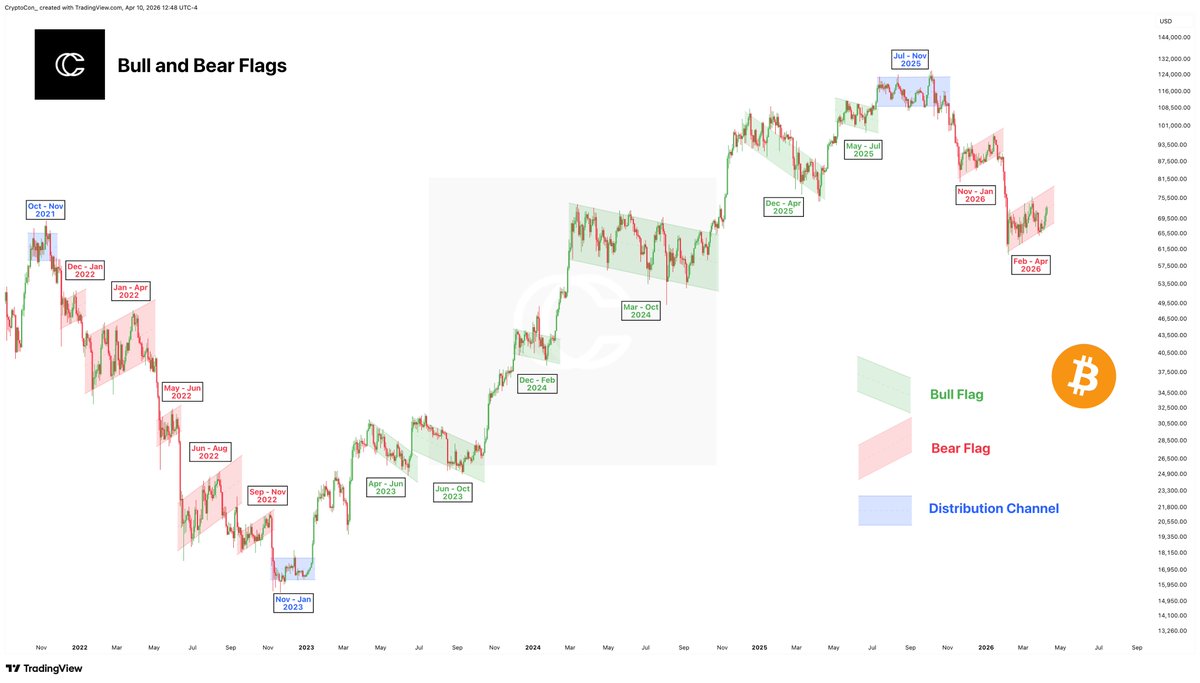
No pattern is bulletproof, but flags/channels on Bitcoin for the past 2 cycles have done a great job of showing what to expect.
And for the past 2 months, price has been in a textbook bear flag.
This is our second bear flag of the 2026 bear market. For reference, 2022 saw 5 before the cycle bottom distribution channel.
Flags are tricky, because inside of them price will be doing the opposite of the outcome. For bear flags, that's going up, fooling everyone into expecting upside continuation.
The math made it obvious for $BTC.
Bot accounts shilling Bitcoin = Moving toward 0.8 level
The cycle appears over with BTC.D weakening fast.
Nobody wants to see it.
Most people think learning swing trading takes 10,000 hours,but it's not true. Here's what you'll get out of this🧵
✅Understand what swing trading is
✅Know the benefits and risks
✅Learn how to develop a strategy
✅Understand importance of discipline and emotional control
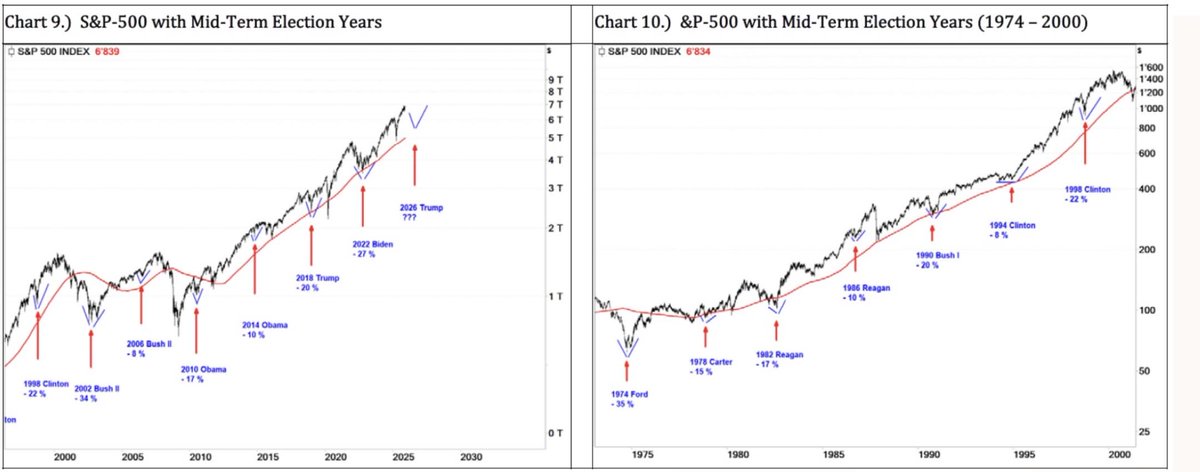
🚨 Desde 1974, el S&P 500 ha caído en cada año de elecciones de mitad de mandato. Sin excepción.
📊 El patrón completo desde 1974:
🔴 1974 Ford: -35%
🔴 1978 Carter: -15%
🔴 1982 Reagan: -17%
🔴 1986 Reagan: -10%
🔴 1990 Bush I: -20%
🔴 1994 Clinton: -8%
🔴 1998 Clinton: -22%
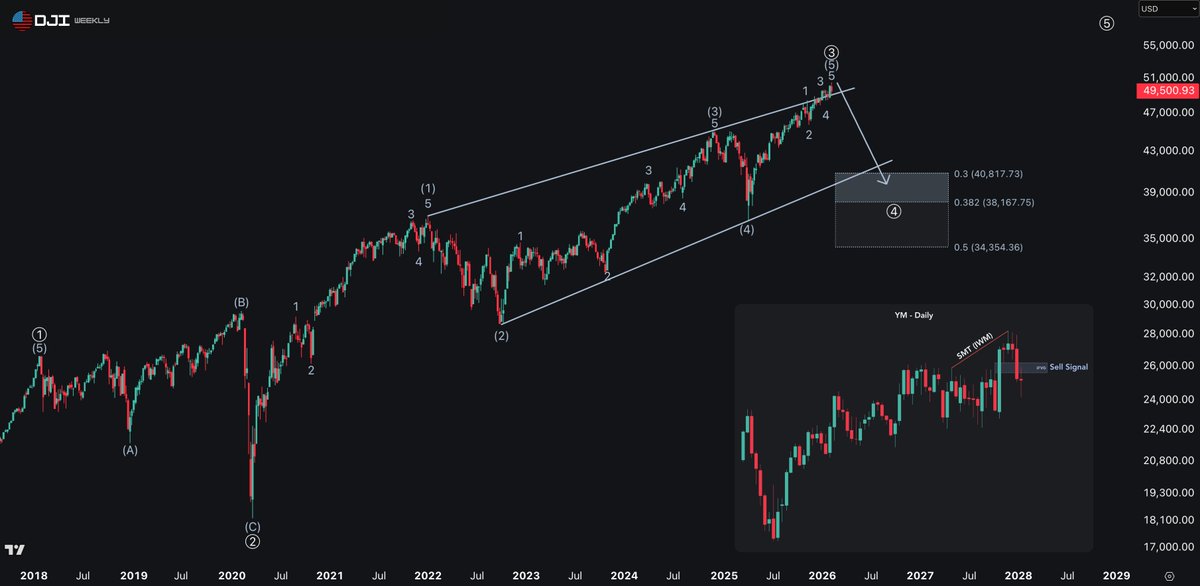
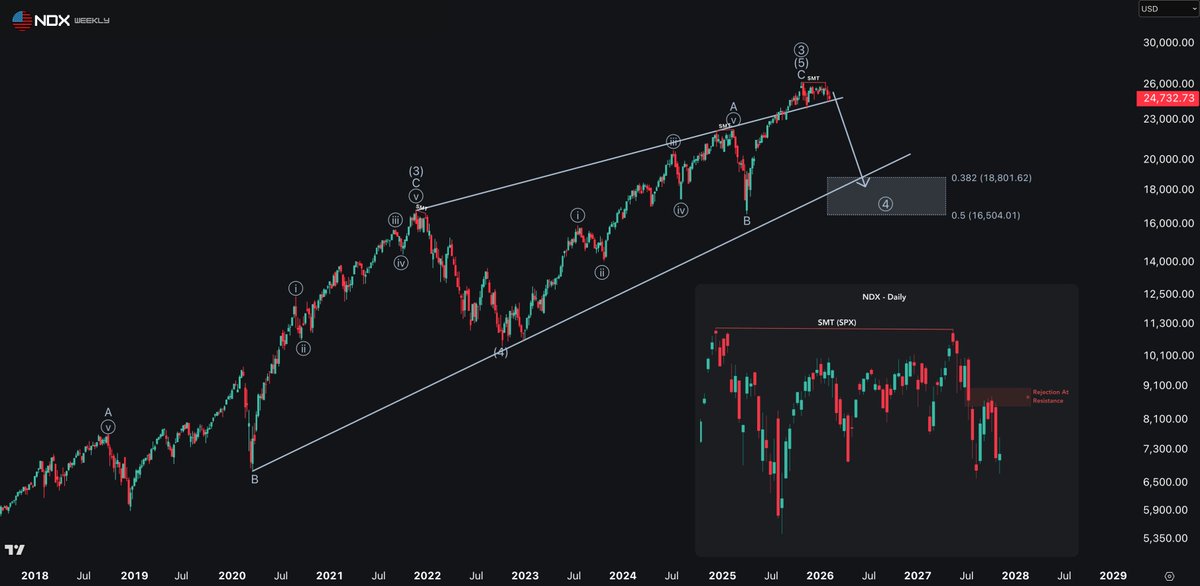
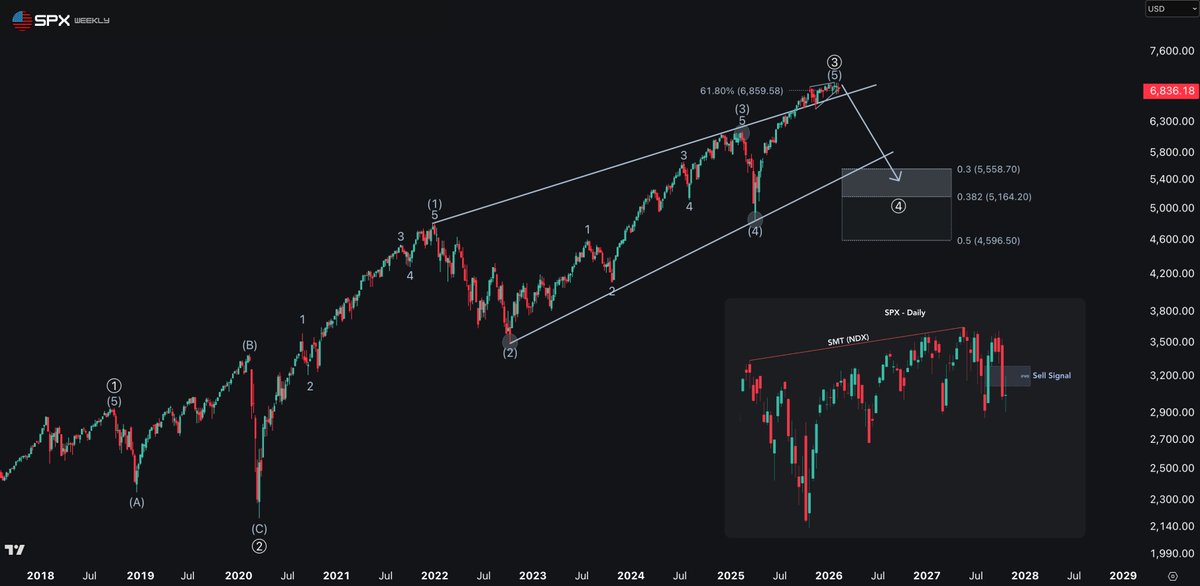
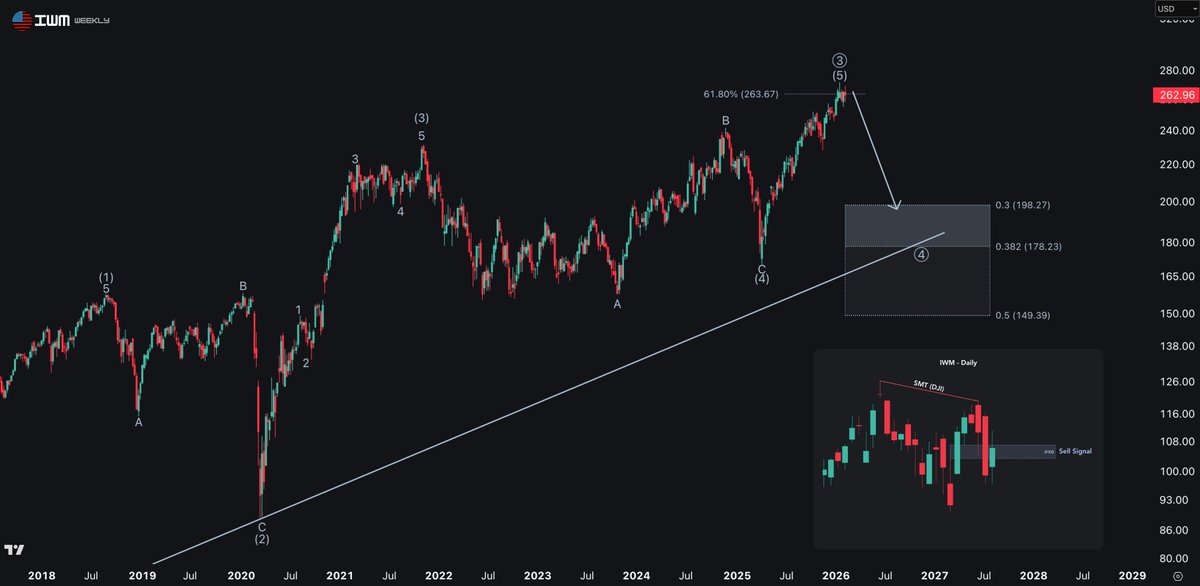
I'm leaning the tops are now all in for $SPX, $NDX, $DJI, and $IWM.
SPX, DJI, and IWM all sent SELL SIGNALS this week while NDX rejected at resistance.
$SPX topped Jan 28
$NDX topped Oct 29
$DJI topped Feb 10
$IWM topped Jan 21
Expecting a multi-month correction in 2026 with 20–25% drawdown across the board.
Bookmark this. You'll want the receipts later.
Reminder
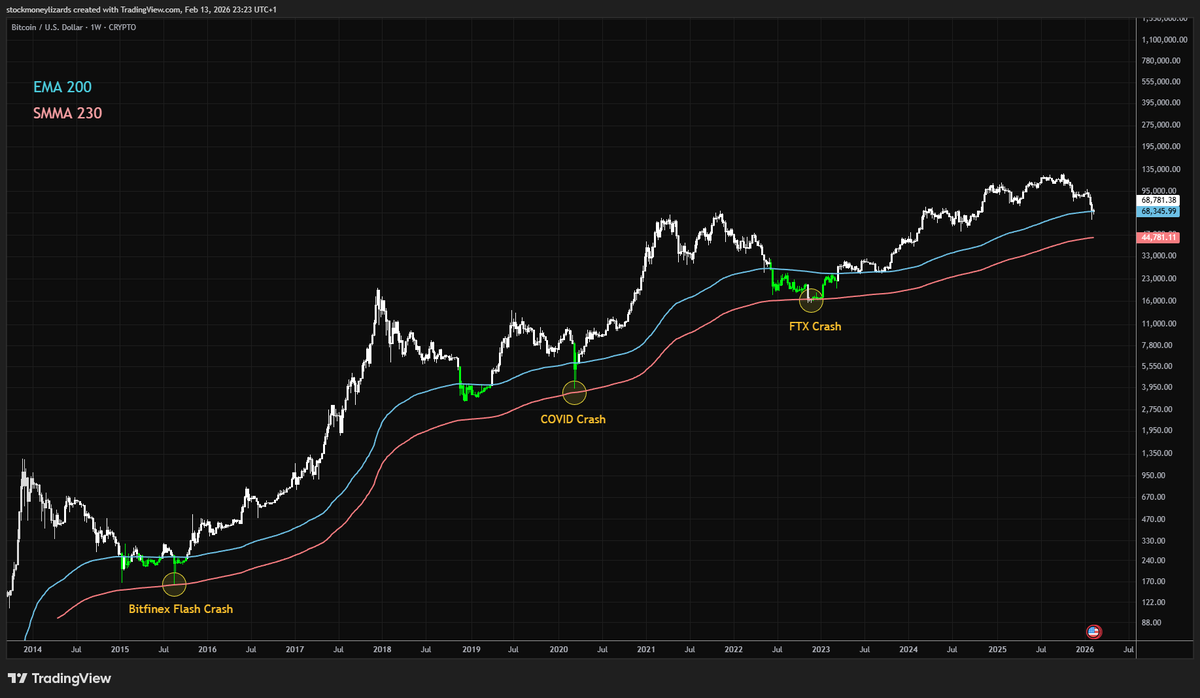
1. Bitcoin usually bottoms between the EMA200 and SMMA230
2. The SMMA230 is the last line defense: This happened 3 times so far in 10 years and each time, it took a black swan events for BTC to retrace that far
3. Each bottom in the past 10 years happened between these two moving averages
Bitcoin might not have found the final bottom. But it has definetely entered and touched the bottom zone.
The Best Time Frames Chart To Trade:
✅ 1. Scalping
Timeframes:
•1-minute (M1)
•3-minute (M3)
•5-minute (M5)
Why: Fast entries, low holding time, many setups.
✅ 2. Day Trading
Timeframes:
•5-minute (M5) → entry
•15-minute (M15) → confirmation
•1-hour (H1) → trend direction
Why: Clean intraday setups without too much noise.
✅ 3. Swing Trading
Timeframes:
•1-hour (H1)
•4-hour (H4)
•Daily (D1)
Why: Strong trends, fewer fakeouts, bigger moves.
✅ 4. Position Trading (Long-Term)
Timeframes:
•Daily (D1)
•Weekly (W1)
•Monthly (MN)
Why: Identifying big market cycles and long-term trends.
Most Accurate Combination for ANY Trader (my recommended)
•Daily (D1) → trend
•4-hour (H4) → setup
•15-minute (M15) → entry
This avoids losses from noise and gives high-probability trades.
Simple Rule
The higher the timeframe → the cleaner the trend.
The lower the timeframe → the more noise and fakeouts.
Generally Discipline Matters A lot:
$BTC 1D chart | Game plan for the next 2 months
Resistance: $74-79k
Support: $60-64k
I think we will spend some time between those levels before the inevitable breakdown 📉
🎯 Next Target - $48-50k (August 5, 2024 Low + 1.618 Fib)