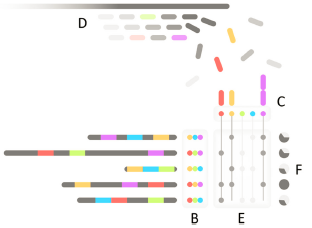
We got tired of looking back and forth between UMAP plots colored by class and time...so tired we made a new time-aware algorithm called IRIS. Hope you find it useful!
Code at https://t.co/tiKtk1Q1tS
Preprint at https://t.co/vMjz2Jj4lo
🎉Exciting News | Dr. @BrianOndov from @YaleBIDS has had his research, "Visualizing Multilayer Spatiotemporal Epidemiological Data with Animated Geocircles", recognized as Editor's Choice in the November issue of JAMIA. Read the full article: https://t.co/NaBvVKxIlL
How do our eyes quickly guess at stats from charts? To find out which "proxies" they use, we try to catch them in the act using adversarial examples. @BrianOndov@fumeng_yang@mjskay@NElmqvist @SteveFranconeri #ieeevis2020#ieeevis https://t.co/HlV2t4qUpJ
Important changes for #ieeevis authors: abstracts now due on April 20, 2020 and full papers on April 30, 2020. A generous and necessary extension, well done to the conference leadership. Full message here: https://t.co/9O6WG75EyD
Mash Screen: from @BrianOndov@aphillippy and co, a Mash-related method for seeing if genomes are contained in sequencing data. Can be used for contamination screening or metagenomics. https://t.co/jS4G8SLgZR
"Mash Screen: High-throughput sequence containment estimation for genome discovery" is published! Two years after I blogged about it, and 8 months after the preprint. I thank @BrianOndov for his patience and the reviewers for some key corrections https://t.co/boAWvvpnn5
The paper was awarded with an honorable mention for best paper at #ieeevis InfoVis 2019. Talk: Thu, Oct 24 at 4.10pm in Ballroom C. Team: @yo_jardine@BrianOndov, @SteveFranconeri. OSF: https://t.co/XTFoLod3B8 PDF: https://t.co/5Rhm24KZAJ (6/end)
Proud to be on Hon. Mention for InfoVis Best Paper #ieeevis2019, "The Perceptual Proxies of Visual Comparison" w/ @yo_jardine@NElmqvist @SteveFranconeri. Huge props to NWU coauthors for getting this across the line! DOI: https://t.co/dtzQd8ETB0 Awards: https://t.co/kRN8b1DtJ6
Researchers in this day and age need to be their own publicists. We in the @hcil_umd are now unveiling "Sparks of Innovation: Stories from the HCIL" (https://t.co/3OpniwrhD8), a new Medium publication on HCI research at the University of Maryland (@UofMaryland). (1/4)
The HCIL symposium is around the corner! Improve your practices with tutorials from the experts, and see talks on our cutting edge research, from cognition and interactivity to privacy and accessibility: https://t.co/hJoQekASXI
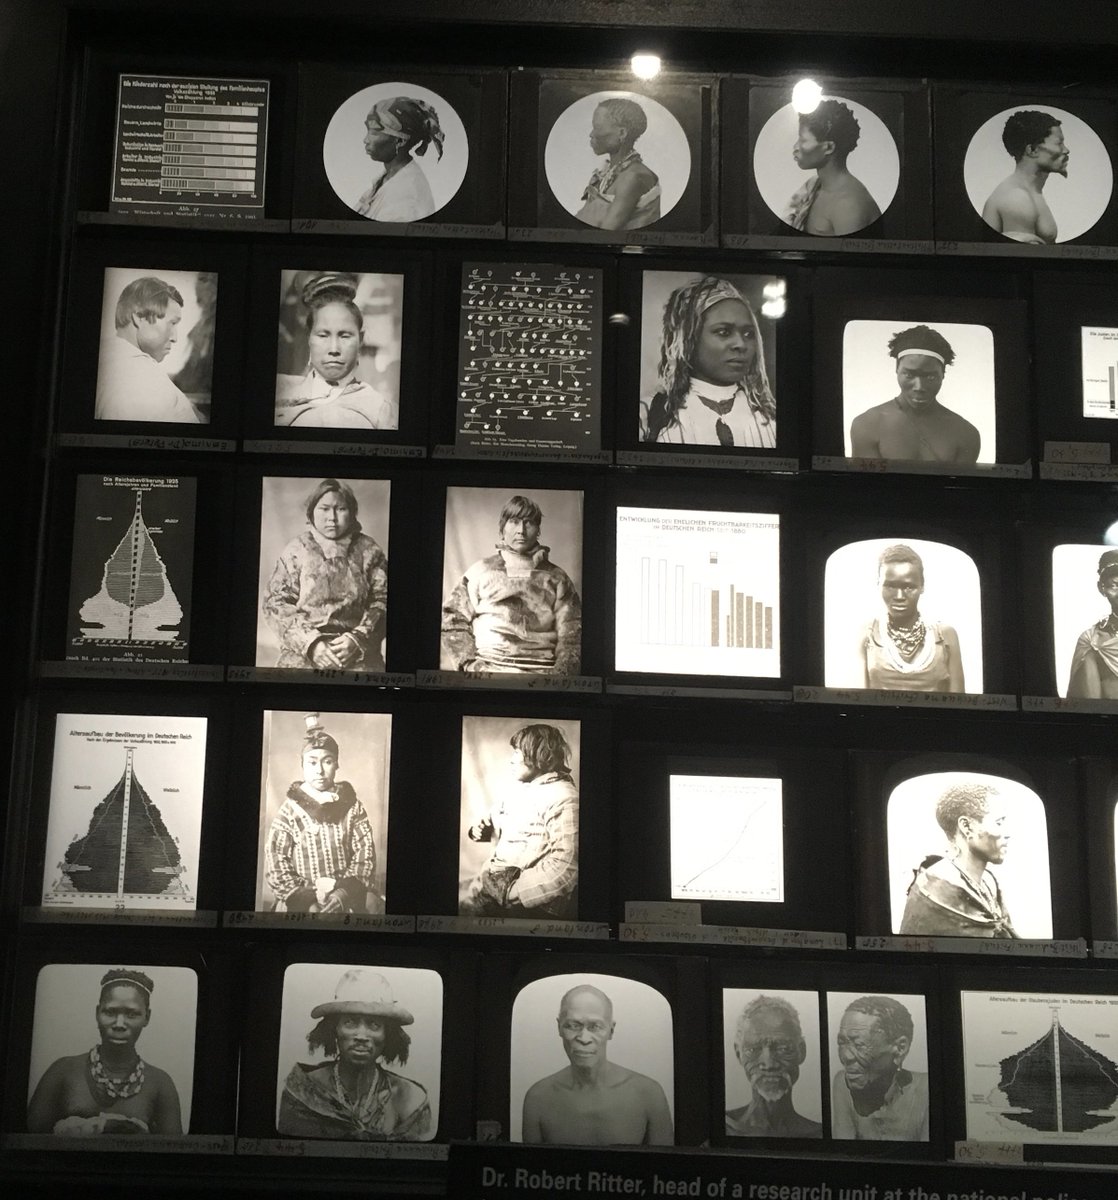
@NElmqvist@maartenzam Here are some from the DC Holocaust Memorial Museum. The pretense of science was a favorite tool of rationalization for the Nazis, and data visualization was apparently no exception.