Moving Average Answer Key:
Moving averages allow traders the ability to quantify trends and act as signals for entries, exits, and trailing stops. They can become support and resistance, and give the trader levels to trade around. Below are examples of the specific moving averages with time frames.
• 5 Day EMA: Measures the short term time frame. This is support in the strongest up trends. This line can only be used in low volatility trends.
• 10 day EMA: “The 10 day exponential moving average (EMA) is my favorite indicator to determine the major trend. I call this ‘red light, green light’ because it is imperative in trading to remain on the correct side of a moving average to give yourself the best probability of success. When you are trading above the 10 day, you have the green light, and you should be thinking buy. Conversely, trading below the average is a red light. The market is in a negative mode, and you should be thinking sell.” – Marty Schwartz
• 20 day EMA: This is the intermediate term moving average. It is generally the last line of support in a volatile up trend.
• 50 day SMA: This is the line that strong leading stocks typically pull back to. This is usually the support level for strong up trends. Use 50-Day Average For Trading Signals
• 100 day SMA: This is the line that provides the support between the 50 day and the 200 day. If it does not hold as support, the 200 day generally is the next stop.
• 200 day SMA: “My metric for everything I look at is the 200-day moving average of closing prices. I've seen too many things go to zero, stocks and commodities. The whole trick in investing is: “How do I keep from losing everything?” If you use the 200-day moving average rule, then you get out. You play defense, and you get out.” - Paul Tudor Jones
Bulls like to buy dips when price is above the 200-day moving average, while bears sell rallies short below it. Bears usually win and sell into rallies below this line as the 200 day becomes resistance, and bulls buy into deep pullbacks to the 200 day when the price is above it. This line is one of the biggest signals in the market telling you which side to be on. Bull above, Bear below. Bad things happen to stocks and markets when this line is lost.
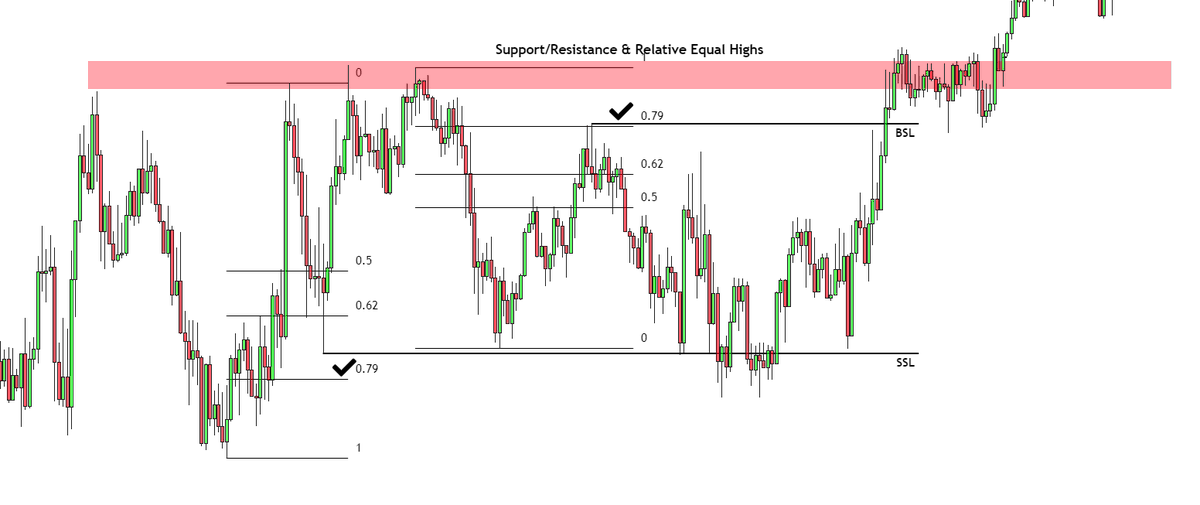
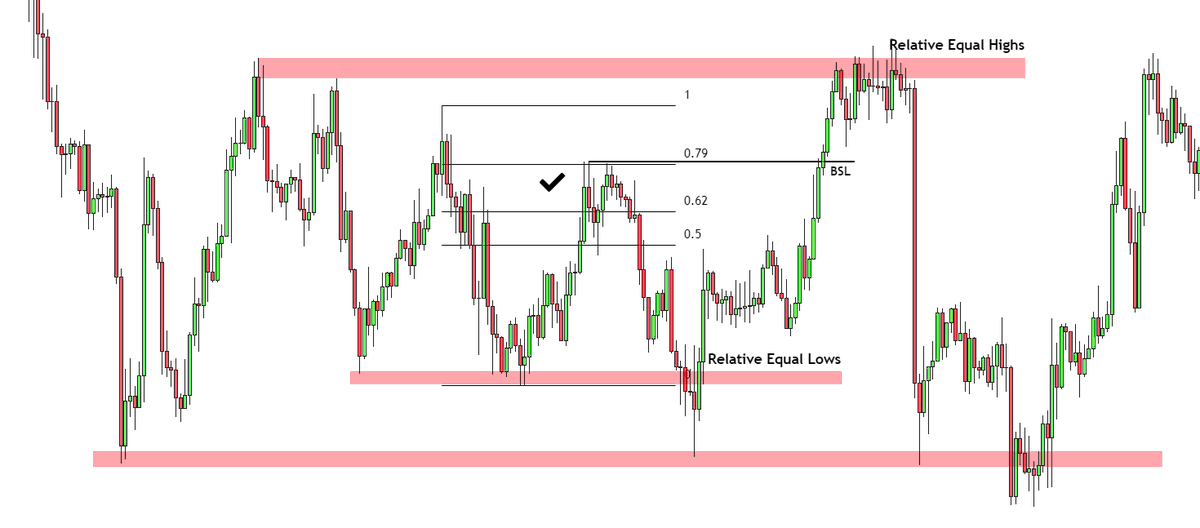
⭐️ Educational Masterpiece - What and Where is LIQUIDITY❓ ⭐️
❗️Liquidity is a very complicated and advanced concept that requires deep thinking skills. It is what allows you to outsmart the markets.
🙏 Like, RT & Join my FREE TELE for calls/signals https://t.co/Jcr2772pXm
Trading Fibonacci tools
a) Check the trend
b) Wait for a retracement
c) Enter on a bounce or rejection
d) Set stop-loss below the recent low/high or below/above the Fibonacci level
e) Use extensions for the target area
15/
3/ Price Action (PA) trading:
PA helps to predict market movements by spotting patterns or ‘signals’ in the price movements of an underlying market.
Learn different price action strategies here-
https://t.co/wNyFtnc6AI
Resources For Traders 🧵
This is a list of different platforms that provide useful data and tools to make better trading decisions.
Let me know if you want my tutorials on how to use these and retweet for Part II.
1/14
I went from 0 coding experience to landing a job as a developer in 6 months...and spent $0 doing it
Here are the topics I focused on and some FREE resources you can use to do the same (warning: 100s of hours of content)