When cash levels are at 3.6%, there’s not much cash to buy more stocks with!
What this means? Either we see rotation from the cash sloshing around in markets or bulls need to rein in their horns a bit. Anytime cash levels get this low, it’s a warning and contrarian indicator! ⚠️
Source: BofA
In 2026 H1, the cumulative domestic sales volume of the PV market in China reached 8.7M units, -20.2% YoY. 🇨🇳
• #BYD led the market with 795.7k units, though down 45.9%. Volkswagen and Toyota followed with 665.5k (-28.8%) and 614.8k (-17.1%).
• #Geely ranked 4th with 399.8k (-25.1%), while Galaxy secured 5th place with 378.7k (-17.5%).
• Leapmotor ranked 7th with 260.2k units, +33.7%. #Xiaomi and AITO also sustained growth, at 185.1k (+17.2%) and 162.7k (+10.2%).
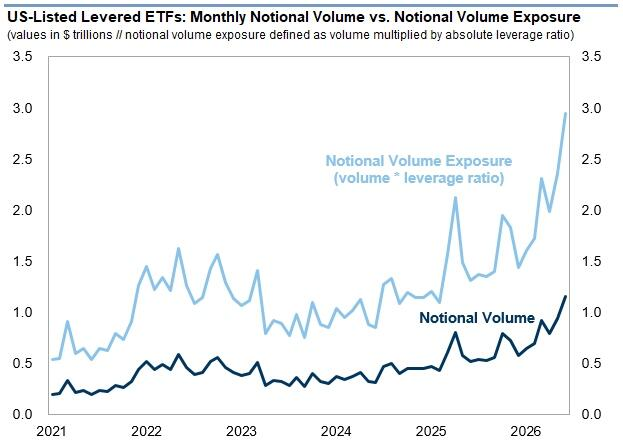
⚠️LEVERAGED FRENZY IN THE US MARKET IS UNPRECEDENTED:
The ratio between the leveraged long and leveraged short ETF volumes is up to 4.5x, the highest since the 2021 meme stock mania peak.
This metric has TRIPLED since the March market low.
Last time the market saw such a spike, a bear market followed within the next few weeks.
This comes as US leveraged ETF trading volume is now hovering between $50 and $90 billion, an all-time high.
There are also now a record ~700 US-listed leveraged ETFs, with over 200 launched this year alone, or ~33% of total US ETF launches.
This is crazy.
Great chart @topdowncharts
US households are sitting on a massive cash pile despite record equity exposure:
Household equity holdings are up to a record ~$72 trillion.
This is $18 trillion, or +33%, above its long-term trend from 2009 to 2019.
Household stock ownership has more than doubled since 2020.
Meanwhile, cash and cash equivalent holdings are up to $20 trillion, an all-time high.
This exceeds the long-term trend by $5 trillion, or +33%.
By comparison, households also own a record $11 trillion in debt securities such as bonds, $2.2 trillion, or +25%, above trend.
American households have never had a bigger cash buffer.
And crazier
"levered ETFs represented nearly $3 trillion in gross volume exposure last month, which is equivalent to ~40% of June US-listed ETF notional volumes. Levered ETFs currently account for $175BN in AUM but represent more than $430BN in gross exposure"-GS
The US economy is now dependent on AI spending:
AI investment now accounts for more than 25% of US GDP growth, the largest contribution on record.
This includes spending on software, IT equipment, R&D, and data centers.
In other words, for every $4 of US economic growth today, over $1 is coming from AI investment.
This comes as AI spending is up to a record ~8% of US GDP.
By comparison, spending on IT equipment, software, and R&D peaked at ~6.5% of GDP during the 2000 Dot-Com bubble.
US economic growth is now all about AI.
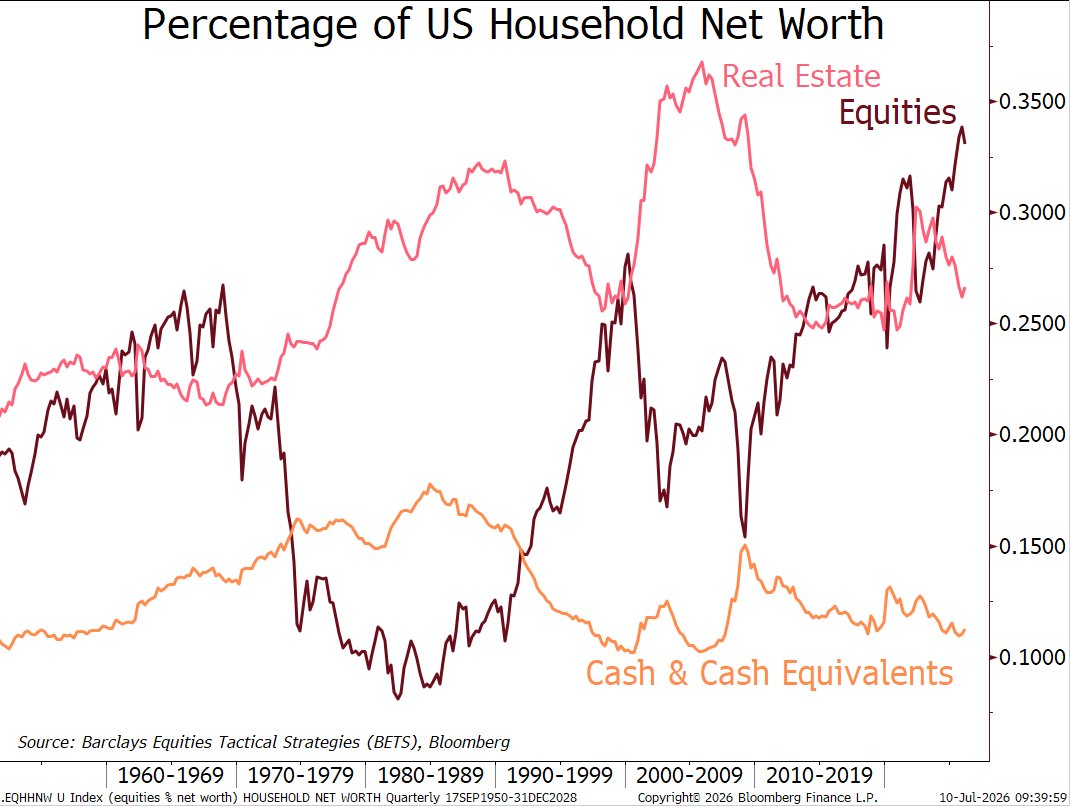
Amazing chart from today's episode:
It's not just that US household exposure to equities is at a record high, but that the stock market is a SIGNIFICANTLY greater component of total household net worth than real estate now, which blows my mind.
The stock market is the economy.
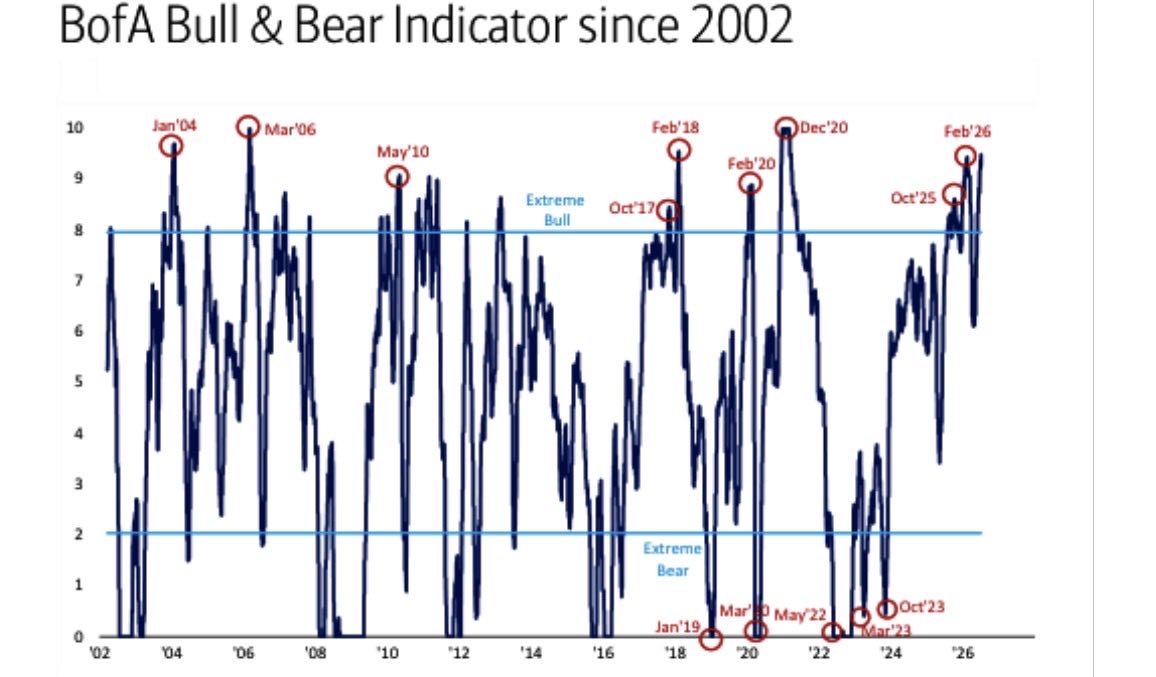
Bank of America Bull/Bear Indicator
Now back to extremes. We are now higher than at our last February peak before our March correction.
Have a Fantastic Friday! 😊
Source: BofA Global Research
🇺🇸 Margin Debt
Investor cash minus margin debt has fallen to negative $992 billion, the lowest on record and deeper than any prior cycle. It points to rising risk and a more fragile market, not a guaranteed crash
👉 https://t.co/blMxcoFA78
h/t @LanceRoberts $spx #spx#stocks
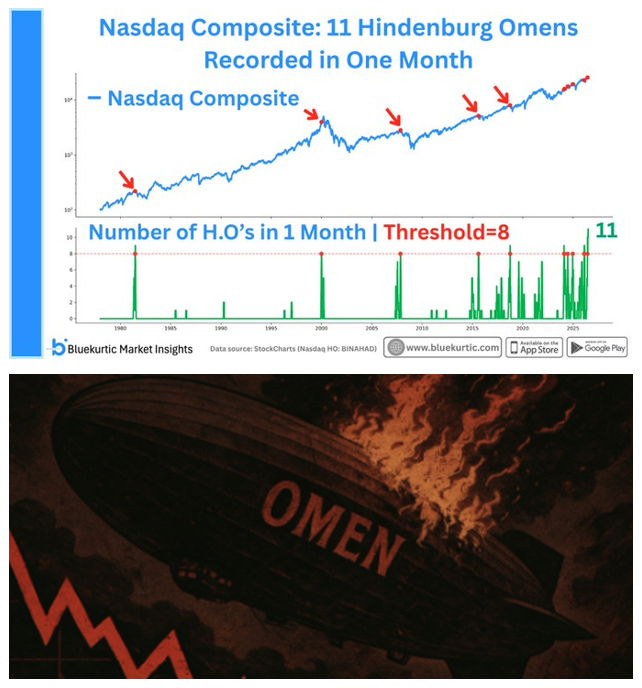
Stock Market Crash "Hindenburg Omen" Triggered 🚨
The Hindenburg Omen, an indicator that correctly detected the 1987 and 2008 stock market crashes, has been triggered 11 times over the last month for the Nasdaq, the most in history 🤯👀