El juicio a Lindsay Clancy, la mujer que ha matado a sus tres hijos, ha terminado sin veredicto. Once miembros del jurado (nueve mujeres y dos hombres) estaban dispuestos a declararla no culpable por falta de responsabilidad criminal. Un solo hombre se ha negado. Como el veredicto debía ser unánime, el juicio se ha declarado nulo y el caso podrá volver a empezar ante otro jurado.
Los mismos hechos, las mismas muertes, otra docena de personas. Y quizá, la próxima vez, otra conclusión. Pocas situaciones muestran con tanta nitidez hasta qué punto aquello que llamamos bien y mal depende de algo mucho más inestable que los hechos: el relato que construimos alrededor de ellos.
El relato salva vidas y destruye vidas con la misma facilidad. Porque la moral no es tanto un sistema para hacer del mundo un lugar mejor, en abstracto, como un dispositivo de coordinación endogrupal.
Dicho de otro modo: los hechos no contienen por sí mismos su significado moral. Se lo damos con relatos.
Relatos que cambian la arquitectura causal que colocamos alrededor. Y al cambiar las causas, cambia la agencia. Al cambiar la agencia, cambia la culpa. Al cambiar la culpa, aparece o desaparece el mal.
La moral no opera principalmente sobre acontecimientos, sino sobre modelos causales de acontecimientos. No juzgamos simplemente qué ha hecho alguien. Juzgamos quién creemos que era esa persona cuando lo ha hecho, qué alternativas creemos que tenía, cuánto control atribuimos a su cerebro, qué intenciones inferimos y hasta dónde extendemos la cadena causal. Una descripción suficientemente estrecha produce un monstruo. Una descripción suficientemente amplia puede producir una víctima.
Todos tenemos a monstruos y víctimas en nuestros relatos. Que son otros monstruos o víctimas para otras personas o grupos
Pero "relato" no tiene por qué significar mentira o manipulación. Es inevitable. No se puede juzgar moralmente el mundo sin un relato.
El relato ganador determina dónde cortamos la cadena de explicaciones y decimos "a partir de aquí comienza la responsabilidad".
Una moral compartida permite que miles o millones de individuos predigan aproximadamente las reacciones de los demás. No matar, no robar, cumplir promesas, castigar al traidor, proteger al vulnerable. Su función adaptativa no necesita ser "hacer el mundo mejor". Basta con que reduzca la incertidumbre social, estabilice expectativas, facilite cooperación y permita identificar quién merece confianza, castigo, protección o expulsión.
Lo que explica algo aparentemente paradójico. Dos comunidades pueden observar exactamente los mismos hechos y experimentar certezas morales opuestas sin que ninguna de ellas sienta que está "inventando" su moralidad. Cada una ha colocado los hechos dentro de una red causal diferente. Desde dentro de cada red, la conclusión parece evidente.
1/ El Viaje del Héroe, en tu vida y en los negocios.
Para dimensionar el viaje de héroe es indispensable estar familiarizado con las cadenas de Markov, las Martingalas, la Ley de Variedad Requerida de Ashby, el principio Ana Karenina y los sistemas complejos y sus atractores🧵↓:
Repite conmigo.
No invertiré en ETFs apalancados.
No invertiré en ETFs apalancados.
No invertiré….
Hace un par de días colapsó el ETF GraniteShares 2x Long Lucid Daily tras un falso rumor de quiebra.
Vamos con un hilo sobre el tema 🧵
This image has stood the test of time for a reason.
When markets get choppy, I tend to focus on undercuts, failed breakdowns, and reclaim setups because they force weak hands out before the next potential move higher.
In stronger trending environments, b/o's can work better... but I'm also willing to buy dips into the 9/21EMA while anticipating the breakout before it happens. The strike rate might be slightly lower, but the risk/reward is often much better because my stop is already defined underneath support.
Different environments, but the same goal... to define risk tightly and position before the crowd.
Bitcoin fell to within 9% of the price that has marked the bottom of every recent bear market. And almost nobody capitulated. That is the problem.
That line is the realized price, $53,600, the average price every holder paid for their coins. In 2018 and 2022, Bitcoin dropped to it and turned, because that is where holders break, sell at a loss, and exhaust the supply. Last week was the closest it has come since the 2022 low.
But the thing that makes that line a floor is missing.
In the 2022 capitulation, holders sold 1.2 million coins at a loss. This time, 187,000. Bitcoin reached the bottom’s address without the bottom’s behavior. The flush that clears weak hands and ends a bear market has not happened.
Because this is not panic. It is absence. Demand fell 652,000 coins last week, the worst since January 2022, and ETF buying turned the most negative since the funds launched. Bitcoin did not crater because holders ran. It sank because buyers left. A floor built on capitulation has an exhaustion point. A floor built on vanished demand does not. It slides until someone bids.
Be precise. The realized price has marked four of the last four major bottoms, and long-term holders are sitting still rather than selling. That is the bull case, and it is real. But “price is at the floor” and “the market has bottomed” are different claims. One is a level. The other needs sellers to finish and buyers to return. Right now, neither has.
The chart everyone is posting as a buy signal is really a question. Bitcoin is cheap by the only cost basis that has ever mattered, and unwanted by every flow that usually marks a turn. The bottom was never a price. It is a behavior, and it has not shown up.
One last number. The market’s average cost is $53,600. Strategy’s is $75,700. Even here, Saylor is underwater while the average holder is still in profit, because he bought above the crowd.
The Daily says:
Sell first. Ask questions later.
The Weekly says:
First real pullback we've seen since March.
The Monthly says:
Relax.
That's the problem with staring at one timeframe.
The Daily looks ugly.
The Weekly looks normal.
The Monthly barely notices.
Same market.
Different perspective.
$SPX $SPY $QQQ @Optuma
Lo prometido es deuda
Estamos entrando en uno de esos momentos donde se juntan muchas cosas a la vez en el mercado. Llevo días analizando el posicionamiento en opciones del S&P 500, la superficie de volatilidad y los flujos de dealers, y creo que merece la pena compartir lo que veo. Va a ser largo, pero intentaré que se entienda bien el formato educativo. Vamos.
El amortiguador de la bolsa: Actualmente estamos a una distancia cómoda de la "línea roja" del mercado, situada en los 7.185 puntos(VT). Mientras estemos por encima de ese nivel, los programas matemáticos de los MM compran cuando hay bajadas y venden cuando hay subidas, lo que actúa como un amortiguador perfecto.
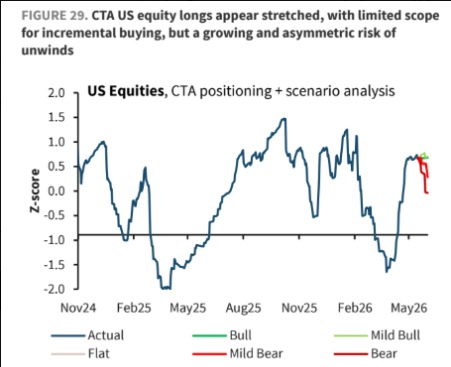
El problema de esa línea roja es que si la bolsa cayera por debajo, el mecanismo se invertiría de golpe. Los sistemas automáticos pasarían a vender masivamente ante cualquier bajada, amplificando el pánico y acelerando la caída. Estes fondos CTAs ya están rozando el límite de upside en equity. Como se ve la asimetría es en el lado corto.
Don @wish_or_truth un servidor les presentamos a su consideración este informe (más tarde se subirá el documento íntegro )
Crisis Irán : tres presiones estructurales convergentes alcanzan simultáneamente su punto de no retorno
A máquina que supera o Universo.
⚙️ Criada por Daniel de Bruin, a "The 100-Gear Exponential Machine” (ou simplesmente a máquina das 100 engrenagens) é composta por 100 engrenagens, cada uma com uma relação de redução de 10:1 em relação à anterior.
🔄 Isso significa que, para cada 10 voltas de uma engrenagem, a próxima gira apenas 1.
Quando essa redução é repetida 100 vezes, o resultado é extremo:
⚙️ Para que a última engrenagem complete uma única volta, a primeira precisaria girar 10¹⁰⁰ vezes — um número chamado googol.
Para comparação: O Universo observável contém cerca de 10⁸⁰ átomos. Ou seja, o número necessário para mover a última engrenagem é muito maior que a quantidade de átomos existentes no cosmos.
Se a primeira engrenagem girar uma vez a cada 3,5 segundos:
A 5ª já levaria horas para completar uma volta.
A 8ª levaria cerca de um ano.
Após 4,6 bilhões de anos (idade da Terra), a 18ª mal teria completado meia volta.
Mesmo após 13,8 bilhões de anos (idade do Universo), a 21ª praticamente não teria se movido de forma significativa.
Forçar a última engrenagem exigiria velocidades e energia que ultrapassam limites físicos fundamentais — incluindo os impostos pela relatividade.
⚛️ Essa máquina é uma representação concreta do poder do crescimento exponencial e dos limites da física.
Às vezes, o impossível não está na força aplicada — está na matemática envolvida.
This is 1 of the main screeners I use every single week to track the strongest names in the market & exactly how I use it:
Nothing fancy, just a process that helps me consistently narrow down where institutions are already putting money to work.
The goal of this screener is simple:
Find stocks with momentum, liquidity, relative strength, and enough volatility to actually produce meaningful asymmetric opportunities.
Here’s what I’m filtering for and why it matters:
1) Price > $10
Avoids illiquid garbage and low-quality names.
2) ADR > 4%
I want names that MOVE. If a stock only moves 1–2% a day, it’s usually not worth my attention for my style.
3) Price above 52W low by 70%+
I want names already proving strength, not dead stocks trying to “bottom.”
4) Price x Volume > 10M
Liquidity is very important. I want real participation.
5) EMA 9 > EMA 21
Short-term momentum confirmation.
6) Price > 50EMA
I want names above important trend structure, not fighting underneath it.
This screener is where the research begins.
Once I have my names, I manually go through charts one by one and ask:
* Is this a leading stock in a leading group?
* Is volume confirming the move?
* Is this extended or still early?
* Is there a multi-month base forming?
* Is relative strength improving vs the market?
* Is there a narrative institutions can pile into?
That’s where names like $ARM, $MU, $DOCN, $WULF, $APLD, $INTC, etc first started grabbing my attention.
Then the watchlist process begins.
I’m usually not buying the second I find the stock. Most of the time I’m stalking it for days or weeks waiting for the right structure to appear. I’ll track:
> pullbacks into the 9/21EMA
> tight consolidations
> volume drying up
> higher lows forming
> failed breakdowns/U&Rs
> relative strength on red market days
This is where the nuance comes in.
A beginner sees “a stock going up.”
I’m trying to identify whether institutions are accumulating, whether supply is drying up, whether the stock is tightening before expansion, whether the group is strengthening, etc...
Once all those layers line up, THEN I focus on execution.
And honestly… the entry tactic matters less than most people think.
Pullback, breakout, EMA reclaim, intraday pivot reclaim… I don’t really care as long as:
1. the stock is a leader
2. the group is acting well
3. risk is tight
4. upside asymmetry is there
That’s the process.
Screen → stalk → refine → execute.
Most people overcomplicate trading because they’re trying to force random trades. I’m trying to do the opposite:
Reduce the market down to a small list of elite names, then patiently wait for opportunities where risk can be clearly defined.
The hard part isn’t finding stocks anymore.
The hard part is having the patience to wait for YOUR setup inside the right names.
Read the Market Wizards chapter on Kristjan Kullamägi this weekend. The one section that really stood out was when he discussed his drawdown off of his 2021 peak.
"I started 2020 with $3.5 million and ended the year at $36 million. It was a thousand percent year. Then I ran that $36 million to a high of $105 million, and the last portion of that move from $65 to $105 million occurred in just a month and a half. For a brief period, just a few days, I was over $100 million. You have to understand what that did to my psyche. It made me feel completely detached from reality. I thought, “I’m going to get to $200 million in six months.” I was completely sure of that. I started seeing trading as a video game, which I kept winning.
Measured from my $105 million peak in November 2021 to my mid-2022 low, I lost approximately $60 million. About half of that loss represented the late 2021 retracement of the large open profits at the November peak to the stops on those positions. The initial retracement loss was so large because I was leveraged long at my peak. My long exposure was $150 million—a number I recall because I remember bragging about it to a friend"
These boom and bust type tales are as old as time. Look at Jessie Livermore as the classic example. Net worth of $0 in 1906 to a peak of $1.6 billion (inflation adjusted to 2021 dollars) in 1929. Just 5 years later he blew up and owed $104 million dollars to his brokers...
Or look at Paul Tudor Jones. Hit one of the most legendary trades in history, making roughly $200 million dollars during the 1987 crash. It cemented him as a legend. His mental coach Tony Robbins said that Jones consistently lost money for the next 4 years after that peak.
Dan Zanger parlayed $10,000 into $42 million during the late 90's. Then in late 2000 he took a 70% drawdown when he was 200% long 3-4 fiber optic stocks as the dot-com bubble was popping.
Charles Harris reached 8-figures status after he ran up his account over 4,000% from 2020-21, then experienced a -80% drawdown, mostly due to his big TSLA bet in 2021-2022.
I have seen a few people speculating on Kristjans story from the outside. Saying "I would have stopped trading at $100 million" or "I would have just taken that money and started investing". To those people I ask if you have ever experienced a real euphoric run in your trading account, let alone turning 5k into 100mil? Extreme winning streaks like the ones above breed overwhelming euphoria and overconfidence. The mind shifts its focus from process to outcomes, with ego-driven decisions overriding risk parameters and rules. From my experience I have found it near impossible to be aware of this at the peak of the run. It is almost like you are blacked out and the greed/ego completely takes over your trading.
Then the drawdown begins. The emotions shift from euphoria and greed to revenge, fear, and doubt. This is where things can really start to spiral out of control. It is only after the drawdown has run its course that you finally come back to your senses and your emotions drift back towards baseline levels. Then all you're left with is regret...
Few people ever talk about what a big winning streak can do to you. It can literally change the way you think and operate. Often the ability to achieve super returns is also its biggest drawback—a true double-edged sword. To be able to conquer both sides is the holy grail...
From the Hour Between Dog and Wolf by John Coates:
"When traders enjoy an extended winning streak they experience a high that is powerfully narcotic. This feeling, as overwhelming as passionate desire or wall-banging anger, is very difficult to control. Any trader knows the feeling, and we all fear its consequences. Under its influence we tend to feel invincible, and put on such stupid trades, in such large size, that we end up losing more money on them than we made on the winning streak in the first place. It has to be understood that traders on a roll are traders under the influence of a drug that has the power to transform them into different people."
By Popular Demand: Spreadsheet Tutorial for Creating Your Own FREE Relative Strength Histogram (Both Stock and ETF), that Updates Daily After Close.
As requested by many of you, I will do my best to break down the steps and details so you can build your own RS tracking list of stocks, along with sector and industry group ETFs.
For reference to my ETF listings (my preference is Equal Weight listings, which take precedence over cap-weighted ETFs, eg. XSD over. SMH), please refer to the post below.
https://t.co/EQAkOqYK8o
My stock selection "cheat sheet" is honestly very simple.
I mentioned that I’m not trying to trade every chart that looks decent. I’m trying to trade the names where multiple layers of probability are lined up at once. The easier I can make the selection, the easier execution becomes.
That means I’m always judging three things first:
- The stock itself
- The group/sector it lives in
- Its relative strength vs the overall market
If those three align, that’s where I get aggressive.
1. Strong name + Strong group + RS > market = Primary Focus
This is where most of my money is made.
If the stock is acting well, the sector is leading, and it’s outperforming the market, that immediately goes to the top of my list. These are the names institutions usually keep supporting on pullbacks!
Think names like $ARM when semis are hot, or $WULF when data centers/power themes are moving.
That’s where I’m looking for:
> Weekly breakouts
> Pullbacks into the 9/21 EMA
> Tight consolidations
> 15/30 min sniper entries
This is where I press when conditions are good.
2. Weak name + Strong group + RS > market = Watchlist
This one is underrated.
Sometimes the group is strong, but an individual name hasn’t gone yet. It may look sloppy, be basing, or still digesting prior gains. Those are names I keep close because laggards can quickly become leaders once money rotates.
I’m not forcing entries there yet, but I’m watching for similar action...
- Tightening price action
- EMA reclaims
- Volume anomalies
- Character changes
Ex: $ONDS is one I'm currently watching, clearly not a leader making new highs every day, but one worth watching!
Half of my trades come from names that were “boring” for two weeks and then exploded once they woke up.
3. Strong name + Weak group = Smaller Size/Tactical Only
Yes, some stocks can outperform weak groups for a while. But if the tide is going out, I’m more cautious. I may trade it tactically, but I’m not treating it like an A+ setup.
I know the group pressure can eventually catch up.
I’d rather size big with the wind at my back than fight current for scraps.
4. Weak name + Weak group + weaker than market = Don’t Touch.
This is the easiest filter in trading.
If the stock is weak, the group is weak, and it’s underperforming the market… why am I wasting mental energy there?
Too many traders spend hours trying to bottom fish garbage.
I’d rather spend that time studying leadership,because if my focus is there, then there is no shortage of opportunity.
I’m flipping through charts asking simple questions:
- Where is the money rotating right now?
- Which sectors are waking up?
- Which names refuse to go down?
- Which pullbacks are getting bought?
- Which stocks are tightening near highs?
That narrows everything fast.
Then I wait for entries.
The goal is to put myself in names where...
1) Demand is obvious
2) Risk is definable
3) Momentum can expand
4) Institutions are likely involved
That’s why I preach trade with the tide, not against it.
At the end of the day, the majority of the money you make is whether you can manage risk in the right stock! And you don’t need the perfect chart.
You need the right stock, in the right group, at the right time!
I hope this helps with how I think through things :))
I don't post much here but I spent years keeping a trading journal, not the kind with entry prices and stop losses, but the kind where you write things down at 2am after a bad week. Now I put it together for boom and bust traders.
Maybe it helps someone.
https://t.co/KVHRFY8j6o