@jimhenryblogger of @Forbes interviews our own @MartinOnTraffic > https://t.co/Nmu9x2SmDv
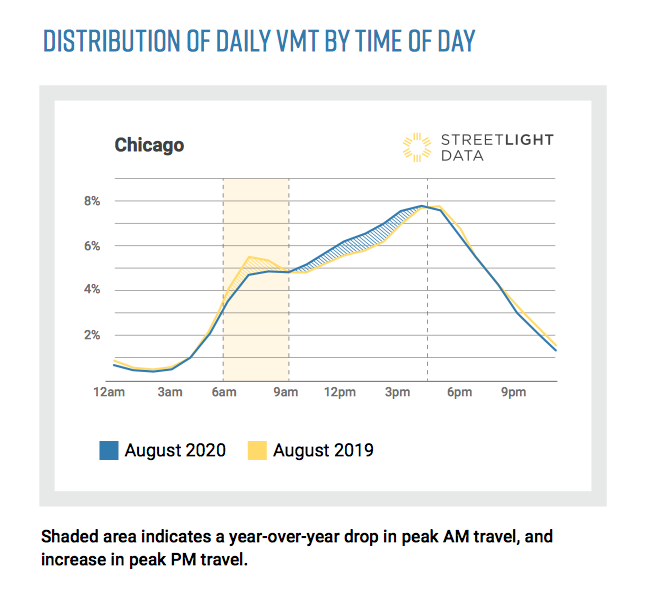
As % of weekday traffic, rush hours in US metros account for less traffic than pre #COVID; the rest of the day accounts for more. Big change for ##highway & #urbanplanning if it persists.
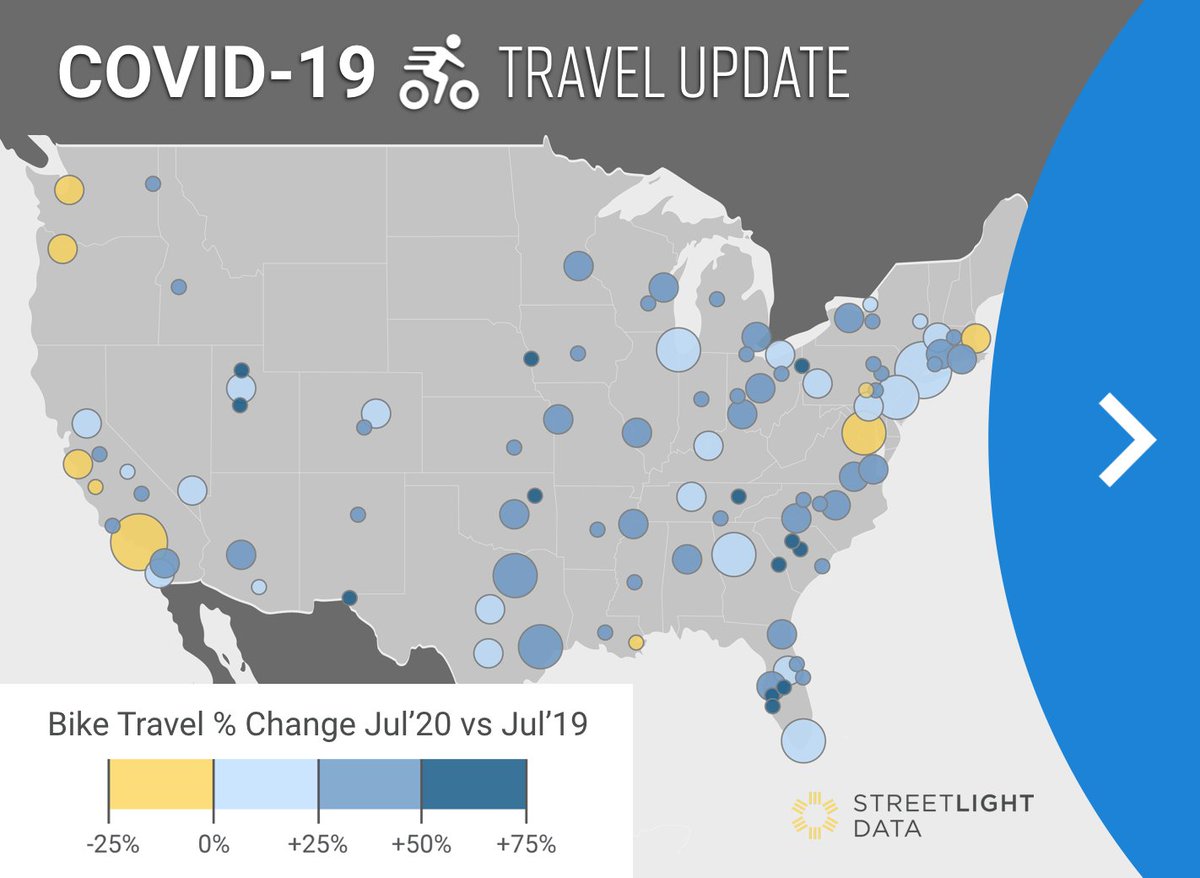
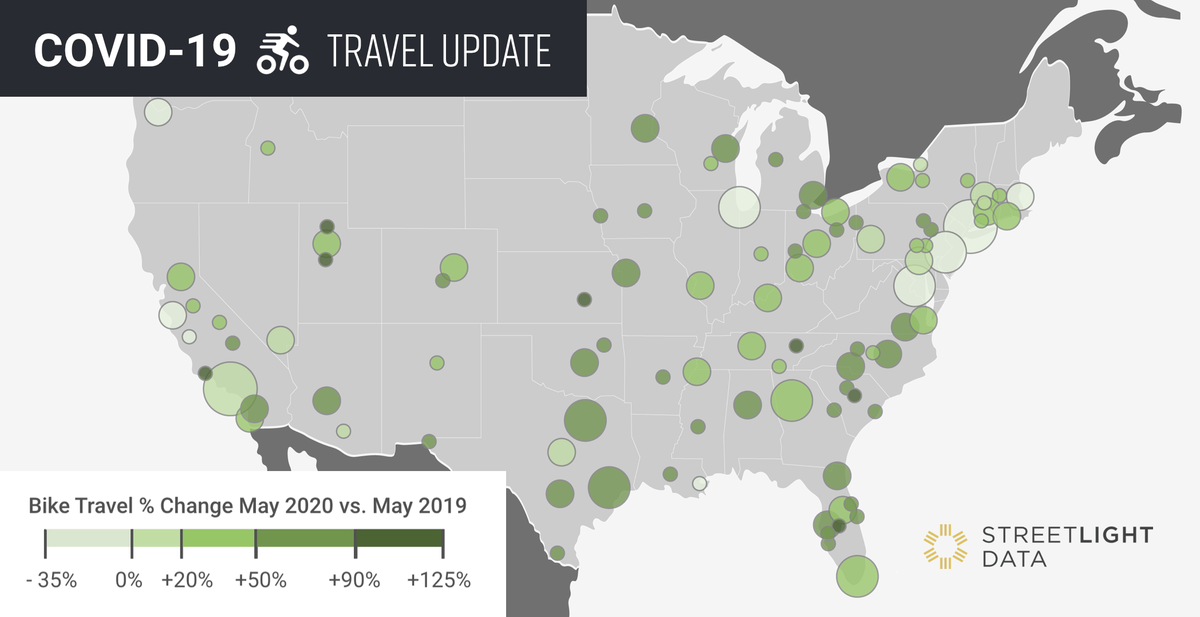
🚲The next COVID-19 #bike update is in! Download the #COVID E-BOOK for a full analysis of U.S. #vehicular and
#bicycling trends:
https://t.co/OO01cMgmsC
Six months into the COVID pandemic, our roads and bike lanes continue to be anything but “normal.” Our team crunched the latest numbers on VMT, congestion, bicycle activity, and more to help you understand and navigate 2020’s transportation volatility: https://t.co/6KLz2wfaWI
Today's @business#BloombergGreen "Most of this increase likely came at the expense of public transit, which has yet to recover to pre #COVID. #Bikeshare operators like @limebike and @BlueBikeSC both stand to benefit if demand holds up. @StreetLightData: https://t.co/OWlKd3ntHP
Is telecommuting here to stay? How would it affect urban freeway expansions? What about effects on transit and the environment? Our friends at @SmartTransp explored these questions and more, using data from our VMT Monitor.
Read their full analysis: https://t.co/6ATLvcBolj
You know bicycling has increased during COVID. But do you know who is riding, where they're going, and why?
Our bike expert breaks it down: https://t.co/dDVRRvwcOe
VC Daily: Investors Eye Seattle; Data-Analytics Funding Stays Up Amid Pandemic; Clearlake Raises New Fund https://t.co/iiyqDREEjU via @WSJ#transportationData for #newMobility and all mobility helping keep your DOT and city moving amid #COVID19
We enjoyed the lively conversation @Cailin! Whatever used to be the conventional view of how how our cities moved on average, has gone out the door with COVID.
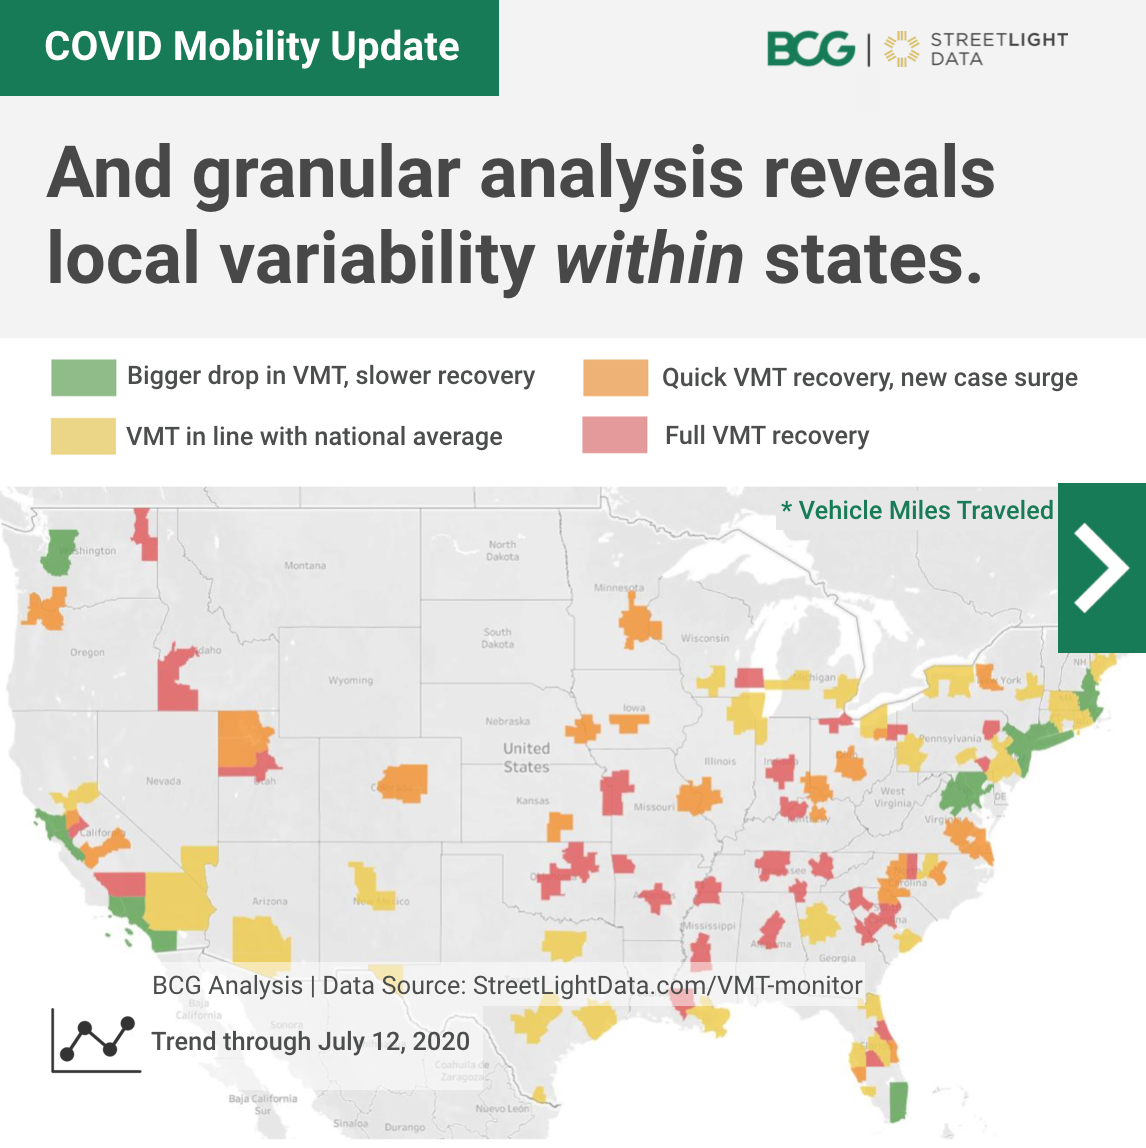
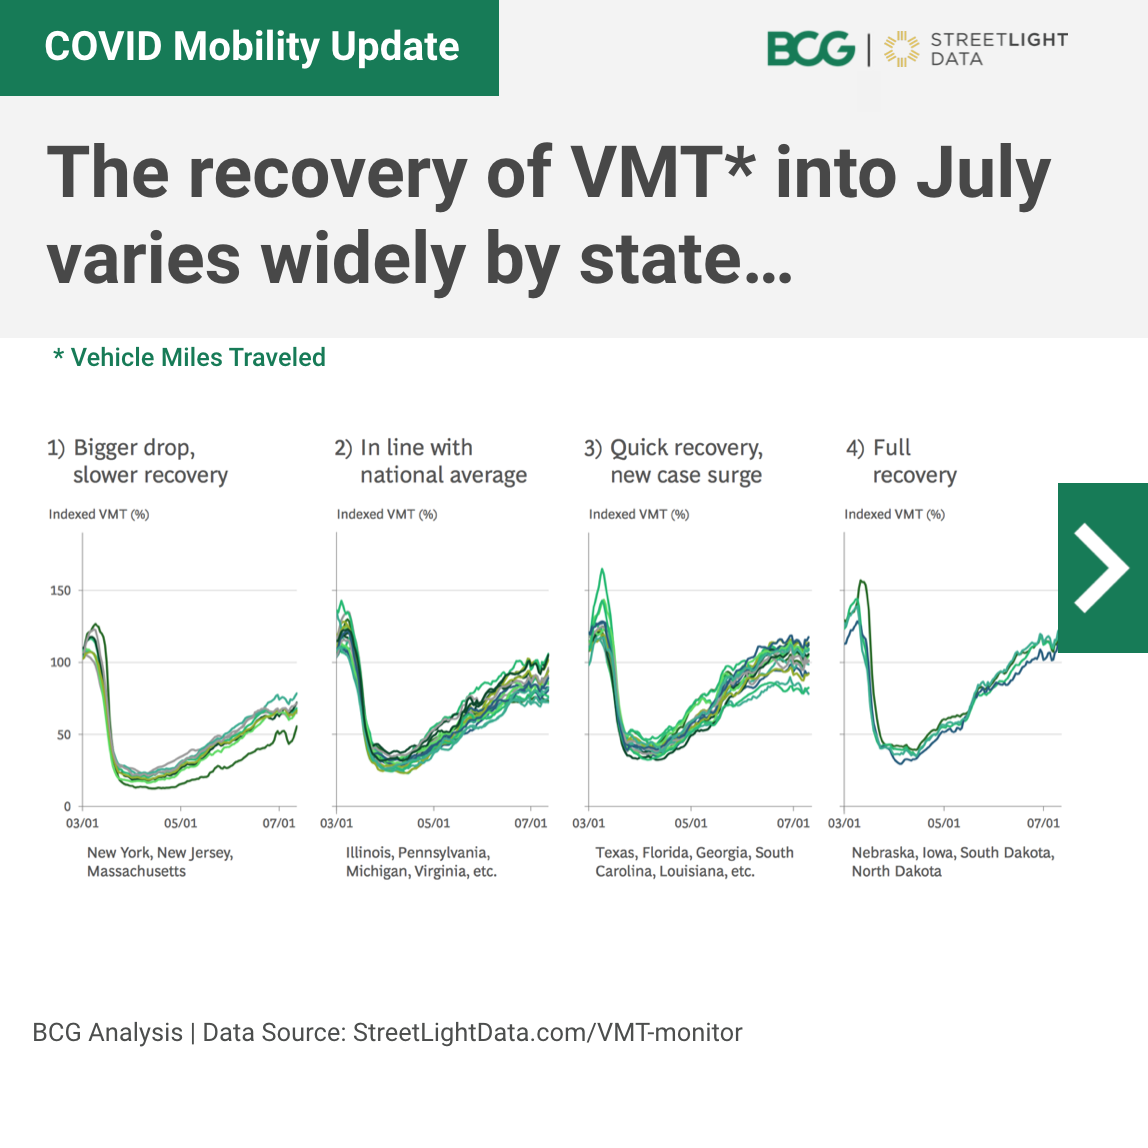
How much is COVID-19 affecting transportation in your community? Learn from @BCG's Trip Reduction Index, which analyzes COVID's impact on VMT, correlating factors like income + population density, and more.
🎦 August 13th, 11 AM PT / 2 PM ET
💻 Register: https://t.co/S9HYwqoFQv
Insightful analysis from Augustin Wegscheider and the #mobilty team at @BCG. Read more on our blog at https://t.co/Z7S9XB2Oi1
Follow us for details on the upcoming webinar to dive deeper into demographics and other factors shaping the #COVID19#traffic recovery.
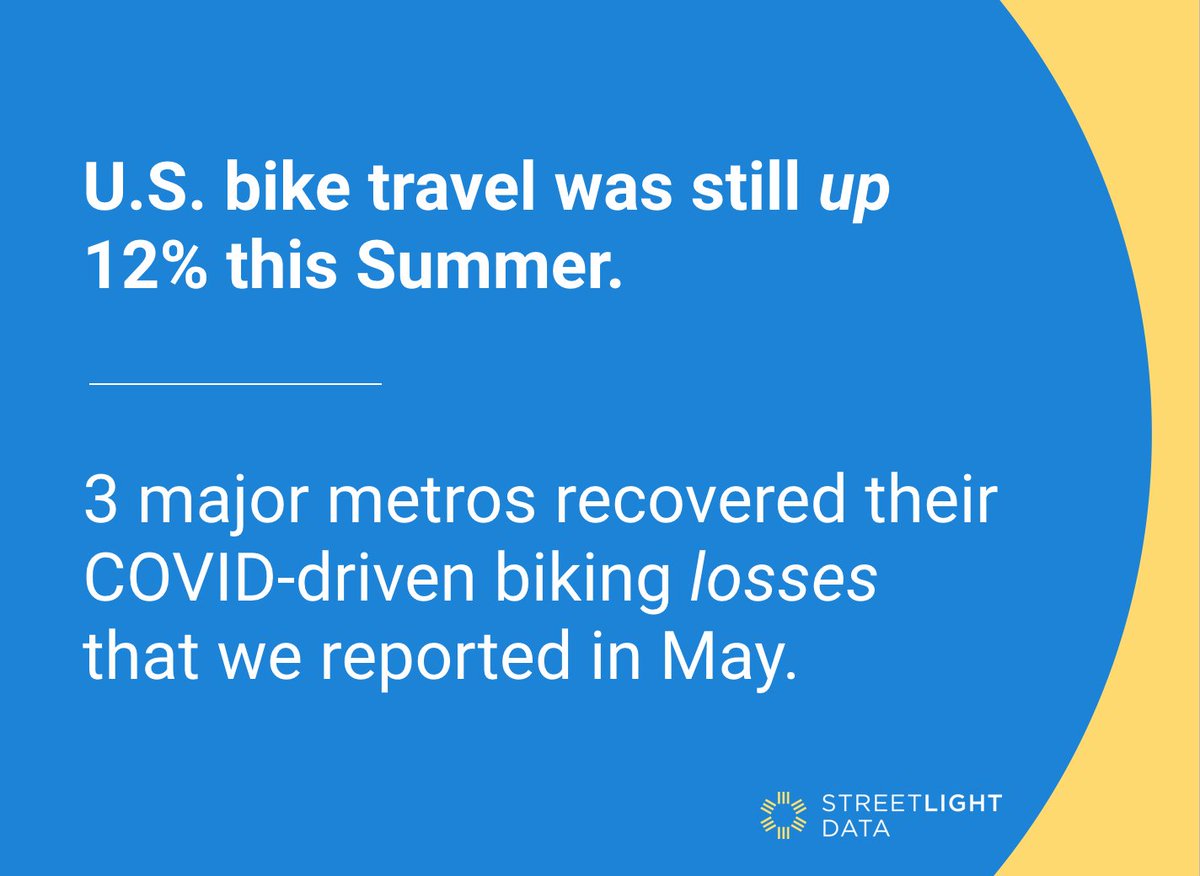
🚲 COVID-19 bike data is in! 🚲
We all know COVID-19 has led to decreased VMT. But what about bicycle miles traveled? We crunched the numbers, and the results surprised us. Learn how we tracked these changes from home: https://t.co/A0Q09GHVN8
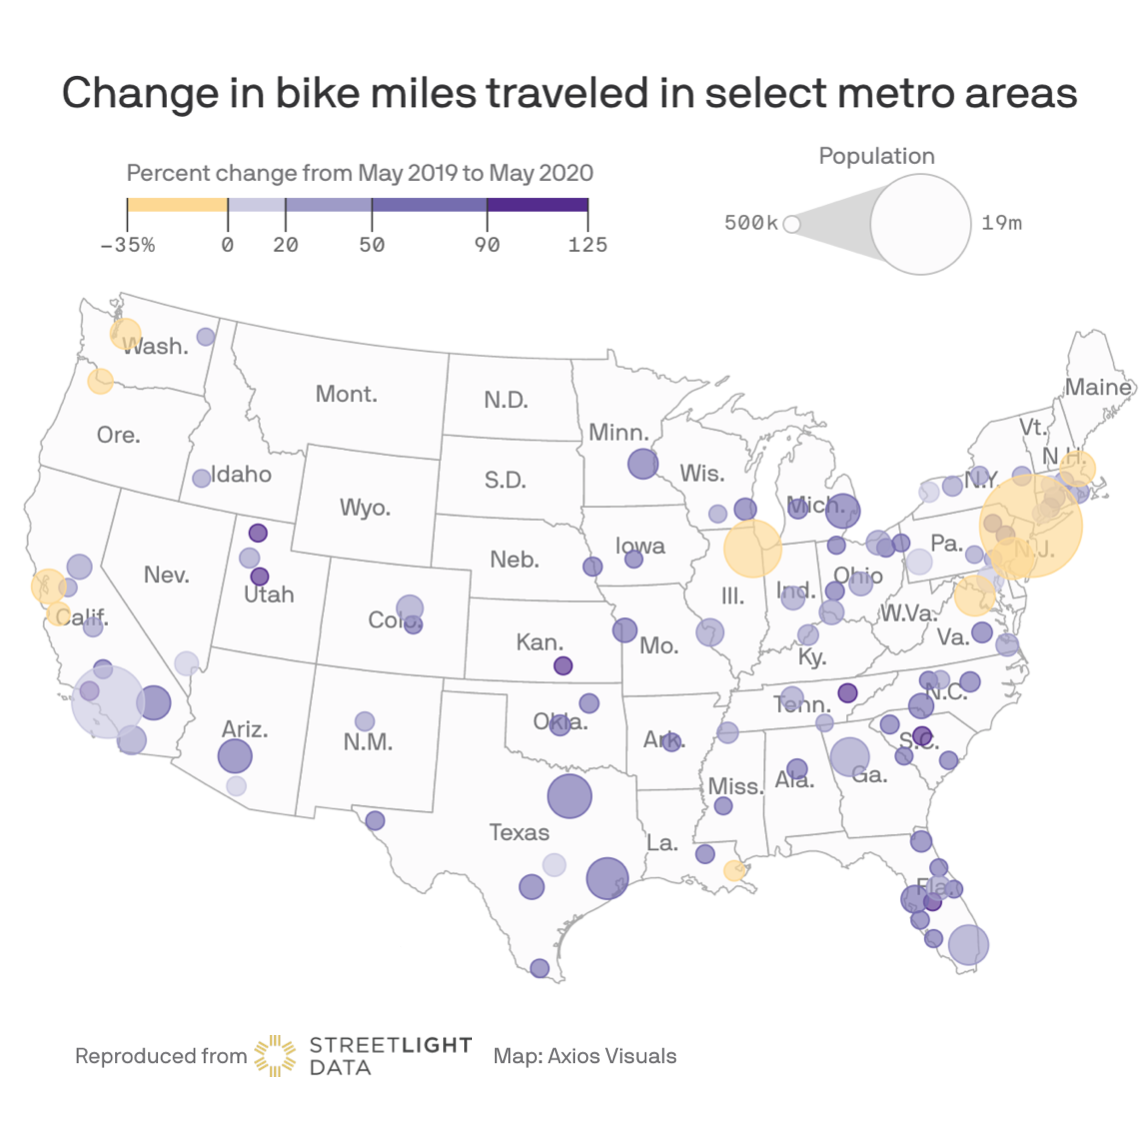
#Biking is ⬆ in 90% of U.S. MSAs. Where’s it’s ⬇ might surprise you: SF, NY, DC.. I enjoyed sitting down with @AmyAHarder of @Axios to talk #bikeData hope you enjoy the article
SHARE this article https://t.co/n66h6VyPO5 to make the case for permanent #bikeLanes with your city!
When travel is anything but “normal,” and many of us are still working from home, it can be challenging to collect meaningful transportation metrics. Luckily, big data makes it easy — learn how on our webinar.
🗓️ July 30, 11 AM PT / 2 PM ET
🎦 Register: https://t.co/KuOkqJtt2Z
July has shown commuters are hitting the road again — but instead of buses and trains, they’re opting for single-passenger vehicles. Could traffic get worse post-pandemic? @bloomberglaw's @amenasaiyid investigated trends heavily impacted by the pandemic: https://t.co/QkLdEt7uJN
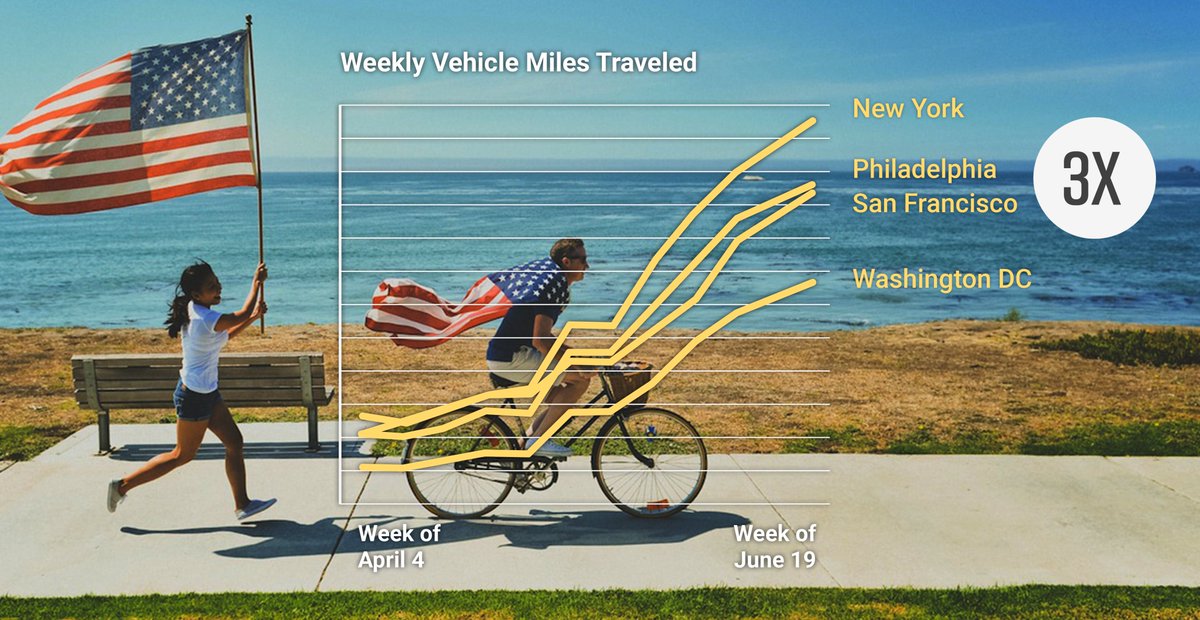
Shelter-in-place across the US may have helped drive record bike and pedestrian activity, but vehicle miles are on the rise. Weekly #VMT heading into July is 3X what it was in early April in four US metros — and up nearly 100% since June 1.
Learn more at https://t.co/1jzKyO6ASr
CLIMATE CALCULATOR: https://t.co/NnCI5y8EjK
COVID-19 brought us fewer cars and a cleaner, less polluted environment. What if your city took steps to keep 10% of those cars off the road permanently? 20%?
Use our calculator to find out.
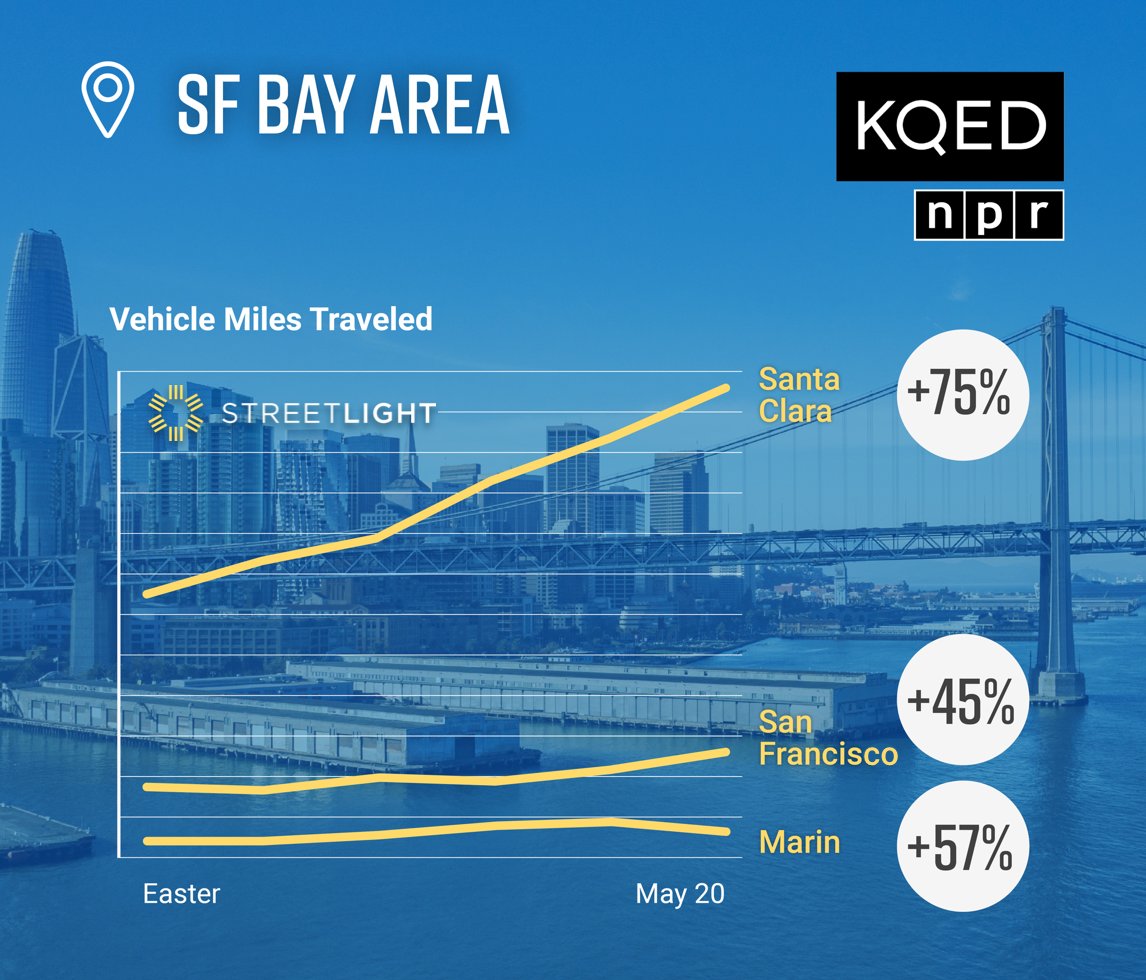
@KQED: Traffic Is Still Way Down Across the Bay Area — But It's Making a Comeback. How about dense @SFgov vs suburbs vs vast #SiliconValley?
We’re delighted to power @danbrekke's analysis of the 9 Bay Area Counties: https://t.co/fNexYJjjPH
#VMT data: https://t.co/Jc05yGY9SC