Video Walkthrough of My Daily Process: How I merge my Finviz screener, TradingView watchlists, and a 'Compression' screener to generate stalk & focused ideas.
Here’s a quick walkthrough of how I generate my stalk/focused ideas—also shared exclusively with my X subscribers through a daily pre-market tweet condensed into a 5-minute reference.
A breakdown of the process;
1. Tradingview as my based charting and watchlist management platform. It is tile next to my finviz web browser.
2. I have 13 preset screeners across both platforms , 9 in finviz (post-market to watchlist), 4 in tradingview (watchlist compression, pre-market gapper of stock & etf, watchlist RVOL sorted). Details of each screener are shared in Chapter 3 of https://t.co/0F5tgGM49z. You can also get direct Shared Screen access from https://t.co/LXC2VSQzZL
3. I copy each screened result from Finviz and paste it into its corresponding TradingView watchlist (e.g., “Hottest Stock” results go into the “Hottest Stock” watchlist). @erikcarell has built a Finviz API workaround that lets you import an entire screen directly into a TradingView watchlist.
https://t.co/SNpaYqObaz
4. Screened results aren’t usually actionable on their own, so I add an extra layer— “compression” screener within TradingView—and run it through each dedicated watchlist. This is what I refer to as a “screen within a screen.” My watchlists are color-coded to show which screener each stock came from—and to highlight when a name appears across multiple screeners (e.g.,🔴= Hottest Stock).
5. I review each name that passes the “compression” screener, evaluating them one by one on the chart to determine whether they qualify for my stalk/focused idea watchlist. The criteria I use are outlined in my “15 Hard Rules” in Chapter 6. https://t.co/0F5tgGM49z.
6. The same process is then applied at the ETF level, since TradingView separates its Stock and ETF screeners into two different sections.
7. On top of that, I manually review over 160 ETFs to track day-by-day price action/RS across industry groups (not shown in the video). The full workflow—including post-market study—takes at least 2 hours per session. The process flows as follows: Screening → Watchlist Management → Focus List Rebuild & Preparation → Qualitative Market Reading for Situational Awareness → Portfolio Stop Management (when needed).
No single screener will ever capture every opportunity.
To stay ahead of the market, you need unwavering dedication, discipline, and consistency. Eventually, the market rewards that effort with the strong, or trending moves. But first, you need a strategy and process that fits your lifestyle and is sustainable over the long term.
I hope you all find this helpful as we navigate this challenging yet financially rewarding journey.
📣 Heads up: a major overhaul of my Volume Pocket Pivots indicator drops this weekend.
The full write-up is out now — every new feature + how I trade it 👇
A YouTube deep-dive on the enhancements is coming too.
I think this is an important point that many new traders need to understand.....We sometimes easily say :
''You need 10-15 good/outlier trades to have a great year''
.....But how hard is it to actually capture them?
Below are some of my realizations over the past 5 years and what I truly mean when I say :
''You must surround yourself with assets where asymmetry or outlier potential can emerge more easily and naturally.''
For years into trading I had the following mindset: ''Filter your universe of stocks with some simple rules that and then focus on the stocks that look strong and the BEST setups.''
That worked nicely and still works nicely in certain windows per year where opportunities are all over the place and everything you touch turns into gold.
But these are small windows within each year.
So what do you do the rest of the months when only selective assets work and most of the universe isn't moving? Are you still executing on great setups? Because this leads to extreme frequency of trades and possible deterioration of your capital.
The other issue I had with that mindset was that without knowing anything about companies ( since I was looking only at price as a guiding factor) , I lacked that conviction element to hit the button big when it was needed. So naturally I was missing out on some moves just because I had nothing else to back up my conviction other than price. Trust issues.
Another problem I also figured out as I studied more was that amazing opportunities didn't emerge always from perfect ''setups''. They just went straight up from setups I would classify as 3*/5 or 2.5*/5......So I thought:
''is focusing on the best setups limiting my opportunity potential? Maybe...''
The other issue I also had was that out of 5K stocks available there are at least ~300 of them that look quite good based on prior price action moves, at any given point in time, and on certain occasions provide ''nice setups''....
So what, am I going to trade all of them when they show some linearity and a 5* setup?
<<We are always limited by time, by how many assets we can hold in our portfolio, and by our frequency.>>
You have to remember that even if you track 800 different stocks over the span of a year as a result of your selection filters , where the list sits around 300-400 at any given snapshot of time......due to frequency and portfolio allocation constraints you can't execute trades in all of them.
So what happens in reality is the following:
If you execute let's say 60 trades per month (your average frequency) and you track a list of 300 stocks, you can essentially attempt on 20% of that universe in any given month.....Essentially you are covering the potential of 20% of that territory..... And how many stocks out of that 20% territory captured by your execution attempts actually have the chance to be outliers?
If you're executing only on great setups within that list of 300 tickers, then it's kind of random whether an outlier will emerge in that 20% coverage you have.
A lot of people might say ''man.... I had $SNDK, $AXTI, $LWLG, $MU etc. on my universe list , why didn't I trade them?''
For many people the reality is that the universe was too big relative to their frequency to potentially trade them, because other opportunities emerged first and didn't materialize.
<<Your frequency relative to the universe you're tracking needs to have a strong overlap.>>
But here is where overfitting starts to spiral....
Because you can attempt to shrink down your universe (e.x from 400 to 50) by butchering your outlier potential, or you can shrink it WHILE carrying the essence of that outlier chance with you.....This is the whole game essentially.... I'll explain:
What butchering your outlier potential means:
For example, some people in their attempts to shrink down the universe put filters to only trade or surface stocks with let's say amazing fundamentals....That's not wrong, because ''usually'' for long term moves great fundamentals need to emerge....BUT IS it universal on all great moves???? The markets show that huge opportunities emerge even without any fundamentals (e.g. $OKLO, $LWLG, $AXTI recently etc.)
So if you put ''great fundamentals'' as a filter to go from 400 stocks down to 50, then you might be shrinking down the outlier potential as well.....
The filters used by traders are many, and each filter you add if you haven't deeply explored it's ripple effects has the potential to heavily exclude phenomena that the market has proven to reward......which essentially means...shrinking your outlier potential in the process. A hole in the water....
There's a reason only a few great traders exist and a lot of average ones.....Because the great traders , through studying, through experience, through observation of past historical opportunities are able shrink down their universe to align it with their frequency, WHILE simultaneously carrying over a large portion of the outlier potential the original ~400 stock list had.
And that's the HARD part. Because you TRULY succeed when you go from 400 stocks down to e.x 50 without losing many of the potential outliers in the process.
Think about it this way.... if 20 tickers out of those initial 400 were going to make a massive move, that's only 5% of the whole initial universe. Now if you shrink down to 50 and still have 10 of those sitting in your new list, your outlier chance just jumped to 20%. That's the whole game right there.......
......That's how you truly increase your outlier chance and position yourself in places where ASYMMETRY can emerge more easily.
And this is where I've focused my work in recent years. We know that great moves can happen because of themes alone, stories, catalysts, great fundamentals, or combinations of all of them. How can you mix all of those elegantly in order to shrink the universe without overfitting, while still carrying a higher outlier potential?
And this is where the phrase I use becomes evident: ''phenomena > setups.'' If, based on historical observations, you create good combinations of behavioral, fundamental, and technical factors, each with their respective weight, the bigger the chance you carry larger chunks of that outlier potential during the universe shrinking process....The more you carry the better your year will be.
<<You can never predict what's going to happen in the markets....only place yourself in places where great opportunities emerge more easily or randomly.>>
A lot of food for thought, but it's a good exercise for many to understand why trading is EASY and yet so damn HARD at the same time.....
This is 1 of the main screeners I use every single week to track the strongest names in the market & exactly how I use it:
Nothing fancy, just a process that helps me consistently narrow down where institutions are already putting money to work.
The goal of this screener is simple:
Find stocks with momentum, liquidity, relative strength, and enough volatility to actually produce meaningful asymmetric opportunities.
Here’s what I’m filtering for and why it matters:
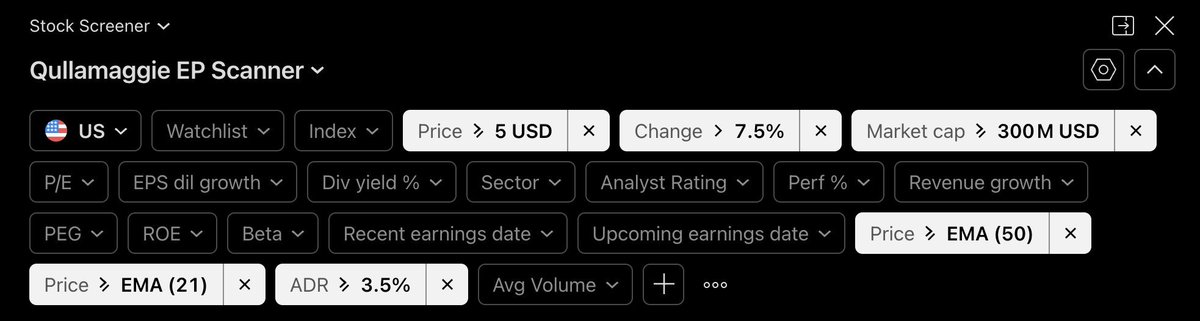
1) Price > $10
Avoids illiquid garbage and low-quality names.
2) ADR > 4%
I want names that MOVE. If a stock only moves 1–2% a day, it’s usually not worth my attention for my style.
3) Price above 52W low by 70%+
I want names already proving strength, not dead stocks trying to “bottom.”
4) Price x Volume > 10M
Liquidity is very important. I want real participation.
5) EMA 9 > EMA 21
Short-term momentum confirmation.
6) Price > 50EMA
I want names above important trend structure, not fighting underneath it.
This screener is where the research begins.
Once I have my names, I manually go through charts one by one and ask:
* Is this a leading stock in a leading group?
* Is volume confirming the move?
* Is this extended or still early?
* Is there a multi-month base forming?
* Is relative strength improving vs the market?
* Is there a narrative institutions can pile into?
That’s where names like $ARM, $MU, $DOCN, $WULF, $APLD, $INTC, etc first started grabbing my attention.
Then the watchlist process begins.
I’m usually not buying the second I find the stock. Most of the time I’m stalking it for days or weeks waiting for the right structure to appear. I’ll track:
> pullbacks into the 9/21EMA
> tight consolidations
> volume drying up
> higher lows forming
> failed breakdowns/U&Rs
> relative strength on red market days
This is where the nuance comes in.
A beginner sees “a stock going up.”
I’m trying to identify whether institutions are accumulating, whether supply is drying up, whether the stock is tightening before expansion, whether the group is strengthening, etc...
Once all those layers line up, THEN I focus on execution.
And honestly… the entry tactic matters less than most people think.
Pullback, breakout, EMA reclaim, intraday pivot reclaim… I don’t really care as long as:
1. the stock is a leader
2. the group is acting well
3. risk is tight
4. upside asymmetry is there
That’s the process.
Screen → stalk → refine → execute.
Most people overcomplicate trading because they’re trying to force random trades. I’m trying to do the opposite:
Reduce the market down to a small list of elite names, then patiently wait for opportunities where risk can be clearly defined.
The hard part isn’t finding stocks anymore.
The hard part is having the patience to wait for YOUR setup inside the right names.
This is the @Qullamaggie EP Scanner I used to find stocks weeks ago, like $CRWV, $AAOI, $LWLG, $ALAB.
-create WL
-add names
-track names
-trade
...repeat!
Great tool for surfacing names showing early momentum + institutional interest!
I've attached it below for reference:
I see a lot of newer traders obsessing over entry tactics as if they're the holy grail of trading success.
and I completely understand why, because when I was starting out, entries felt like the most tangible thing I could control and perfect.
I would see someone post an ORH breakout that worked beautifully, or a VWAP reclaim that led to a massive winner, and I thought to myself:
"If I can just master that specific entry, I'll be profitable."
so I spent months backtesting opening range breakouts, studying pivot reclaims, trailing moving averages, and perfecting my execution down to the second.
...but what I wish someone had told me when I was going through that phase is that if I had focused on tracking where the money was actually going (aka):
which sectors institutional buying was rotating to
which themes had institutional sponsorship
which names were showing relative strength
I would have progressed exponentially faster than I did, trying to perfect my entry timing.
What I learned is that if you're already looking in the right place, if you're trading the leading names in the hottest themes with the wind at your back, it rarely matters if you enter in the morning, midday, or afternoon.
I can't tell you how many times I've seen the ugliest chart you can imagine work beautifully in a strong market with a hot theme behind it.
While the perfect textbook setup in a weak environment or a dead sector goes absolutely nowhere and chops you up for weeks.
I always ask myself:
Would I rather have the cleanest entry on a stock that nobody cares about in a sector that's bleeding, or would you rather have a sloppy entry on a leading name in a theme that's ripping with volume and institutional buying?
The answer is obvious when you put it like that, but so many traders, including my younger self, get it backwards because we're conditioned to think that precision is the same thing as edge.
Early in my journey, I fell into this exact trap where I was trying to copy entries exactly as I saw them online (buy the ORH, stop at LOD, trail with the 9 EMA) and sometimes it worked, and when it did I thought I'd finally cracked the code and figured out the secret.
...but more often than not, the trades failed, and I couldn't explain why.
because the problem wasn't the tactic itself but rather that I didn't understand when and why that tactic should be used in the first place.
I was copying outcomes without copying the thinking that led to those outcomes, and that's a recipe for frustration and inconsistency because you're essentially flying blind and hoping that if you just execute the mechanics perfectly, the results will follow.
What most people miss is that entry tactics are simply tools, not strategies, and an ORB works best in a strong environment with expanding breadth and real momentum carrying names higher, while a VWAP reclaim is powerful when it aligns with higher timeframe structure and real institutional participation behind the move, etc.
Recently, for example, undercuts and reclaim entries on the daily off moving averages have been working incredibly well in this environment.
...where back in September through November, buying ORB breakouts was far more effective than buying undercuts because the market was in a different phase with different characteristics.
The work that rarely gets shown and that nobody wants to talk about happens before the entry, and it's understanding the environment:
Is the market trending or choppy?
Are we in expansion or contraction?
Are leaders behaving well or distributing?
Is volatility supportive of momentum trades or mean reversion?
These are the questions that dictate which entry tactic even makes sense, because the same ORB that works great in a trending tape will destroy you in a range-bound one, and if you don't understand that context, you'll keep blaming your execution when the real issue is that you're using the wrong tool for the wrong job.
Here's what I would tell my younger self if I could go back:
Focus on entry tactics second.
First, focus on finding relative strength, identifying sector rotations, and trading the names that have the wind at their back first.
because if you're in the right place at the right time, the entry becomes almost irrelevant.
I also would ask myself:
Would you rather be the trader who has perfect entries but is constantly fighting against weak sectors and dying themes, or would you rather be the trader who has average entries but is trading the leading names in the sectors where all the money is flowing?
I know which one I'd rather be, because I've been both, and I can tell you from experience that trading with the money is infinitely easier than trying to pick pennies off the floor in sectors that nobody cares about.
There's also a psychological layer that gets ignored when people fixate on entries, which is that conviction doesn't come from memorizing a rule or copying someone else's tactic... it comes from earning trust in a process through repetition, through studying hundreds of charts, taking trades, reviewing them honestly, and refining what works for your specific tendencies and edge.
Until you do that work, you won't know when to press, when to pass, or when to cut quickly, and you'll hesitate and override your rules at the worst possible moments.
and this isn't because you're undisciplined but because you lack the conviction that only comes from screen time and personalizing your system.
So if you're a beginner or intermediate trader and you're still obsessing over whether you should buy the ORH or wait for the VWAP reclaim, I'd encourage you to zoom out and ask yourself a bigger question:
am I even looking in the right place?
because if you're trading the right themes,
the right sectors,
and the right names with relative strength,
the entry becomes a detail, not the deciding factor.
and that shift in perspective is what helped me go from spinning my wheels perfecting mechanics, to someone who can actually pull money out of the markets consistently.
21EMA Scan for Pine Screener
This indicator is designed exclusively for Pine Screener.
Because of that, nothing will be displayed even if you add it to a chart.
Please add it to your favorites and then remove it from the chart.
Code (documentation in Japanese)
https://t.co/zVY5W9iPBk
What is Pine Screener?
Pine Screener is a tool that allows you to screen stocks using indicators—something that isn’t possible with TradingView’s standard built-in screener.
However, since Pine Screener is currently in beta, it cannot scan all symbols.
This means you need to create your own watchlist first.
Below, I’ll walk through my workflow and the required steps.
Step 1: Create a Watchlist
First, use the following URL to add tickers to a list:
https://t.co/TIEyxAFGXl
This list is based on my personal criteria, so feel free to customize it to your needs.
Note that each watchlist can contain up to 1,000 tickers.
Use the Shift key to select all tickers, then right-click to add them to a watchlist.
Step 2: Open Pine Screener
Next, open Pine Screener.
Since it’s not yet fully integrated into TradingView, it needs to be opened in a separate window:
https://t.co/I9b0lvZyUF
Step 3: Configure Pine Screener
As shown in the attached image:
・Select the watchlist you just created (far left)
・Set the indicator to 21EMA Scan for Pine Screener
・Configure the conditions as shown in the image
・Click the Scan button
Most of the conditions use the Between operator.
Once the scan runs, tickers that meet the conditions will be displayed.
Step 4: Refine the Results
From there, you can further narrow down the list by adding conditions such as Relative Strength or RS Rating.
Also, it’s an effective approach to run the screener using a watchlist you’ve already created.
Final Thoughts
I’m still exploring more effective ways to use Pine Screener, but for now, it meets my personal requirements and I’m satisfied with the setup.
That said, having to manually create lists and open Pine Screener in a separate window is somewhat inconvenient.
I’m looking forward to seeing how the official version will be implemented in the future. @tradingview
How did Oliver Kell post a +941% return and win the U.S. Investing Championship? By following ten simple principles without exception.
This guide breaks them down:
・Portfolio Management Spreadsheet
This tool is a portfolio management spreadsheet that uses ATR (Average True Range).
https://t.co/okOHy1Lla4
・TradingView my scripts page
https://t.co/hqqGQ4tj0D
- 5ma + O’Neil & Minervini Buy Condition
This indicator features five customizable MAs (SMA, EMA, WMA, VWMA) for flexible multi-timeframe analysis.
It combines O’Neil and Minervini’s buy conditions, displaying both separate and unified signals visually.
https://t.co/1yX8O4VbdU
- Darvas Lines/Box
This indicator is designed to identify clear consolidation ranges and detect decisive breakouts with precision.
It automatically draws and adjusts the ranges, featuring Advanced Retest Confirmation and customizable alert conditions to deliver reliable signals for tracking and trading trend continuations.
https://t.co/VbLlnvtAOi
- Position Size Calculator
This indicator automatically calculates and displays the optimal position size, stop price, and maximum loss amount.
It offers two stop-loss modes: a fixed-percentage mode and an ATR-based mode that adapts to market volatility.
https://t.co/YikjnAerhm
・Others
I share my non-public TradingView indicators, trading methods, and screening strategies on note (articles are in Japanese).
https://t.co/bUETAomRlO
@SteveDJacobs Here it is. If you like it, feel free to use and publish it without referring to me, no copyrights! (I wrote most of the code with a little help from ChatGPT)
Qullamaggie Screener – Explained
The “Qullamaggie Screener” shared in posts on X was inspired by the website and Twitch streams of @Qullamaggie .
For anyone unfamiliar, I recommend reading about his strategies directly on Kristjan's webpage and watching some of his streams (both linked below):
https://t.co/hy2jZlwSF1
https://t.co/58k8P2lmbX
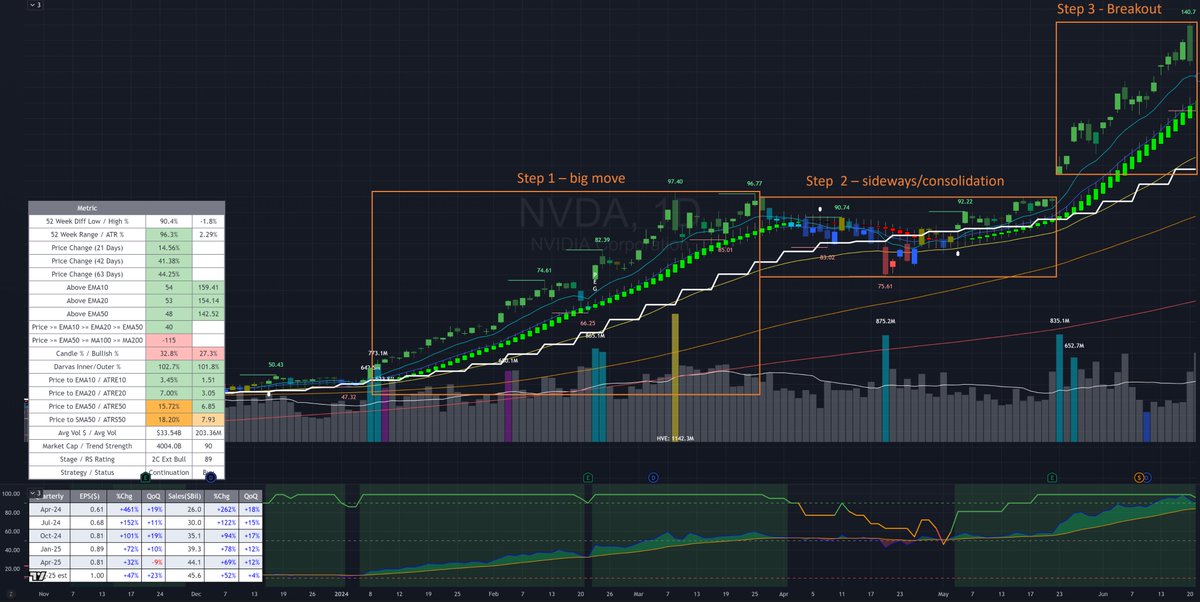
The “Qullamaggie Screener” is designed to be a “Breakout Scanner”, which Kristjan explains has 3 steps (taken directly in his own words from his own website):
1. A big move higher sometime in the past 1-3 months. This move can be anywhere from 30-100%+ and usually lasts a few days to a few weeks.
2. An orderly pullback and consolidation with higher lows and tightening range in the consolidation phase.
3. A range expansion (breakout) out of that consolidation. The consolidation phase is usually 2 weeks to 2 months. During the consolidation the stock price “surfs” the rising 10- and 20-day. and sometimes toe 50-day moving average.
Further, Kristjan outlines on his website that we should:
“Scan for the 1 or 2% of stocks that are up the most over these 3 timeframes
1-month
3-month
6-month
This is how you find the stocks that are leading right now.”
Step 1 – A Big Move
For Step 1, this is accomplished in the screener by the criteria
- Relative Strength >= 97 (1W, 1M, 3M or 6M)
Technically, the RS should be restricted to 98 or 99 (for the top 1% or 2%) and it should be 1-month and/or 3-month (as outlined in Step 1) but Kristjan also mentions 6-month when talking about a scan so that is included too.
1-week is my own addition to try to find stocks potentially early in a move.
I set the threshold to "Top 3%" (RS 97) rather than 2% which I think is reasonable given there are additional qualifying criteria in the scanner.
The threshold could be raised if there are too many stocks passing the scan and/or additional criteria added as outlined in the post ��switches” and “levers”.
https://t.co/3sMzXxZK15
Using $NVDA as an example of Step 1, from the 1st Jan 2024 until 25th March 2024, $NVDA went from $52 to $96 – a 84% move (see screenshot)
Step 2 – An Orderly Pullback & Consolidation
For Step 2, we require an “orderly pullback and consolidation with higher lows and tightening range in the consolidation phase”.
This is essentially what Mark Minervini describes as a "Volatility Contraction Pattern" (VCP) which, by definition, means the volatility (ADR and ATR) contracts.
The Qullamaggie Scanner is NOT designed to identify stocks in Stage 2 since it looks for stocks with "above average ATR".
To scan for Stage 2 stocks, please refer to this post.
https://t.co/gLJlR8GLcw
Kristjan stated in his streams that "High ADR is Gold, low ADR is 💩" yet in Stage 2 you want the ADR to be significantly lower than normal for the stock.
Essentially, the ADR/ATR should be high in Stage 1, low in Stage 2 (by definition), then high again in Stage 3.
For arguments sake, let’s say that $NVDA Stage 2 was from 25th March 2024 until 22nd May 2024 (see screenshot).
The challenge with Stage 2 stocks is that they are “going sideways”. You don’t know for how long or whether they will breakout. Running any scanner for stocks in Stage 2 will give a list of "have been's" stocks - stocks that just recently made a big move and are doing nothing now. Maybe they breakout again for the next leg higher but who knows when or if this will happen.
In practical terms, you would need to find these stocks, create a list and then track them regularly for clues of the next big move... maybe this is where the true gold is for people willing to put in the work involved in monitoring the Stage 2 stocks...
Step 3 – Breakout out of Consolidation
The Qullamaggie Scanner IS designed to identify stocks that are in Stage 3. However, as a word of caution, this includes stocks potentially near the end of Stage 3 that may be about to go sideways or pullback/consolidate -returning the Stage 2.
All the Stage 3 stocks are included for two reasons:
1) You never know how long or how far a stock can run, even when extended. For example, look at $RBLX which has been extended (as measured in ATR extension to the SMA50) since 14th May yet ran up from $80 to $108.
2) Showing all stocks that currently qualify for the scan provides a “Modelbook” of how the charts should develop when working well. These stocks are most likely to be at the top of the list while new candidates are towards the bottom.
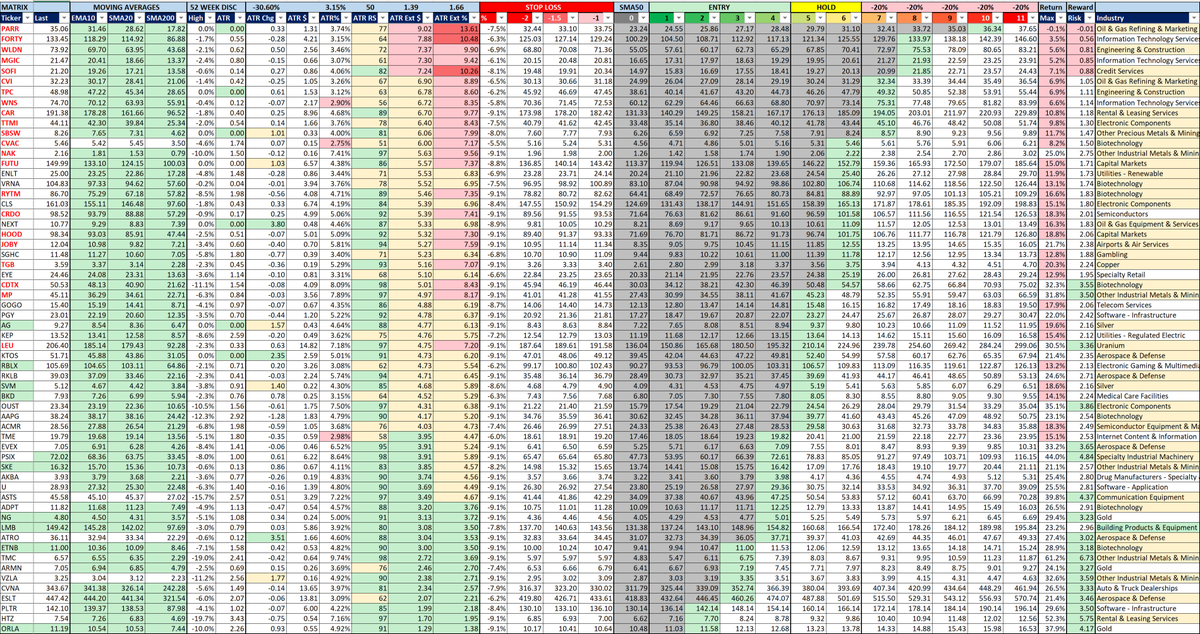
In the Qullamaggie posts, the first screenshot is an “ATR Matrix” (pic 2) which is always sorted by “ATR Extension to SMA50” (largest-to-smallest) and the tickers are provided are the “bottom 50” in the same sequence. The higher up in the screenshot (and the earlier in the list of tickers) then the more likely the stock has been in Stage 3 for a period of time but it is best to review the charts to establish when Stage 2 ended and when Stage 3 began (along with how long in Stage 3).
Stocks that are 7x or more extended from the SMA50 are shown in bold red font - these are stocks that are potentially over-extended.
For further information or the ATR concept, see this post:
https://t.co/ECCxqtx5Az
Note, the Qullamaggie scan is NOT a watch-list as detailed in this post. I do highlight the Ticker cells in green or yellow that are on my watch-list.
https://t.co/DZqbeJUKu7
$NVDA Stage 3 was from 23rd May 2024 until 18thnd June 2024 (pic 3).
( $NVDA may not be the best illustration of this concept but it is a widely followed stock)
Hopefully this adds some clarity and context.
Best of luck! 🍀
Average True Range & Its Impact on Position Sizing
The Average True Range (ATR) of a stock directly impacts the position size (i.e. % allocation) if the loss is to be equal in dollar terms.
In this illustration,we are setting the stop-loss at 2x ATR (Keltner Channel) or a maximum of -9.09%, whichever is the smaller loss.
As losses work geometrically against you, a capped loss of -9.09% is used as it requires a subsequent 10% gain to get back to breakeven.
Let's say the trader has a $100,000 account. We are going to risk no more than 0.5% per trade or $500.
$DELL currently has a price of $119.37 and an ATR of 3.23%. This permits a stop-loss of -6.46% (-2x 3.23%) so the stop would be placed at $111.65.
Allocating 7.731% ($7,731 of the $100,000 account), incurring a loss of 6.46% results in a loss of $500.
$HIMS currently has a price of $64.22 and a higher ATR of 7.16%. At -2x ATR , the stop-loss would be -14.32%, which is too large so it is capped at the maximum of -9.09%. The stop would be placed at $58.38.
Allocating 5.5% ($5,500 of the $100,000 account) means that incurring a loss of 9.09% results in a loss of $500.
In practical terms, traders typically want faster moving (above average ATR such as 3%+) stocks to "move the needle" and quickly compound the account.
Personally, I would keep my stops tighter (maybe 1.5x ATR or use LoD on entry as the stop) but that is personal preference.
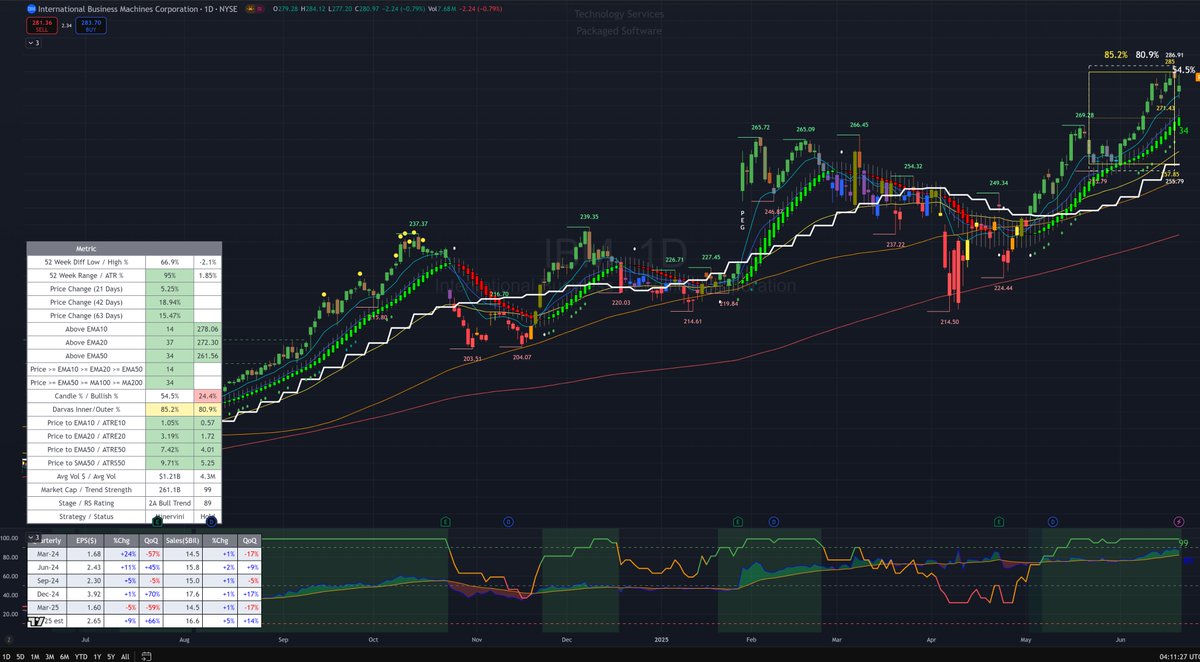
It should also be noted that when stocks "build the handle" of a "Cup & Handle" pattern and/or form a "Minervini Volatility Contraction Pattern" (VCP), by definition the volatility (ATR) has contracted so screening for stocks high ATR will exclude these stocks.
Then there are stocks like $IBM (with one of the few real "Quantum" computers) that has an ATR of "only 1.85%" and $PM with an ATR of "only 1.68%" and their 12 month performances... but that's a different conversation.
I asked ChatGPT to check the calculations I have yet to have ☕️
Hope this helps.
Position Sizing - Scale In, Scale Out or Fixed?
When learning to trade, the first step is to find a trading strategy that suits your personality and time constraints.
You learn how to use or develop scans that fit the chosen trading style, what to look for in a “good setup” and devise a set of entry and exit rules - for both positive (wins) and negative (losses) outcomes. Hopefully, these rules have been tailored asymmetrically so that wins are larger in size to losses.
With the above in place, you then come to the next puzzle “How much do I invest in each trade?”
In the beginning, you may be inclined to “go with your gut” placing larger bets on things you believe are “sure things” and taking smaller positions (what you might lovingly refer to your friends as "punts") in moonshots and stuff you don’t understand.
After a few weeks or months of this approach and perhaps a big loss or two on the sure things that either didn’t work out or you lost patience waiting and sold early, you might conclude that your gut is not quite the crystal ball you thought it was.
This leaves three possible allocation strategies:
1) Fixed Size
Fixed size actually comes in two approaches.
Beginner traders will start with the first approach as it seems both sensible and logical but as they learn more about risk and volatility, they will be inclined to adopt the second approach.
i) Fixed capital per trade
This approach involves allocating a fixed percentage of the account value (say 5%) to each trade. If the total capital is $100k, then each trade would be allocated 5% or $5k per trade.
This approach does not take into account the volatility of the stock and therefore assumes all trades have equal probabilities in terms of gains/losses and expected outcome.
As the trader learns about volatility, Average Daily Range (ADR) and Average True Range (ATR), they should start to think in terms of risk units (in other words ‘R’).
ii) Fixed risk per trade
When thinking in terms of risk (R), the trader will define the amount of money to potentially lose on a trade upfront and then size the position accordingly, based on the volatility of the stock and the stop-loss level(s) they have determined.
The stop-loss may be at the Low of Day (LoD) when the trade is opened or some logical support (pivot) point that if a stock breaks this price level, it has lost support and the trade is closed.
Alternatively, the stop-loss may be calculated based on ADR/ATR of the stock. For example, if the stock has an ATR of 5% (i.e. the stock moves +/-5% on average per day) then the stop losses might be set at a single level (say -1.5R) or taken in tranches (one third at -1R, -1.5R and -2R) from the purchase price.
You can read more on position sizing based on ATR/ADR in the post below:
https://t.co/nvv9wJ8pn8
Using the fixed size allocation style, the trade is allocated an amount in a single purchase with the intention to hold the position until an event occurs such as stop-loss or profit target or technical signal (such as close below MA10/20/50).
We now move on to the second allocation strategy - scaling out.
2) Scale Out
Many excellent traders adopt a “scale out” allocation strategy whereby a trade is placed (say 5 to 10% of the account value) when purchasing the stock.
Around day 3 to day 5, the trader will look to “lock-in” a profit by selling part of their position, usually one-third to fifty percent. The stop-loss is then moved to break-even (or higher) so that even if the stock hits the stop-loss, the trade is profitable.
The legendary @markminervini (2 x USIC champion) refers to this as “free-rolling” and improving your worst-case scenario.
The unsold portion of the position is then allowed to work and provided it does not violate the sell rules (such as close below a key moving average).
The drawback of scaling-out is the risk of sharp declines and gap-downs during the initial few days where you have effectively “full-size” in the trade. Having stop-loss orders in place will mitigate (to some degree) sharp declines but overnight gap-down risk would still exist.
The benefits of the approach is that once the profit has been locked in from the first few days, you are more likely to be patient with letting the trade work and not micro-manage - the “worst-case” scenario has been improved dramatically when “free-rolling” (although risks of large over-night downward gaps persist as they do in all strategies that hold overnight).
3) Scale In
The inverse of scaling “out” is to scale “in”.
Scaling in involves starting with a small (pilot) position and then increasing the trade size as the market confirms your thesis.
For this strategy, you should first determine what a “full-size” position is (say 10% of the fund) and how many incremental buys you intend to make. If we assume 4 total buys (1 initial and 3 adds), each purchase would be 2.5% of the fund. If the fund is $100k, you would buy $2,500 each time.
A simple rule would be “each time I am up 5% on the average cost at close, provided the stock is closing at a new high and remains not too extended* I will add another 2.5% until a maximum of 10%.
* still in the range 0-to-4x ATR as explained in this post
https://t.co/KwniQ2PAJg
With each additional purchase, the stop-loss for the entire position should be re-calculated based on the most recent (highest) cost.
The table shown outlines the concept using a fixed -7% stop-loss
The drawback of this approach is that the stock might move quickly upward just as you take the initial purchase, becoming too extended for additional buys.
In this scenario, you would then have to wait for the stock to pullback, consolidate or go sideways then push away from the ascending moving averages.
The benefit is that you are taking your smallest size when the market has yet to confirm your thesis on the stock moving up. If the stock drops after your initial purchase, it is easier to take that small loss on a small size position.
Overnight or large gap downs can occur after you have scaled into the position - although there should be a profit cushion to absorb some of the drawdown.
To illustrate, let's take $PLTR at 22nd April 2025 when it closed at $93.99. As it broke through $100, the initial purchase is made 25 shares with the stop-loss set at -7% or $93.
When the stock breaks through $105, the second purchase of 23.81 shares is made giving an average cost of $102.44. The new purchase is now 2.5% in profit. Stop loss is increased from $93 to $97.65.
When the stock breaks through $105, the third purchase of 23.24 shares is made giving an average cost of $104.09. The new purchase is now 3.3% in profit. Stop loss is increased to $100.03.
The final purchase would be $109.30 giving an average cost of $105.35 and the stop moved to $101.65.
$PLTR is now at $177.17 giving a return 68.2% on a 10% position in the portfolio.
Other than using a fixed William O'Neil still hard-stop of -7%, it could be ATR based such as -1.5 ATR from the highest cost.
Also, you could reduce the position size by 50% locking in profits if it closes below the SMA10/20 and close the position if closing below SMA20/50.
The goal of the "scaling in" strategy is to get positioned in the True Market Leaders (TML) by letting the market pull you in - as Mark Minervini might say by "progressive exposure" both within the position and with new positions in different stocks.
Note, there are 241 stocks with a market cap of $1B+ that have gained 50%+ YTD.
Ultimately, whatever allocation strategy is chosen, there are some rules that should be followed:
- Keep losses small and cut losses quickly (while allowing the position enough wiggle room for its daily fluctuations).
- Allow winners to work. Don't be in a rush to "lock in profits" while holding your losers hoping to get out at break-even. The stock doesn't know (and if it did it would not care) that you own it. This is what Peter Lynch refers to as "Pulling the flowers and watering the weeds".
- Never add to losers. "Losers average losers" was famously on the wall of Paul Tudor Jones office.
- If you are going to add, add to winners BUT only when there is a new setup that you would have bought if you were not in the stock already. Don't add simply because you own it.
- Focus and think in terms of R. You want asymmetric reward-to-risk. Never less than 2 and preferably 3+.
- Win-rate shouldn't be forgotten but it is always in the context to reward-to-risk.
- Don't get FOMO. If you missed a trade, you missed it. There are always other trades maybe not today, tomorrow or this week but there are more opportunities per year than anybody has capital to deploy.
Hopefully this helps - best of luck!🍀
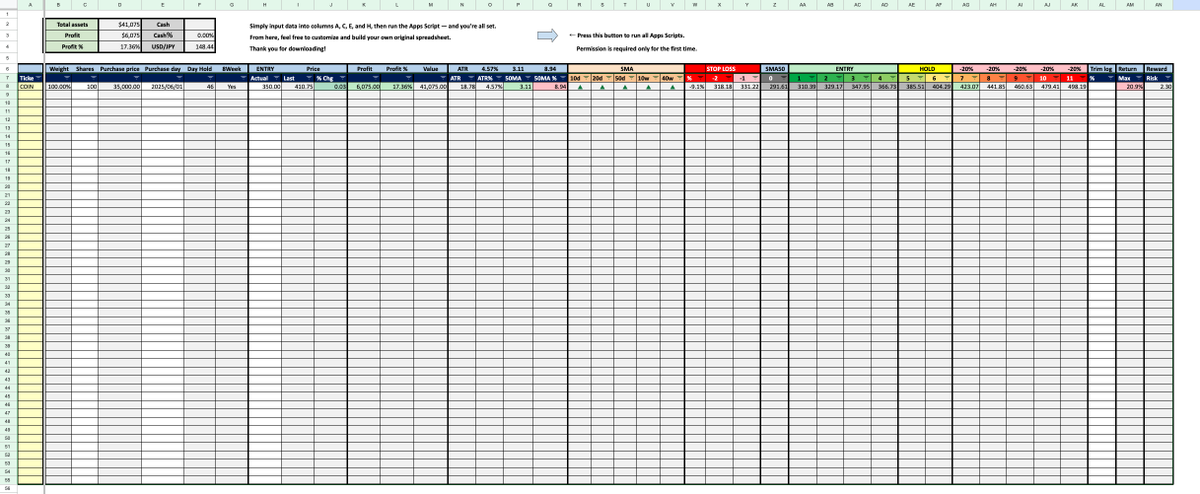
Portfolio Management Spreadsheet
This tool is a portfolio management spreadsheet that uses ATR (Average True Range).
You can make a copy of the file from the link below, enter a few basic numbers, run the Apps Script, and the setup will be completed automatically.
(Apps Script requires permission only once.)
https://t.co/okOHy1Lla4
The spreadsheet is fully customizable, so feel free to modify it to suit your needs.
You can also use it as a monitoring tool for your watchlist.
Special thanks to Steve Jacobs @SteveDJacobs for creating the base of this tool and generously sharing it🤝