Good first step in $btc and $eth price action, but we are not out of the woods just yet. OBV and momentum have not flipped positive yet with recent price moves. Risk of another retest of lows is still there.
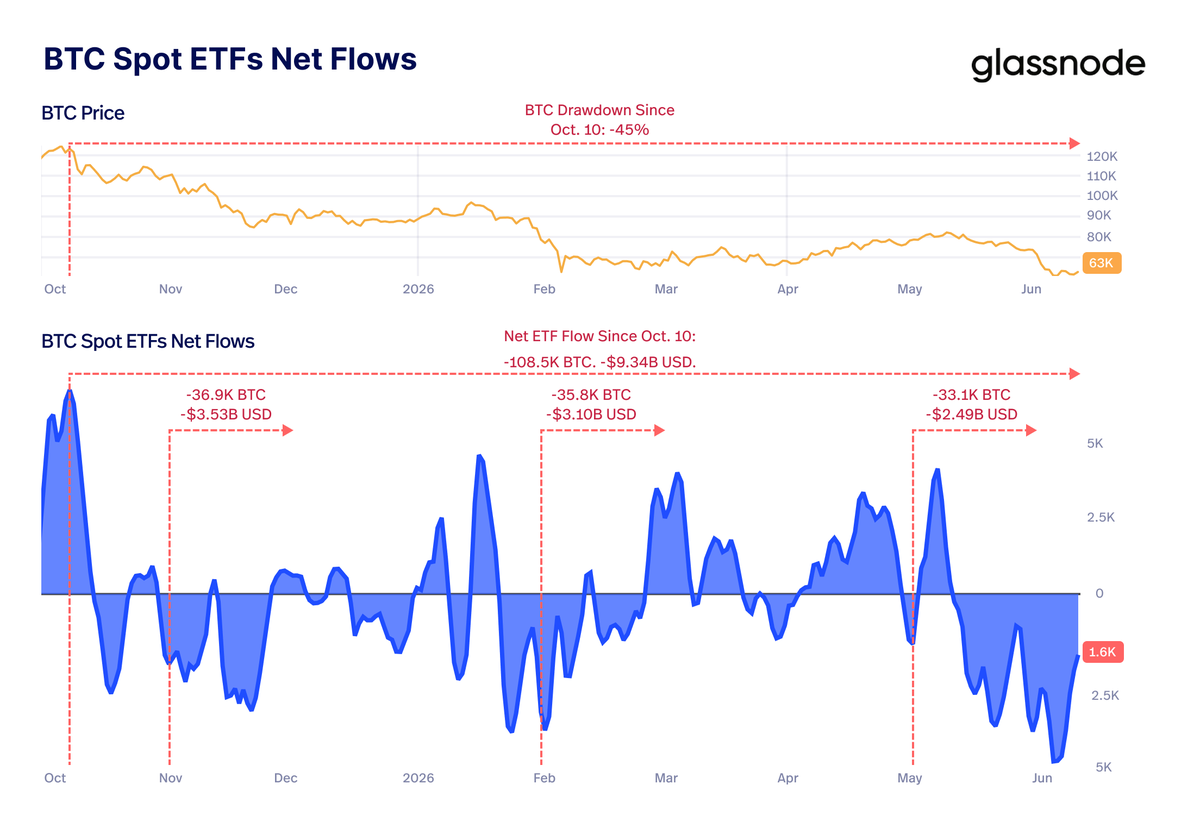
ETFs selling has not been a one-off event.
It has been a persistent source of pressure throughout the entire bear cycle.
Since the October 10 selloff:
→ Bitcoin is down roughly 45%
→ ETFs have distributed 108.5K BTC
→ Equivalent to roughly $9.3B in net outflows
The interesting part is how similar the three distribution waves have been in size, and how each wave created a new leg lower in price.
That is the key message: this has not been random selling.
It has been a repeated ETF distribution pattern pressuring Bitcoin through the bear cycle.
Now that Bitcoin is deep in capitulation, what comes next?
Price Momentum is sitting at an extreme negative reading.
The first signal of structural reconstruction is simple:
Momentum needs to cross back above -0.5.
That is the moment when price starts building a new foundation.
It tells us capitulation is beginning to ease and trend expansion is possible again.
Until that happens, the base case remains fragile:
→ price builds a range
→ or price continues grinding lower
Capitulation is a process, not an event.
Let’s study how the 2022 bear market unfolded.
First came the Stress Build-Up.
Then came months of Capitulation, where the Supply in Profit/Loss bands stretched and compressed, reflecting a market trapped under sustained pressure.
Next came the Stress Peak during FTX:
the final wave of panic, forced selling, and emotional exhaustion.
Only after stress stopped expanding did the Bottom Formation begin.
The lesson:
Bitcoin cycle bottoms are not formed when stress reaches its maximum.
They are formed when BTC changes hands through a prolonged process of stress among holders.
It is crystal clear:
Every time the Risk Index signals that selling pressure is structurally overwhelming the market, what sits underneath is institutional distribution.
Observe the pattern:
→ High Risk expands
→ ETF flows deteriorate
BTC ETFs are still slightly positive in 2026, but the margin is now extremely thin:
only +4.5K BTC net YTD.
The problem is the reversal.
After strong accumulation in March and April, May has flipped back into distribution.
That changes the framework.
The Risk Index is now moving into high-risk territory while ETF flows are deteriorating simultaneously.
That tells us spot ETF demand is no longer absorbing selling pressure effectively.
And without strong ETF support underneath, the Risk Index can continue accelerating higher.
And now the warning is flashing.
The Risk Index has re-entered high-risk territory.
That doesn’t confirm breakdown yet.
But it confirms that selling pressure is no longer being fully absorbed.
This is exactly why the low-risk regime was so crucial:
As long as Risk stayed suppressed, BTC could absorb pressure and sustain expansion.
Now the structure may be changing:
→ Risk has destabilized
→ BTC lost the $78K–$79K breakeven zone
→ Sellers are starting to regain control
The key now is whether Risk accelerates higher from here, or BTC starts absorbing selling pressure again.
If Risk reanchors back below 25, BTC can still stabilize.
If high risk expands, this becomes the first solid confirmation that the breakdown warning was the first shot.
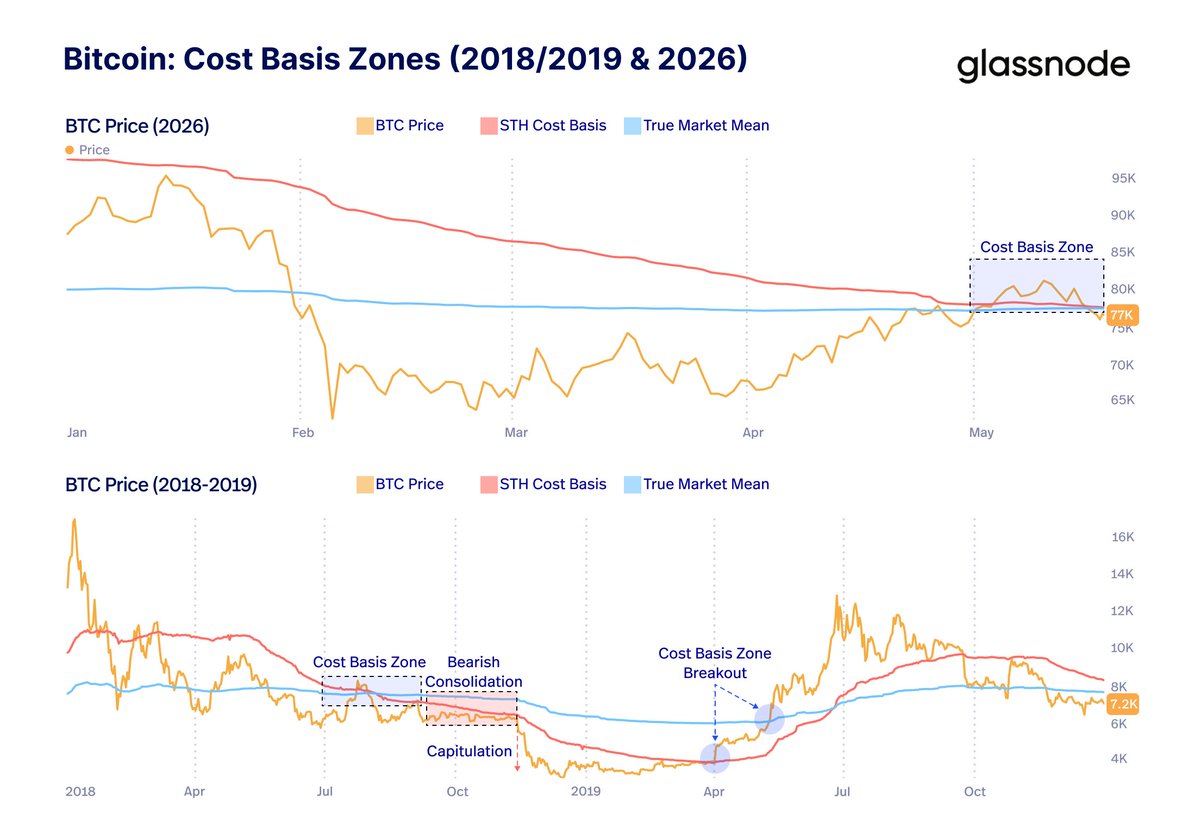
One bearish scenario we have to consider:
What if Bitcoin repeats the 2018–2019 cost-basis rejection structure?
Back then, BTC reclaimed the cost-basis zone and started consolidating above the True Market Mean and Short-Term Holder Cost Basis.
At first, it looked like the bear cycle was over.
But price failed to generate sustained expansion.
Then Bitcoin lost the zone, started consolidating below the cost-basis cluster, and eventually rolled into the final capitulation of the bear cycle.
Now, with BTC struggling below $78K, price is again below the cost-basis zone after losing it.
This is not confirmation of breakdown.
But structurally, it is one of the key bearish analogs bulls cannot ignore.
Bitcoin momentum has faded from full max momentum.
But as long as it does not fall below -0.5, this does not imply breakdown.
What usually follows is consolidation.
The key reference is June–July 2025.
Momentum faded from full strength, but the indicator never broke below -0.5.
That allowed price to consolidate, rebuild, and eventually push toward new highs.
In the current setup, the same rule applies:
As long as momentum does not degrade significantly, the base case is consolidation, not breakdown (not yet).
What is happening with SOL ETFs?
They have less history than BTC and ETH, but the signal is clear:
SOL ETFs have been in sustained accumulation throughout 2026.
January delivered the strongest monthly inflow, while May has reaccelerated sharply.
That means SOL ETF demand remains structurally supportive, despite intermittent distribution in February, March, and April.
But there is one important nuance:
SOL impulse has not been consistent throughout the accumulation phase.
That tells us ETF demand is supportive, but not enough by itself.
That tells us ETF demand has helped sustain the structure, but not ignite momentum.
A typical accumulation structure.
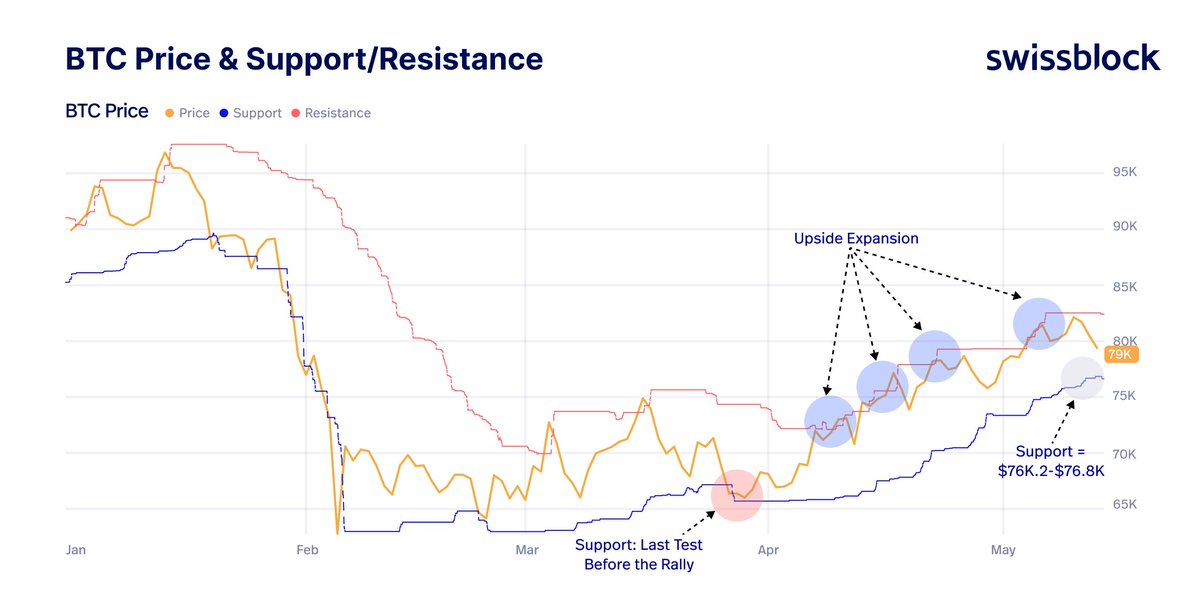
Bitcoin continues building a stair-step expansion structure.
Since the late-March lows, BTC has followed the same sequence repeatedly:
→ Resistance gets reclaimed
→ Price consolidates
→ Support steps higher
→ Expansion continues
Every breakout has been followed by a higher support formation.
As long as BTC does not break $76.2K–$76.8K, the bullish structure remains intact.
Hold that zone, and Bitcoin keeps room to expand the structure higher.
Bitcoin is at a decisive point.
Capital is about to choose:
→ Deploy decisively into the market
→ Or retreat back into risk-off mode
USDT Dominance is sitting on the edge of a breakdown.
If it breaks support, it would signal capital moving out of protection and back into risk-on, with Bitcoin likely receiving the strongest inflows.
At the same time, BTC has absorbed selling pressure so far.
The Risk Index remains anchored near zero, giving price structure stability.
If USDT Dominance breaks lower while Risk stays suppressed, Bitcoin can keep rising and continue absorbing whatever selling pressure comes next.
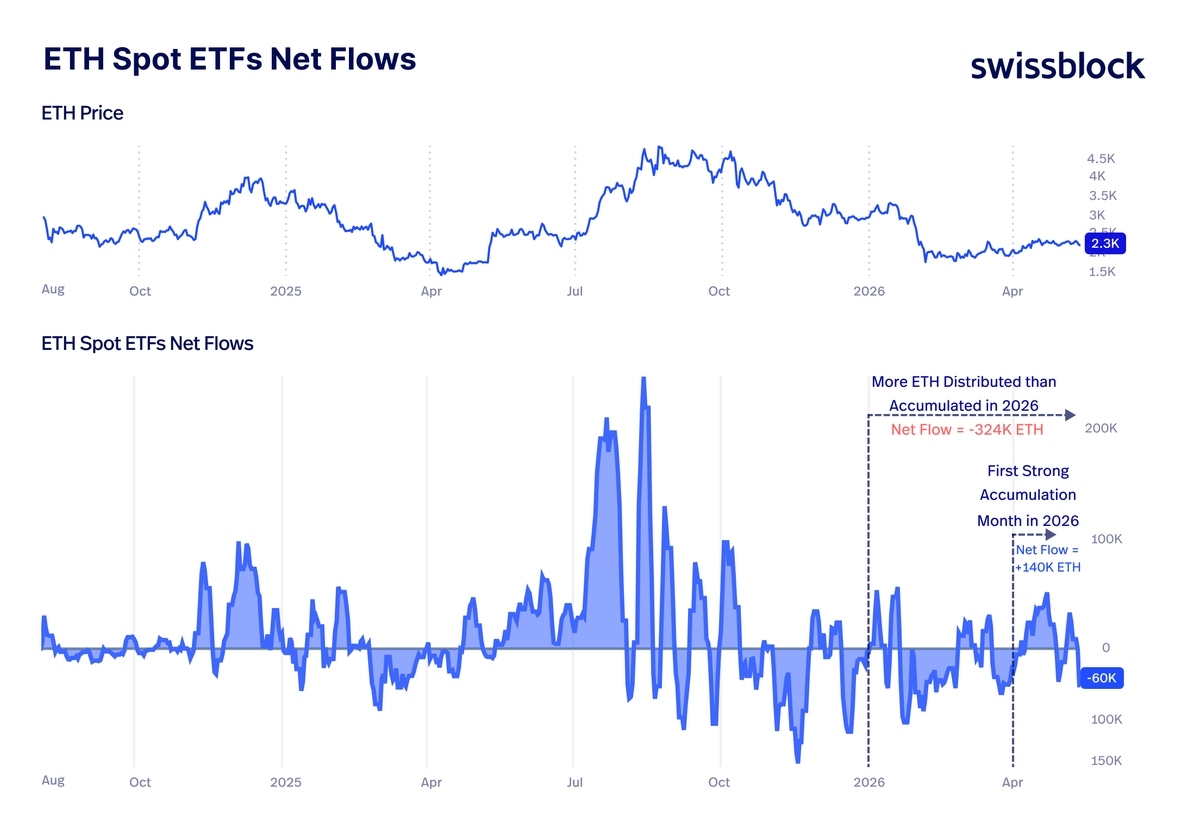
ETH ETF flows had their strongest month of the year in April.
But despite that, ETH ETFs have still distributed more ETH than they have accumulated in 2026 overall:
→ Net Flow 2026: -324K ETH
That reflects the bigger problem behind alts this year:
ETH never became a sustained leadership engine.
Without ETH strength and traction, most alt rallies fade back into volatility.
New addresses appearing on the XRP network have collapsed from 18k/day in Dec 2024 to 2.7k/day today, an 85% decline.
Monthly active supply tells a similar story, dropping from 7.45B XRP/day to ~2B XRP/day over the same period.
The speculative wave that drove XRP's late-2024 surge has largely unwound at the network level.
📉https://t.co/GlAEVUSaZ5
One of the clearest signals of Bitcoin’s early expansion:
ETF flows remain aligned with the Risk Index.
When the Risk Index stays in high-risk territory, selling pressure dominates
→ ETF flows tend to weaken or turn negative.
When the Risk Index resets into low-risk territory, selling pressure gets absorbed
→ ETF accumulation returns.
That synchronization is still in place.
Even when the Risk Index ticked slightly higher last week, ETF selling appeared briefly, but accumulation quickly resumed.
That tells us ETF demand is absorbing selling pressure.
This remains a flow-driven breakout.
This is still a BTC-led market.
But alts have shown their first sign of life.
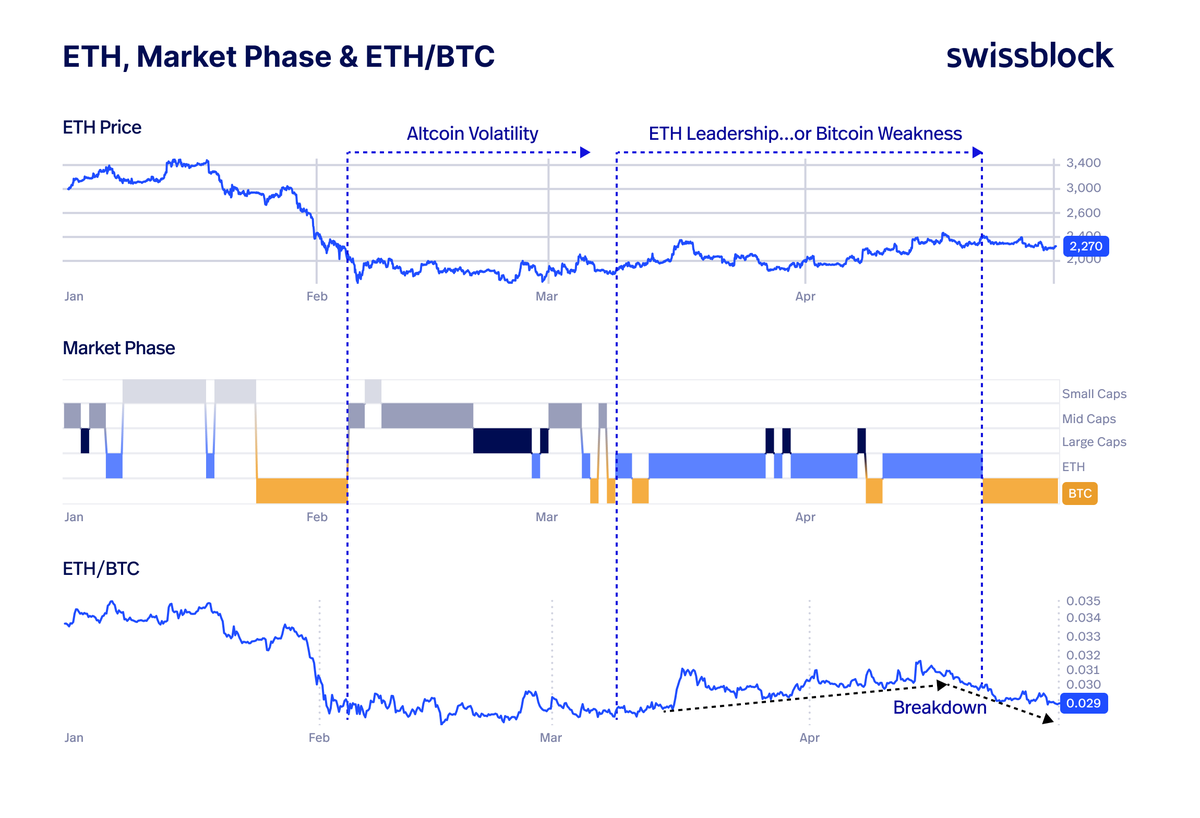
After a deep depression phase, ETH first stabilized the market but compressed altcoin volatility.
Then BTC reclaimed leadership, strengthened its bullish trend, and pushed to a 3-month high.
Now alts are showing early recovery signs.
A small relief window is opening as Bitcoin reaches its limits.
The key:
Can this relief become sustainable?
Only if BTC confirms expansion above $80K.
With Bitcoin capturing $80K, alts aren’t recovering yet.
They’re just reacting.
Large caps continue to underperform BTC, and every rally looks the same:
→ Quick spike in momentum
→ Immediate fade
Impulse confirms it:
Alts have not recovered.
They have only seen relief.
For momentum ignition, impulse needs to flip and sustain above 25%.
If Bitcoin consolidates above $80K, it may only be a matter of time before rotation starts moving into alts.
Bitcoin impulse is reigniting.
Every major BTC expansion tends to follow the same sequence:
1 → First ignition
2 → Correction/reset
3 → Second ignition
4 → Exhaustion/deeper correction
Right now, BTC is entering another first ignition phase.
The strongest moves usually happen during the transition from:
reset → reignition → expansion.
But there’s also a warning:
When impulse overheats too quickly, exhaustion can follow fast.
The key now is not just price breaking higher.
It’s whether impulse can sustain while BTC consolidates above the cost-basis zone.
With BTC already pressing into resistance, a sustained impulse after this reset could trigger a second ignition toward $84K–$86K.
Bitcoin has reasserted dominance.
But that has weakened alts.
At this point, if BTC sneezes, alts get the flu.
Why?
ETH “led” from March into April, but not from real strength. It was mostly BTC weakness.
The normal rotation is:
BTC leads → ETH follows → alts ignite
The key now:
If BTC consolidates above $80K, rotation into ETH/alts can begin.
If BTC loses leadership before that, it signals BTC weakness, and alts would not just catch the flu, they would get hit hard.
A crucial regime shift is unfolding in Bitcoin.
The Market Phase has anchored in BTC.
Capital is concentrating in Bitcoin, not rotating outward.
That mainly strengthens BTC, but the important part is the timing:
This shift is happening just as BTC is starting to break higher, while BTC dominance breaks out of a multi-month range.
This is typical of pre-expansion phases.
For Bitcoin to lead the market, this structure needs to hold.
Otherwise, weakness can return quickly and drag the entire market with it.
SOL/BTC is hanging off a cliff.
It’s now sitting at critical support.
Bitcoin has consolidated and is showing strength, but SOL/BTC keeps weakening, testing a multi-year support zone.
That reflects the state of altcoins right now: broad weakness, just reacting to BTC. Flows remain highly concentrated.
Bitcoin needs to confirm bullish expansion first.
Otherwise, if this level breaks, SOL and the rest of alts could be dragged lower fast.