My first-ever submission to #TidyTuesday. Week 38 2023's data set was CRAN packages, so I took a bit of time to explore package that deals with "Color Palette". Here's the network visualization.
Code: https://t.co/mMm1ordUh3
#RStats#dataviz
been seeing population density 3d maps in feeds and they are fun, and I wanted to try making one for Japan too with using 3 of my favourite tools. #r#rstats & #blender & #DaVinciResolve data source: https://t.co/hC6z64PYVV
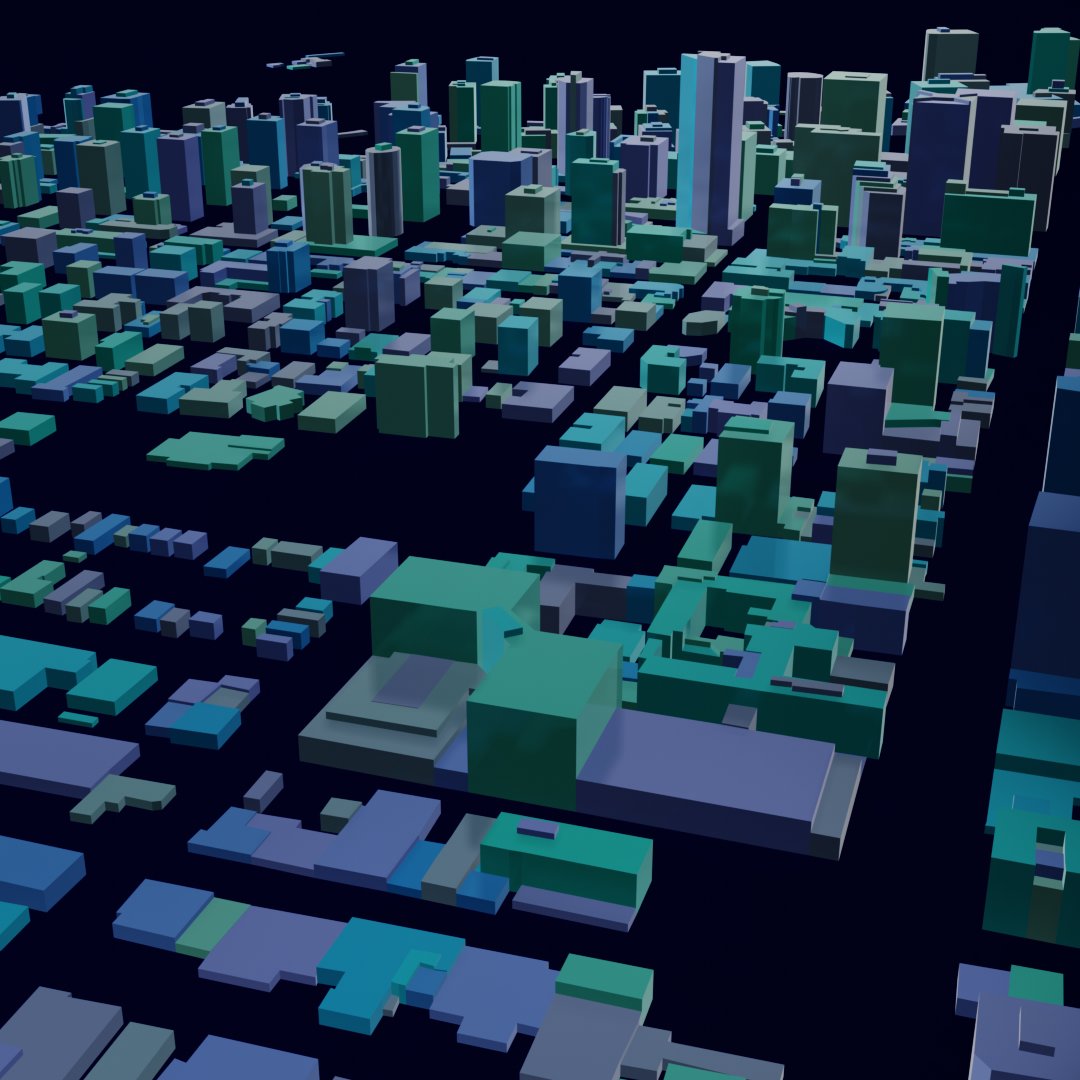
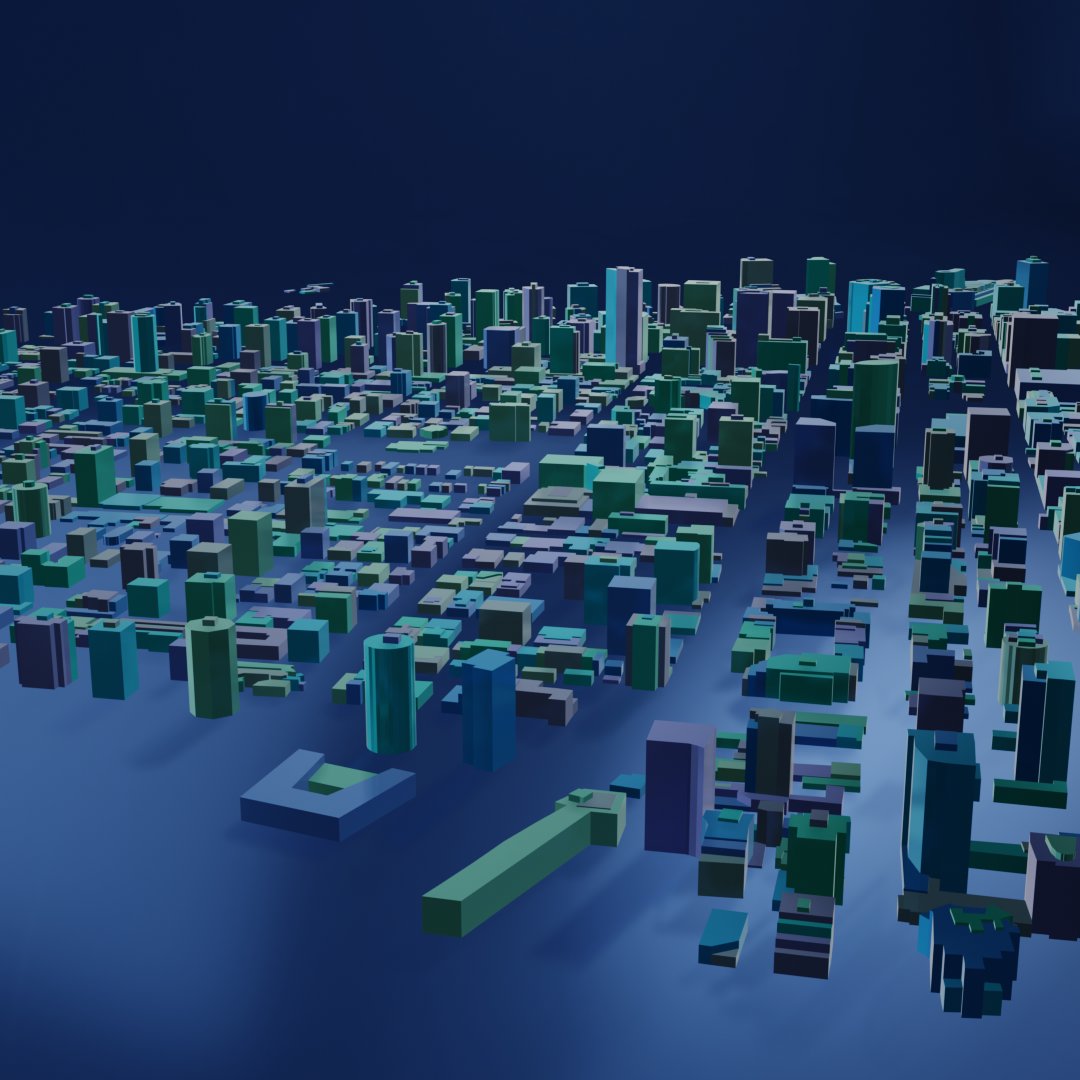
Been wanting to participate in #30DayMapChallenge in November again, but just have been little too busy. Day 14 challenge was actually a Map with a new tool! So decided to create building footprint of Downtown #Vancouver using data from @VanOpenData & using #Blender GIS Addon
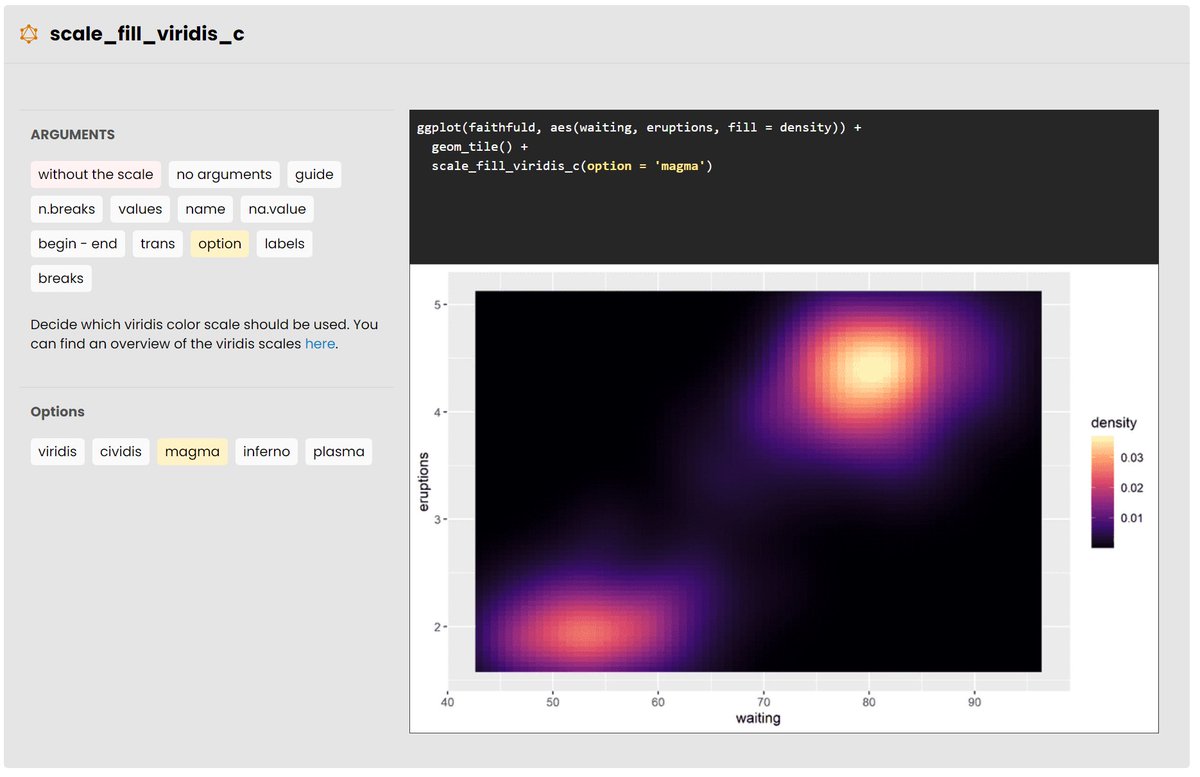
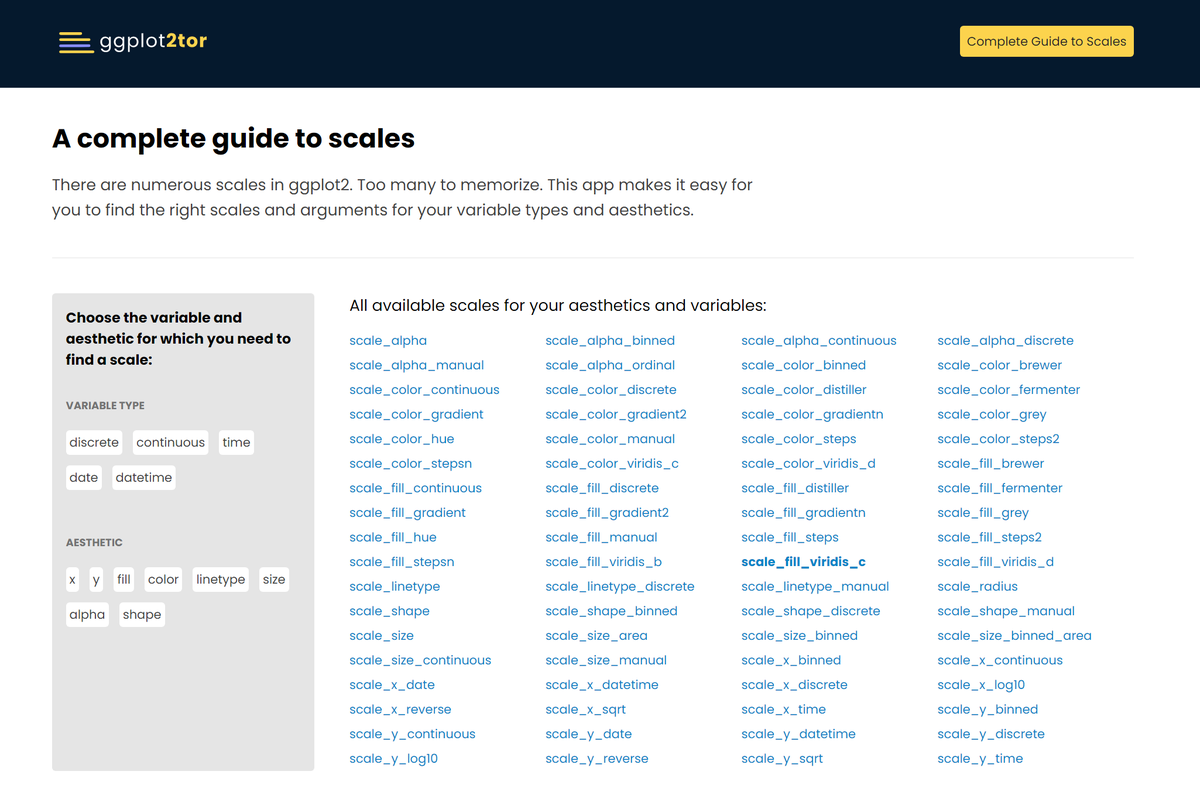
If you have trouble getting an overview of the many scales in ggplot2, this is for you. I have written a comprehensive guide to scales with loads of examples: https://t.co/gaMFCaW0M5
#rstats#ggplot2
Just watched @allison_horst's talk (https://t.co/1pUJk45FZ4). Inspired to share some random art created with R.
Been wanting to try ASCII Art after seeing tutorial (https://t.co/cVkdHPOYjv) and finally tried out.
Code: https://t.co/KGz9XgPC73
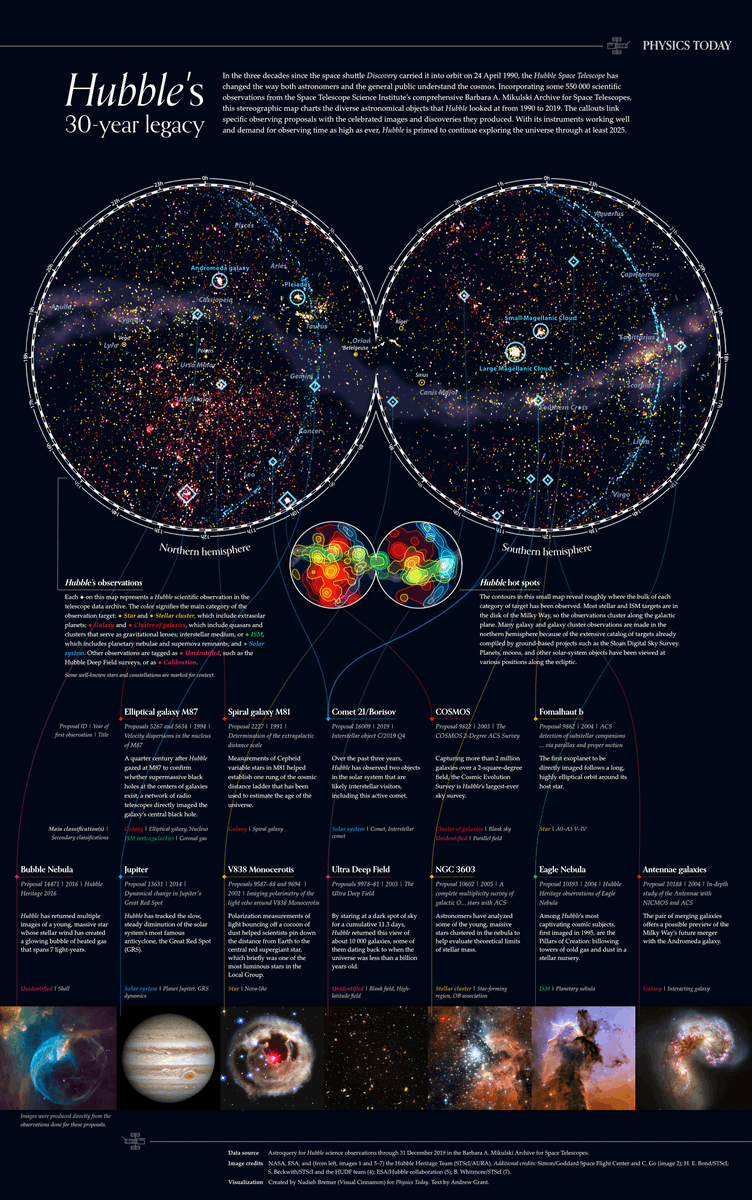
NEW!!! 🎉 One of my proudest #dataviz ever!! 🛰️😃
A birthday present to @NASAHubble that I've made for @PhysicsToday visualizing 30 years of observations, ±550k tiny diamonds in the sky ✨
I've poured my ❤️ into this, I hope you'll enjoy exploring it: https://t.co/SB2wX6hgnK
“If you are irresponsible enough to think that you don’t mind if you get the flu, remember it’s not about you - it’s about everybody else.”
Intensive care specialist Professor Hugh Montgomery explains why this coronavirus is different from the ordinary flu.
A new animation showing the variation of nitrogen dioxide emissions over #China (Dec-March) – thanks to @CopernicusEU#Sentinel5P data.
Sentinel-5P currently provides the most accurate measurements of NO2 and other trace gases from space.
ℹ️https://t.co/Gn9mvSnIu6
3D Transitions in #tableau. 500,000 polygons, 180 frames. All transitions were calculated inside @tableau workbook. This is not Tableau animation feature, just rendering
cc
@AllanWalkerIT, @pauliface